

Key Insights
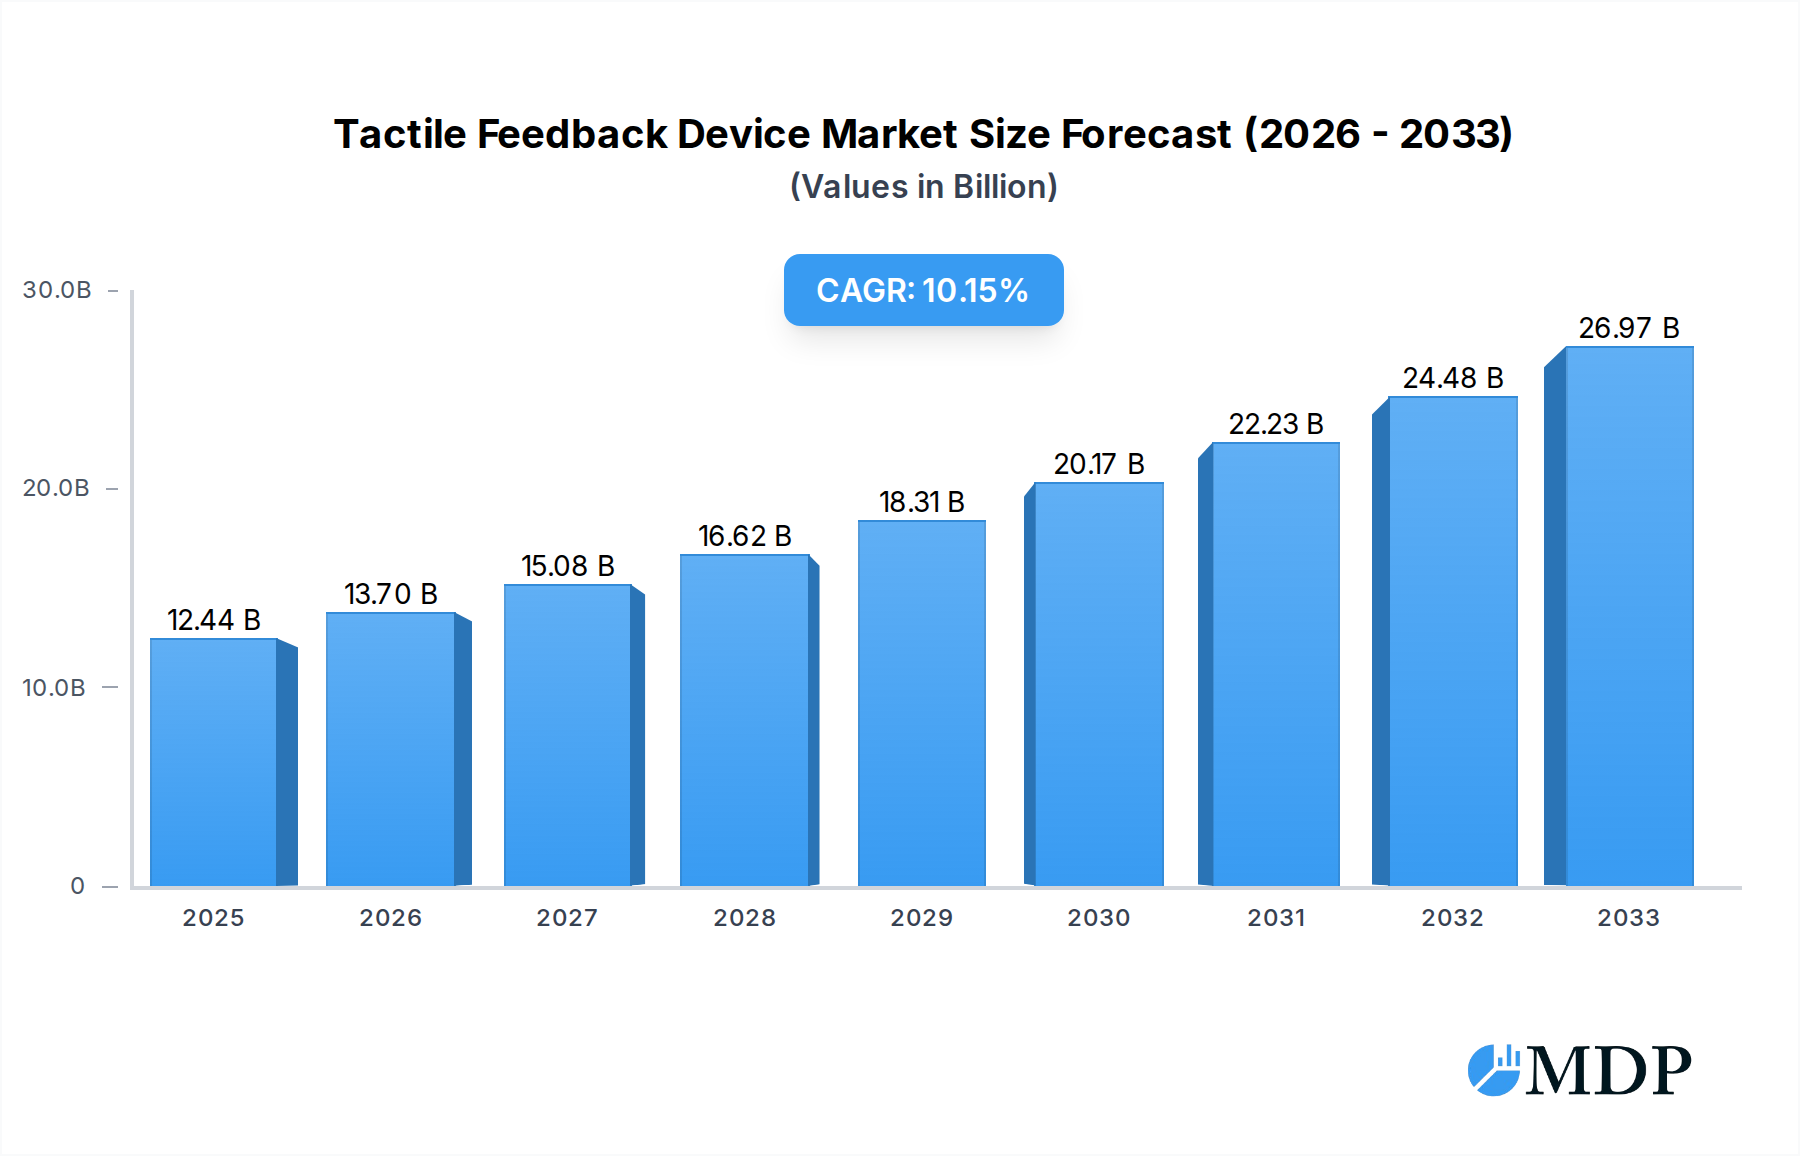
The global tactile feedback device market is poised for significant expansion, with an estimated market size of 12.44 billion USD in 2025. This growth is fueled by a robust CAGR of 10.1% projected over the forecast period (2025-2033), indicating a dynamic and evolving industry. The increasing integration of haptic technology into everyday devices, from smartphones and wearable gadgets to automotive interiors and smart home appliances, is a primary driver. Consumers are increasingly seeking more immersive and interactive experiences, which tactile feedback uniquely provides. The rising adoption of advanced driver-assistance systems (ADAS) in vehicles and the burgeoning demand for sophisticated gaming and virtual reality applications further bolster this trend. Emerging applications in medical devices and industrial automation also represent substantial avenues for market penetration and growth.

Tactile Feedback Device Market Size (In Billion)
The market segmentation reveals a healthy balance between different actuator types, with Eccentric Rotating Mass (ERM) Actuators and Linear Resonant Actuators (LRAS) leading the charge due to their established performance and cost-effectiveness. However, innovation in "Other" actuator types, potentially offering enhanced precision and energy efficiency, is expected to capture increasing market share. Geographically, the Asia Pacific region, driven by its large consumer base and rapid technological adoption in countries like China and India, is anticipated to dominate the market. North America and Europe will remain significant contributors, propelled by technological advancements and the presence of key players. While the market shows immense promise, challenges such as the initial cost of implementation in certain applications and the need for standardized development platforms could temper the pace of growth in specific segments. Nonetheless, the overall trajectory points towards a thriving tactile feedback device market driven by innovation and consumer demand for richer sensory experiences.
Tactile Feedback Device Company Market Share
Unlocking the Future of Interaction: A Comprehensive Report on the Tactile Feedback Device Market
This in-depth report delves into the dynamic global Tactile Feedback Device market, forecasting a robust expansion driven by advancements in haptic technology and increasing integration across diverse consumer electronics and industrial applications. Spanning the historical period from 2019 to 2024, the base year of 2025, and a comprehensive forecast period extending to 2033, this study provides unparalleled insights for industry stakeholders, including manufacturers, technology providers, investors, and end-users. We analyze market dynamics, identify key growth drivers, explore emerging opportunities, and highlight the competitive landscape, offering a strategic roadmap for navigating this rapidly evolving sector. The report leverages extensive data and expert analysis to deliver actionable intelligence on market size, segmentation, regional dominance, and future trajectories.
Tactile Feedback Device Market Dynamics & Concentration
The global Tactile Feedback Device market exhibits a moderate level of concentration, with a few key players holding significant market share, particularly in high-volume segments like mobile terminals. Leading entities such as AAC Technologies and Nidec Corporation are at the forefront, leveraging extensive R&D and established supply chains. Innovation remains a primary driver, with continuous advancements in actuator technology, power efficiency, and miniaturization pushing the boundaries of haptic experiences. Regulatory frameworks are gradually evolving to accommodate the integration of haptic feedback into safety-critical applications, particularly in the automotive sector, influencing product design and compliance standards.
Product substitutes, while present in the form of basic vibration motors, are increasingly being outpaced by sophisticated LRAs and piezoelectric actuators that offer nuanced and responsive tactile sensations. End-user trends are strongly favoring enhanced user experiences, with consumers actively seeking more immersive and intuitive interactions with their devices. This is particularly evident in the surging demand for advanced haptics in smartphones, gaming consoles, and virtual reality applications. Mergers and acquisitions (M&A) activity in the sector is on the rise, reflecting a strategic consolidation of capabilities and market access. We anticipate approximately 12 significant M&A deals within the study period, with companies seeking to acquire specialized technology or expand their product portfolios. The market share for leading players is estimated to be around 20-25% for the top three, indicating a competitive yet somewhat consolidated landscape.
Tactile Feedback Device Industry Trends & Analysis
The Tactile Feedback Device industry is poised for substantial growth, fueled by a confluence of technological innovation, increasing consumer demand for immersive experiences, and expanding applications across various sectors. The compound annual growth rate (CAGR) is projected to be a strong 18.7% over the forecast period. This remarkable expansion is underpinned by significant technological disruptions, including the development of advanced piezoelectric actuators, micro-electro-mechanical systems (MEMS) based actuators, and sophisticated waveform generation techniques that enable highly precise and localized tactile feedback.
Consumer preferences are increasingly shifting towards devices that offer richer and more interactive user experiences. This is translating into a heightened demand for tactile feedback in mobile terminals, where it enhances notifications, gaming, and overall usability. In the automotive sector, haptic feedback is crucial for improving driver safety and providing intuitive control over vehicle functions, reducing distractions. The penetration of tactile feedback devices in wearable technology is also escalating, as these devices aim to offer seamless and unobtrusive communication and alerts. Competitive dynamics are intensifying, with established players investing heavily in R&D and new entrants emerging with novel technologies. Market penetration for advanced tactile feedback in premium smartphones is already above 60%, and this is expected to rise to over 85% by 2033. The overall market penetration for haptic feedback devices across all addressed segments is projected to grow from approximately 35% in 2025 to over 60% by 2033.
Leading Markets & Segments in Tactile Feedback Device
North America currently leads the global Tactile Feedback Device market, driven by substantial investments in advanced consumer electronics and a strong propensity for early adoption of new technologies. Within North America, the United States stands out as the dominant country, characterized by a robust ecosystem of technology giants and a highly engaged consumer base.
Application Dominance:
- Mobile Terminal (Smartphone/Tablet): This segment is the largest revenue contributor, projected to account for over 45% of the market by 2033. The relentless pursuit of enhanced user experience, immersive gaming, and intuitive interface design by smartphone manufacturers is the primary driver. Key economic policies supporting innovation in the consumer electronics sector and a high disposable income among consumers further bolster this segment's dominance.
- Wearable Device: This segment is experiencing the fastest growth, with a projected CAGR of 22.5%. The increasing adoption of smartwatches, fitness trackers, and AR/VR headsets, where subtle haptic feedback enhances notifications and user interaction without constant visual attention, is propelling its expansion.
- Automotive: This segment is critical for safety and user experience enhancements in vehicles, including virtual button feedback and driver alerts. Growing demand for advanced driver-assistance systems (ADAS) and in-car entertainment systems is a significant factor. Favorable regulatory frameworks promoting in-car safety technologies are also contributing.
Type Dominance:
- Linear Resonant Actuators (LRAs): LRAs are increasingly becoming the preferred choice due to their superior performance in terms of precision, power efficiency, and bandwidth, offering a more sophisticated range of tactile sensations compared to ERM actuators. Their adoption is prevalent in premium mobile devices and advanced wearables.
- Eccentric Rotating Mass (ERM) Actuators: While older technology, ERM actuators continue to hold a significant share due to their cost-effectiveness and widespread use in entry-level and mid-range devices.
Tactile Feedback Device Product Developments
Recent product developments in the Tactile Feedback Device market are focused on enhancing the fidelity and responsiveness of haptic experiences. Innovations include the integration of advanced piezoelectric actuators offering high-frequency vibrations for nuanced textures and the development of closed-loop control systems for more precise and adaptive feedback. Companies are also prioritizing miniaturization and power efficiency to enable seamless integration into increasingly compact devices like wearables and medical implants. These advancements provide a distinct competitive advantage by enabling richer, more immersive, and intuitive user interactions across a spectrum of applications, from gaming and virtual reality to automotive interfaces and assistive technologies.
Key Drivers of Tactile Feedback Device Growth
The growth of the Tactile Feedback Device market is primarily propelled by several key factors. Firstly, the escalating demand for immersive and interactive user experiences across consumer electronics, particularly in smartphones and gaming, is a significant catalyst. Secondly, technological advancements in actuator technologies, such as piezoelectric and advanced LRAs, are enabling more sophisticated and nuanced haptic feedback. Thirdly, the increasing integration of haptic feedback in automotive systems for enhanced safety and user interface control is a major growth driver. Finally, supportive government initiatives and evolving regulatory frameworks promoting the adoption of advanced user interface technologies, especially in safety-critical applications, further accelerate market expansion.
Challenges in the Tactile Feedback Device Market
Despite its promising growth trajectory, the Tactile Feedback Device market faces several challenges. High development and manufacturing costs associated with advanced haptic technologies can limit their adoption in price-sensitive markets. Furthermore, the need for standardized integration protocols and ongoing research into human perception of touch can create technical hurdles. Supply chain complexities for specialized components, especially in a globalized manufacturing landscape, can also pose a risk. Finally, intense competition among established players and emerging startups necessitates continuous innovation and cost optimization to maintain market share.
Emerging Opportunities in Tactile Feedback Device
The Tactile Feedback Device market is ripe with emerging opportunities, primarily driven by technological breakthroughs and strategic market expansion. The burgeoning field of extended reality (XR) – encompassing virtual reality (VR), augmented reality (AR), and mixed reality (MR) – presents a significant avenue for growth, where realistic tactile feedback is crucial for immersion and interaction. Strategic partnerships between haptic technology developers and leading device manufacturers will be instrumental in co-creating innovative solutions. Furthermore, the expanding applications in healthcare for rehabilitation, prosthetics, and surgical simulations, as well as in industrial settings for remote operation and training, offer substantial long-term growth potential.
Leading Players in the Tactile Feedback Device Sector
- AAC Technologies
- Nidec Corporation
- MPlus Co.LTD
- Jinlong Machinery & Electronics
- Bluecom
- Johnson Electric
- Texas Instruments
- TDK
- Jahwa
- PI Ceramic
- Precision Microdrives
- Novasentis
Key Milestones in Tactile Feedback Device Industry
- 2019, Q3: Introduction of advanced haptic feedback engines in flagship smartphones, significantly enhancing user experience.
- 2020, Q1: Increased adoption of LRAs in wearables for more precise notification feedback.
- 2021, Q2: Development and demonstration of micro-actuator arrays for localized tactile sensing in AR/VR applications.
- 2022, Q4: Growing investment in haptic technology for automotive infotainment systems and advanced driver-assistance systems.
- 2023, Q3: Emergence of novel piezoelectric actuators offering higher bandwidth and lower power consumption.
- 2024, Q1: Strategic partnerships formed to integrate advanced haptics into next-generation gaming consoles and controllers.
Strategic Outlook for Tactile Feedback Device Market
The future of the Tactile Feedback Device market is characterized by robust growth accelerators. Continued innovation in actuator technology, focusing on miniaturization, power efficiency, and enhanced haptic realism, will be paramount. The expanding integration of haptic feedback in emerging technologies like XR, advanced automotive interfaces, and the Internet of Medical Things (IoMT) presents significant untapped potential. Strategic alliances between technology providers and end-product manufacturers will be crucial for driving widespread adoption. A sustained focus on user experience and the development of intuitive tactile interfaces will ensure the continued relevance and expansion of this dynamic market.
Tactile Feedback Device Segmentation
-
1. Application
- 1.1. Mobile Terminal (Smartphone/Tablet)
- 1.2. Wearable Device
- 1.3. Automotive
- 1.4. Household Appliances
- 1.5. Others
-
2. Types
- 2.1. Eccentric Rotating Mass (ERM) Actuators
- 2.2. Linear Resonant Actuators (LRAS)
- 2.3. Others
Tactile Feedback Device Segmentation By Geography
-
1. North America
- 1.1. United States
- 1.2. Canada
- 1.3. Mexico
-
2. South America
- 2.1. Brazil
- 2.2. Argentina
- 2.3. Rest of South America
-
3. Europe
- 3.1. United Kingdom
- 3.2. Germany
- 3.3. France
- 3.4. Italy
- 3.5. Spain
- 3.6. Russia
- 3.7. Benelux
- 3.8. Nordics
- 3.9. Rest of Europe
-
4. Middle East & Africa
- 4.1. Turkey
- 4.2. Israel
- 4.3. GCC
- 4.4. North Africa
- 4.5. South Africa
- 4.6. Rest of Middle East & Africa
-
5. Asia Pacific
- 5.1. China
- 5.2. India
- 5.3. Japan
- 5.4. South Korea
- 5.5. ASEAN
- 5.6. Oceania
- 5.7. Rest of Asia Pacific
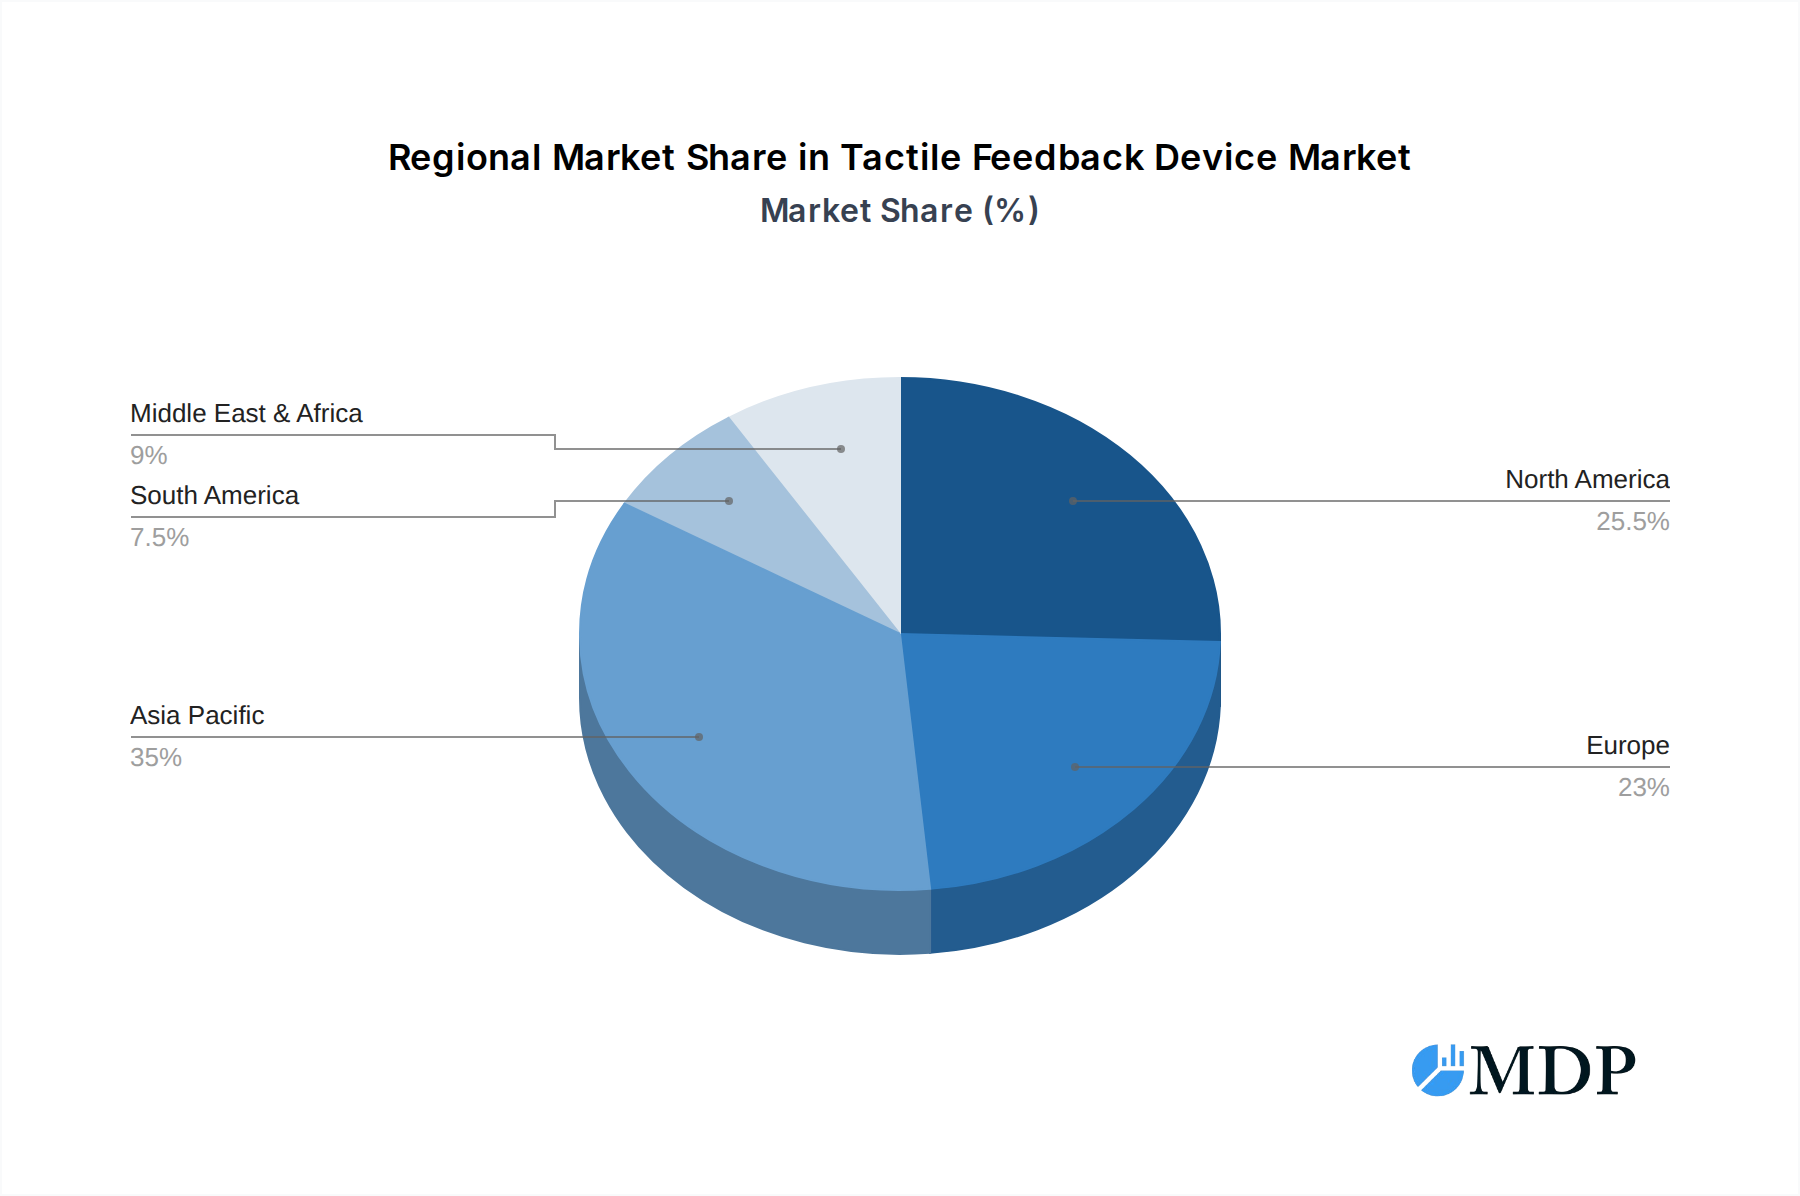
Tactile Feedback Device Regional Market Share
Geographic Coverage of Tactile Feedback Device
Tactile Feedback Device REPORT HIGHLIGHTS
| Aspects | Details |
|---|---|
| Study Period | 2020-2034 |
| Base Year | 2025 |
| Estimated Year | 2026 |
| Forecast Period | 2026-2034 |
| Historical Period | 2020-2025 |
| Growth Rate | CAGR of 10.1% from 2020-2034 |
| Segmentation |
|
Table of Contents
- 1. Introduction
- 1.1. Research Scope
- 1.2. Market Segmentation
- 1.3. Research Methodology
- 1.4. Definitions and Assumptions
- 2. Executive Summary
- 2.1. Introduction
- 3. Market Dynamics
- 3.1. Introduction
- 3.2. Market Drivers
- 3.3. Market Restrains
- 3.4. Market Trends
- 4. Market Factor Analysis
- 4.1. Porters Five Forces
- 4.2. Supply/Value Chain
- 4.3. PESTEL analysis
- 4.4. Market Entropy
- 4.5. Patent/Trademark Analysis
- 5. Global Tactile Feedback Device Analysis, Insights and Forecast, 2020-2032
- 5.1. Market Analysis, Insights and Forecast - by Application
- 5.1.1. Mobile Terminal (Smartphone/Tablet)
- 5.1.2. Wearable Device
- 5.1.3. Automotive
- 5.1.4. Household Appliances
- 5.1.5. Others
- 5.2. Market Analysis, Insights and Forecast - by Types
- 5.2.1. Eccentric Rotating Mass (ERM) Actuators
- 5.2.2. Linear Resonant Actuators (LRAS)
- 5.2.3. Others
- 5.3. Market Analysis, Insights and Forecast - by Region
- 5.3.1. North America
- 5.3.2. South America
- 5.3.3. Europe
- 5.3.4. Middle East & Africa
- 5.3.5. Asia Pacific
- 5.1. Market Analysis, Insights and Forecast - by Application
- 6. North America Tactile Feedback Device Analysis, Insights and Forecast, 2020-2032
- 6.1. Market Analysis, Insights and Forecast - by Application
- 6.1.1. Mobile Terminal (Smartphone/Tablet)
- 6.1.2. Wearable Device
- 6.1.3. Automotive
- 6.1.4. Household Appliances
- 6.1.5. Others
- 6.2. Market Analysis, Insights and Forecast - by Types
- 6.2.1. Eccentric Rotating Mass (ERM) Actuators
- 6.2.2. Linear Resonant Actuators (LRAS)
- 6.2.3. Others
- 6.1. Market Analysis, Insights and Forecast - by Application
- 7. South America Tactile Feedback Device Analysis, Insights and Forecast, 2020-2032
- 7.1. Market Analysis, Insights and Forecast - by Application
- 7.1.1. Mobile Terminal (Smartphone/Tablet)
- 7.1.2. Wearable Device
- 7.1.3. Automotive
- 7.1.4. Household Appliances
- 7.1.5. Others
- 7.2. Market Analysis, Insights and Forecast - by Types
- 7.2.1. Eccentric Rotating Mass (ERM) Actuators
- 7.2.2. Linear Resonant Actuators (LRAS)
- 7.2.3. Others
- 7.1. Market Analysis, Insights and Forecast - by Application
- 8. Europe Tactile Feedback Device Analysis, Insights and Forecast, 2020-2032
- 8.1. Market Analysis, Insights and Forecast - by Application
- 8.1.1. Mobile Terminal (Smartphone/Tablet)
- 8.1.2. Wearable Device
- 8.1.3. Automotive
- 8.1.4. Household Appliances
- 8.1.5. Others
- 8.2. Market Analysis, Insights and Forecast - by Types
- 8.2.1. Eccentric Rotating Mass (ERM) Actuators
- 8.2.2. Linear Resonant Actuators (LRAS)
- 8.2.3. Others
- 8.1. Market Analysis, Insights and Forecast - by Application
- 9. Middle East & Africa Tactile Feedback Device Analysis, Insights and Forecast, 2020-2032
- 9.1. Market Analysis, Insights and Forecast - by Application
- 9.1.1. Mobile Terminal (Smartphone/Tablet)
- 9.1.2. Wearable Device
- 9.1.3. Automotive
- 9.1.4. Household Appliances
- 9.1.5. Others
- 9.2. Market Analysis, Insights and Forecast - by Types
- 9.2.1. Eccentric Rotating Mass (ERM) Actuators
- 9.2.2. Linear Resonant Actuators (LRAS)
- 9.2.3. Others
- 9.1. Market Analysis, Insights and Forecast - by Application
- 10. Asia Pacific Tactile Feedback Device Analysis, Insights and Forecast, 2020-2032
- 10.1. Market Analysis, Insights and Forecast - by Application
- 10.1.1. Mobile Terminal (Smartphone/Tablet)
- 10.1.2. Wearable Device
- 10.1.3. Automotive
- 10.1.4. Household Appliances
- 10.1.5. Others
- 10.2. Market Analysis, Insights and Forecast - by Types
- 10.2.1. Eccentric Rotating Mass (ERM) Actuators
- 10.2.2. Linear Resonant Actuators (LRAS)
- 10.2.3. Others
- 10.1. Market Analysis, Insights and Forecast - by Application
- 11. Competitive Analysis
- 11.1. Global Market Share Analysis 2025
- 11.2. Company Profiles
- 11.2.1 AAC Technologies
- 11.2.1.1. Overview
- 11.2.1.2. Products
- 11.2.1.3. SWOT Analysis
- 11.2.1.4. Recent Developments
- 11.2.1.5. Financials (Based on Availability)
- 11.2.2 Nidec Corporation
- 11.2.2.1. Overview
- 11.2.2.2. Products
- 11.2.2.3. SWOT Analysis
- 11.2.2.4. Recent Developments
- 11.2.2.5. Financials (Based on Availability)
- 11.2.3 MPlus Co.LTD
- 11.2.3.1. Overview
- 11.2.3.2. Products
- 11.2.3.3. SWOT Analysis
- 11.2.3.4. Recent Developments
- 11.2.3.5. Financials (Based on Availability)
- 11.2.4 Jinlong Machinery & Electronics
- 11.2.4.1. Overview
- 11.2.4.2. Products
- 11.2.4.3. SWOT Analysis
- 11.2.4.4. Recent Developments
- 11.2.4.5. Financials (Based on Availability)
- 11.2.5 Bluecom
- 11.2.5.1. Overview
- 11.2.5.2. Products
- 11.2.5.3. SWOT Analysis
- 11.2.5.4. Recent Developments
- 11.2.5.5. Financials (Based on Availability)
- 11.2.6 Johnson Electric
- 11.2.6.1. Overview
- 11.2.6.2. Products
- 11.2.6.3. SWOT Analysis
- 11.2.6.4. Recent Developments
- 11.2.6.5. Financials (Based on Availability)
- 11.2.7 Texas Instruments
- 11.2.7.1. Overview
- 11.2.7.2. Products
- 11.2.7.3. SWOT Analysis
- 11.2.7.4. Recent Developments
- 11.2.7.5. Financials (Based on Availability)
- 11.2.8 TDK
- 11.2.8.1. Overview
- 11.2.8.2. Products
- 11.2.8.3. SWOT Analysis
- 11.2.8.4. Recent Developments
- 11.2.8.5. Financials (Based on Availability)
- 11.2.9 Jahwa
- 11.2.9.1. Overview
- 11.2.9.2. Products
- 11.2.9.3. SWOT Analysis
- 11.2.9.4. Recent Developments
- 11.2.9.5. Financials (Based on Availability)
- 11.2.10 PI Ceramic
- 11.2.10.1. Overview
- 11.2.10.2. Products
- 11.2.10.3. SWOT Analysis
- 11.2.10.4. Recent Developments
- 11.2.10.5. Financials (Based on Availability)
- 11.2.11 Precision Microdrives
- 11.2.11.1. Overview
- 11.2.11.2. Products
- 11.2.11.3. SWOT Analysis
- 11.2.11.4. Recent Developments
- 11.2.11.5. Financials (Based on Availability)
- 11.2.12 Novasentis
- 11.2.12.1. Overview
- 11.2.12.2. Products
- 11.2.12.3. SWOT Analysis
- 11.2.12.4. Recent Developments
- 11.2.12.5. Financials (Based on Availability)
- 11.2.1 AAC Technologies
List of Figures
- Figure 1: Global Tactile Feedback Device Revenue Breakdown (billion, %) by Region 2025 & 2033
- Figure 2: North America Tactile Feedback Device Revenue (billion), by Application 2025 & 2033
- Figure 3: North America Tactile Feedback Device Revenue Share (%), by Application 2025 & 2033
- Figure 4: North America Tactile Feedback Device Revenue (billion), by Types 2025 & 2033
- Figure 5: North America Tactile Feedback Device Revenue Share (%), by Types 2025 & 2033
- Figure 6: North America Tactile Feedback Device Revenue (billion), by Country 2025 & 2033
- Figure 7: North America Tactile Feedback Device Revenue Share (%), by Country 2025 & 2033
- Figure 8: South America Tactile Feedback Device Revenue (billion), by Application 2025 & 2033
- Figure 9: South America Tactile Feedback Device Revenue Share (%), by Application 2025 & 2033
- Figure 10: South America Tactile Feedback Device Revenue (billion), by Types 2025 & 2033
- Figure 11: South America Tactile Feedback Device Revenue Share (%), by Types 2025 & 2033
- Figure 12: South America Tactile Feedback Device Revenue (billion), by Country 2025 & 2033
- Figure 13: South America Tactile Feedback Device Revenue Share (%), by Country 2025 & 2033
- Figure 14: Europe Tactile Feedback Device Revenue (billion), by Application 2025 & 2033
- Figure 15: Europe Tactile Feedback Device Revenue Share (%), by Application 2025 & 2033
- Figure 16: Europe Tactile Feedback Device Revenue (billion), by Types 2025 & 2033
- Figure 17: Europe Tactile Feedback Device Revenue Share (%), by Types 2025 & 2033
- Figure 18: Europe Tactile Feedback Device Revenue (billion), by Country 2025 & 2033
- Figure 19: Europe Tactile Feedback Device Revenue Share (%), by Country 2025 & 2033
- Figure 20: Middle East & Africa Tactile Feedback Device Revenue (billion), by Application 2025 & 2033
- Figure 21: Middle East & Africa Tactile Feedback Device Revenue Share (%), by Application 2025 & 2033
- Figure 22: Middle East & Africa Tactile Feedback Device Revenue (billion), by Types 2025 & 2033
- Figure 23: Middle East & Africa Tactile Feedback Device Revenue Share (%), by Types 2025 & 2033
- Figure 24: Middle East & Africa Tactile Feedback Device Revenue (billion), by Country 2025 & 2033
- Figure 25: Middle East & Africa Tactile Feedback Device Revenue Share (%), by Country 2025 & 2033
- Figure 26: Asia Pacific Tactile Feedback Device Revenue (billion), by Application 2025 & 2033
- Figure 27: Asia Pacific Tactile Feedback Device Revenue Share (%), by Application 2025 & 2033
- Figure 28: Asia Pacific Tactile Feedback Device Revenue (billion), by Types 2025 & 2033
- Figure 29: Asia Pacific Tactile Feedback Device Revenue Share (%), by Types 2025 & 2033
- Figure 30: Asia Pacific Tactile Feedback Device Revenue (billion), by Country 2025 & 2033
- Figure 31: Asia Pacific Tactile Feedback Device Revenue Share (%), by Country 2025 & 2033
List of Tables
- Table 1: Global Tactile Feedback Device Revenue billion Forecast, by Application 2020 & 2033
- Table 2: Global Tactile Feedback Device Revenue billion Forecast, by Types 2020 & 2033
- Table 3: Global Tactile Feedback Device Revenue billion Forecast, by Region 2020 & 2033
- Table 4: Global Tactile Feedback Device Revenue billion Forecast, by Application 2020 & 2033
- Table 5: Global Tactile Feedback Device Revenue billion Forecast, by Types 2020 & 2033
- Table 6: Global Tactile Feedback Device Revenue billion Forecast, by Country 2020 & 2033
- Table 7: United States Tactile Feedback Device Revenue (billion) Forecast, by Application 2020 & 2033
- Table 8: Canada Tactile Feedback Device Revenue (billion) Forecast, by Application 2020 & 2033
- Table 9: Mexico Tactile Feedback Device Revenue (billion) Forecast, by Application 2020 & 2033
- Table 10: Global Tactile Feedback Device Revenue billion Forecast, by Application 2020 & 2033
- Table 11: Global Tactile Feedback Device Revenue billion Forecast, by Types 2020 & 2033
- Table 12: Global Tactile Feedback Device Revenue billion Forecast, by Country 2020 & 2033
- Table 13: Brazil Tactile Feedback Device Revenue (billion) Forecast, by Application 2020 & 2033
- Table 14: Argentina Tactile Feedback Device Revenue (billion) Forecast, by Application 2020 & 2033
- Table 15: Rest of South America Tactile Feedback Device Revenue (billion) Forecast, by Application 2020 & 2033
- Table 16: Global Tactile Feedback Device Revenue billion Forecast, by Application 2020 & 2033
- Table 17: Global Tactile Feedback Device Revenue billion Forecast, by Types 2020 & 2033
- Table 18: Global Tactile Feedback Device Revenue billion Forecast, by Country 2020 & 2033
- Table 19: United Kingdom Tactile Feedback Device Revenue (billion) Forecast, by Application 2020 & 2033
- Table 20: Germany Tactile Feedback Device Revenue (billion) Forecast, by Application 2020 & 2033
- Table 21: France Tactile Feedback Device Revenue (billion) Forecast, by Application 2020 & 2033
- Table 22: Italy Tactile Feedback Device Revenue (billion) Forecast, by Application 2020 & 2033
- Table 23: Spain Tactile Feedback Device Revenue (billion) Forecast, by Application 2020 & 2033
- Table 24: Russia Tactile Feedback Device Revenue (billion) Forecast, by Application 2020 & 2033
- Table 25: Benelux Tactile Feedback Device Revenue (billion) Forecast, by Application 2020 & 2033
- Table 26: Nordics Tactile Feedback Device Revenue (billion) Forecast, by Application 2020 & 2033
- Table 27: Rest of Europe Tactile Feedback Device Revenue (billion) Forecast, by Application 2020 & 2033
- Table 28: Global Tactile Feedback Device Revenue billion Forecast, by Application 2020 & 2033
- Table 29: Global Tactile Feedback Device Revenue billion Forecast, by Types 2020 & 2033
- Table 30: Global Tactile Feedback Device Revenue billion Forecast, by Country 2020 & 2033
- Table 31: Turkey Tactile Feedback Device Revenue (billion) Forecast, by Application 2020 & 2033
- Table 32: Israel Tactile Feedback Device Revenue (billion) Forecast, by Application 2020 & 2033
- Table 33: GCC Tactile Feedback Device Revenue (billion) Forecast, by Application 2020 & 2033
- Table 34: North Africa Tactile Feedback Device Revenue (billion) Forecast, by Application 2020 & 2033
- Table 35: South Africa Tactile Feedback Device Revenue (billion) Forecast, by Application 2020 & 2033
- Table 36: Rest of Middle East & Africa Tactile Feedback Device Revenue (billion) Forecast, by Application 2020 & 2033
- Table 37: Global Tactile Feedback Device Revenue billion Forecast, by Application 2020 & 2033
- Table 38: Global Tactile Feedback Device Revenue billion Forecast, by Types 2020 & 2033
- Table 39: Global Tactile Feedback Device Revenue billion Forecast, by Country 2020 & 2033
- Table 40: China Tactile Feedback Device Revenue (billion) Forecast, by Application 2020 & 2033
- Table 41: India Tactile Feedback Device Revenue (billion) Forecast, by Application 2020 & 2033
- Table 42: Japan Tactile Feedback Device Revenue (billion) Forecast, by Application 2020 & 2033
- Table 43: South Korea Tactile Feedback Device Revenue (billion) Forecast, by Application 2020 & 2033
- Table 44: ASEAN Tactile Feedback Device Revenue (billion) Forecast, by Application 2020 & 2033
- Table 45: Oceania Tactile Feedback Device Revenue (billion) Forecast, by Application 2020 & 2033
- Table 46: Rest of Asia Pacific Tactile Feedback Device Revenue (billion) Forecast, by Application 2020 & 2033
Frequently Asked Questions
1. What is the projected Compound Annual Growth Rate (CAGR) of the Tactile Feedback Device?
The projected CAGR is approximately 10.1%.
2. Which companies are prominent players in the Tactile Feedback Device?
Key companies in the market include AAC Technologies, Nidec Corporation, MPlus Co.LTD, Jinlong Machinery & Electronics, Bluecom, Johnson Electric, Texas Instruments, TDK, Jahwa, PI Ceramic, Precision Microdrives, Novasentis.
3. What are the main segments of the Tactile Feedback Device?
The market segments include Application, Types.
4. Can you provide details about the market size?
The market size is estimated to be USD 12.44 billion as of 2022.
5. What are some drivers contributing to market growth?
N/A
6. What are the notable trends driving market growth?
N/A
7. Are there any restraints impacting market growth?
N/A
8. Can you provide examples of recent developments in the market?
N/A
9. What pricing options are available for accessing the report?
Pricing options include single-user, multi-user, and enterprise licenses priced at USD 2900.00, USD 4350.00, and USD 5800.00 respectively.
10. Is the market size provided in terms of value or volume?
The market size is provided in terms of value, measured in billion.
11. Are there any specific market keywords associated with the report?
Yes, the market keyword associated with the report is "Tactile Feedback Device," which aids in identifying and referencing the specific market segment covered.
12. How do I determine which pricing option suits my needs best?
The pricing options vary based on user requirements and access needs. Individual users may opt for single-user licenses, while businesses requiring broader access may choose multi-user or enterprise licenses for cost-effective access to the report.
13. Are there any additional resources or data provided in the Tactile Feedback Device report?
While the report offers comprehensive insights, it's advisable to review the specific contents or supplementary materials provided to ascertain if additional resources or data are available.
14. How can I stay updated on further developments or reports in the Tactile Feedback Device?
To stay informed about further developments, trends, and reports in the Tactile Feedback Device, consider subscribing to industry newsletters, following relevant companies and organizations, or regularly checking reputable industry news sources and publications.
Methodology
Step 1 - Identification of Relevant Samples Size from Population Database


Step 2 - Approaches for Defining Global Market Size (Value, Volume* & Price*)

Note*: In applicable scenarios
Step 3 - Data Sources
Primary Research
- Web Analytics
- Survey Reports
- Research Institute
- Latest Research Reports
- Opinion Leaders
Secondary Research
- Annual Reports
- White Paper
- Latest Press Release
- Industry Association
- Paid Database
- Investor Presentations

Step 4 - Data Triangulation
Involves using different sources of information in order to increase the validity of a study
These sources are likely to be stakeholders in a program - participants, other researchers, program staff, other community members, and so on.
Then we put all data in single framework & apply various statistical tools to find out the dynamic on the market.
During the analysis stage, feedback from the stakeholder groups would be compared to determine areas of agreement as well as areas of divergence