

Key Insights
The global Surgical Assist Systems market is projected for substantial growth, anticipated to reach $9.18 billion by 2025. This expansion is driven by a Compound Annual Growth Rate (CAGR) of 8.58% from 2025 to 2033. Key growth catalysts include the rising adoption of advanced surgical technologies for enhanced precision, minimally invasive procedures, and improved patient outcomes. Expanding healthcare infrastructure, particularly in emerging markets, and the increasing prevalence of chronic diseases requiring surgical intervention are also significant drivers. Continuous innovation in robotics, imaging, and AI integration further fuels market opportunities. The market is segmented by end-user, with hospitals dominating due to their extensive surgical capabilities and patient volume. Motorized surgical assist systems are expected to lead within product types, owing to their superior control, ergonomic benefits, and suitability for complex procedures.
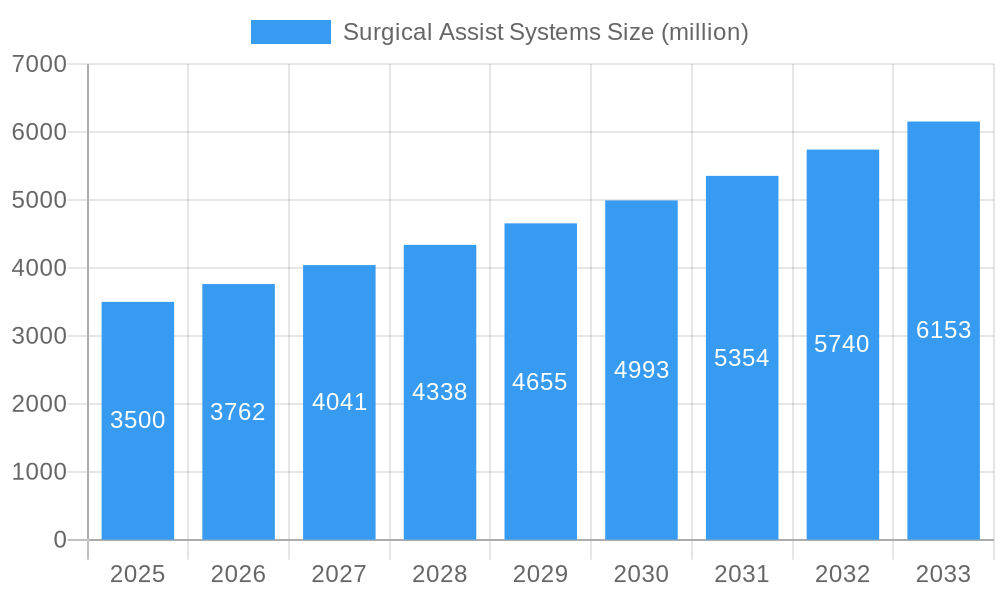
Surgical Assist Systems Market Size (In Billion)
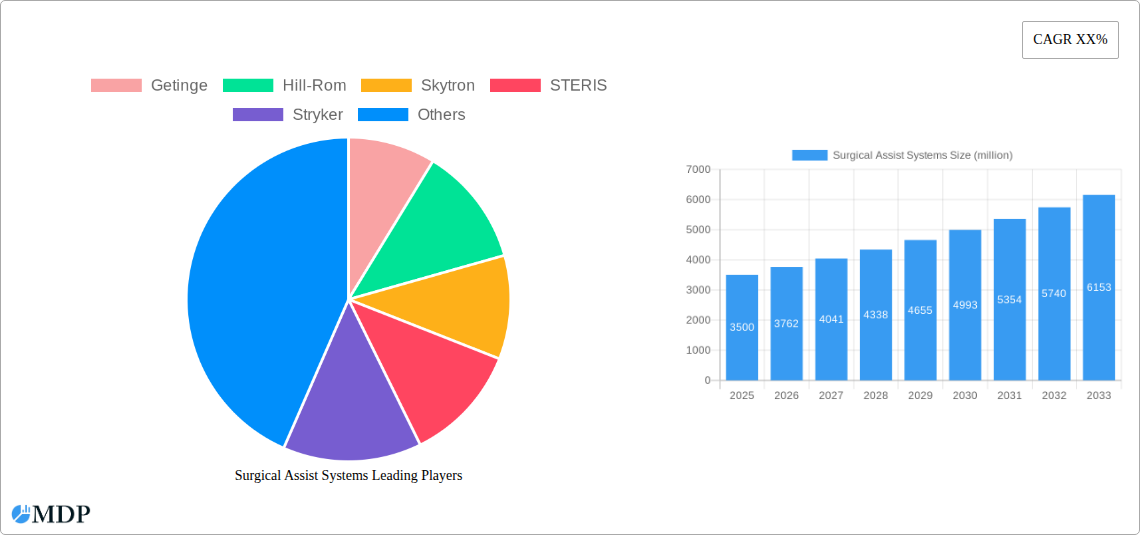
Market challenges include the high initial investment for advanced systems and the necessity for specialized training, which can impede adoption in smaller healthcare settings. Lengthy regulatory approval processes for new technologies also impact product development timelines. Nevertheless, a focus on value-based healthcare, patient safety, and the development of cost-effective solutions by manufacturers are expected to alleviate these concerns. Leading companies such as Getinge, Hill-Rom, STERIS, and Stryker are actively pursuing R&D to launch innovative products and broaden their global presence, with a particular emphasis on the Asia Pacific region, a high-growth market driven by its large population and increasing healthcare spending.
Surgical Assist Systems Company Market Share
Surgical Assist Systems Market Dynamics & Concentration
The global Surgical Assist Systems market is characterized by a moderate to high concentration, with a few prominent players like Getinge, STERIS, and Stryker holding significant market share, estimated at over 30% combined. Innovation remains a primary driver, fueled by advancements in robotics, artificial intelligence, and minimally invasive surgical techniques. These innovations are pushing the boundaries of surgical precision and patient outcomes, leading to increased adoption of sophisticated surgical assist systems. Regulatory frameworks, though stringent, are evolving to accommodate new technologies, with bodies like the FDA and EMA playing a crucial role in ensuring product safety and efficacy. Product substitutes, while present in the form of traditional surgical tools, are increasingly being outpaced by the enhanced capabilities and efficiency offered by advanced surgical assist systems. End-user trends are strongly influenced by the growing demand for minimally invasive procedures, shorter recovery times, and improved patient safety. Hospitals and clinics are investing heavily in these systems to enhance their surgical capabilities and attract both patients and skilled surgeons. Merger and acquisition (M&A) activities, although not at an extremely high volume, have been strategic, with an estimated xx M&A deal counts within the historical period (2019–2024), aimed at consolidating market share, acquiring innovative technologies, or expanding geographical reach. For instance, strategic acquisitions in this sector have helped companies like Hill-Rom and Skytron bolster their portfolios and competitive positioning.
- Market Concentration: Moderate to High
- Innovation Drivers: Robotics, AI, Minimally Invasive Surgery
- Regulatory Bodies: FDA, EMA
- End-User Trends: Minimally Invasive Procedures, Faster Recovery, Patient Safety
- M&A Deal Counts (2019-2024): xx
Surgical Assist Systems Industry Trends & Analysis
The Surgical Assist Systems industry is poised for robust growth, driven by a confluence of technological advancements, increasing healthcare expenditure, and the burgeoning demand for advanced surgical solutions. The Compound Annual Growth Rate (CAGR) for the forecast period (2025–2033) is projected to be approximately 8.5%, indicating a significant expansion trajectory. This growth is propelled by technological disruptions such as the integration of Artificial Intelligence (AI) and machine learning into surgical platforms, enabling enhanced precision, real-time feedback, and predictive analytics during procedures. Robotic-assisted surgery, a key segment within surgical assist systems, continues its upward march, driven by its ability to facilitate complex surgeries with greater dexterity and control, leading to improved patient outcomes and reduced complications. The market penetration of these advanced systems is steadily increasing, particularly in developed economies, as healthcare providers recognize their long-term value in terms of reduced hospital stays and improved patient satisfaction.
Consumer preferences are increasingly tilting towards minimally invasive surgical approaches, a trend that directly benefits the surgical assist systems market. Patients are actively seeking procedures that offer shorter recovery periods, less pain, and minimal scarring, all of which are hallmarks of surgeries performed with the aid of advanced technology. This shift in patient demand is compelling hospitals and surgical centers to invest in and upgrade their existing infrastructure to accommodate these evolving surgical techniques. Furthermore, the increasing prevalence of chronic diseases and age-related conditions globally necessitates more complex and precise surgical interventions, further fueling the demand for sophisticated surgical assist systems. The competitive landscape is dynamic, with established players constantly innovating and new entrants vying for market share with specialized offerings. Strategic collaborations and partnerships between technology providers and healthcare institutions are also becoming more prevalent, accelerating the adoption and development of cutting-edge surgical assist technologies. The global market size for surgical assist systems is projected to reach an estimated xx million by the end of the forecast period.
- Projected CAGR (2025-2033): 8.5%
- Market Penetration: Steadily Increasing, especially in developed economies.
- Key Technological Drivers: AI Integration, Machine Learning, Robotics
- Patient Preferences: Minimally Invasive Procedures, Shorter Recovery, Reduced Pain
- Global Market Size (2033 Estimate): xx million
Leading Markets & Segments in Surgical Assist Systems
The global Surgical Assist Systems market exhibits strong regional dominance, with North America currently leading the pack, driven by its advanced healthcare infrastructure, high patient affordability, and early adoption of cutting-edge medical technologies. Within North America, the United States accounts for a substantial portion of the market share, estimated at over 45%, due to significant investments in healthcare research and development, a high density of specialized surgical centers, and favorable reimbursement policies for advanced surgical procedures. The economic policies in this region, emphasizing technological innovation and patient-centric care, further bolster the demand for sophisticated surgical assist systems.
The Hospital segment overwhelmingly dominates the application landscape, accounting for approximately 85% of the market share. This is attributed to the concentration of complex surgical procedures, availability of specialized surgical teams, and the financial capacity of large hospital networks to invest in high-value medical equipment. Clinics, while growing in importance, especially for outpatient and minor procedures, represent a smaller but expanding segment.
In terms of product types, Motorized surgical assist systems command the larger market share, estimated at around 70%. This dominance is a direct consequence of their superior precision, control, and ergonomic benefits, which are critical for intricate surgical tasks. Technologies such as robotic surgical systems, motorized surgical tables, and advanced navigation systems fall under this category, offering enhanced performance and reduced surgeon fatigue. Non-motorized systems, while still relevant for certain applications, are gradually losing ground to their technologically advanced counterparts. The robust healthcare spending in countries like Germany, the United Kingdom, and France, coupled with government initiatives to modernize surgical facilities, also positions Europe as a significant and growing market for surgical assist systems. Asia-Pacific, with its rapidly expanding economies and increasing focus on healthcare, presents a substantial long-term growth opportunity, particularly in countries like China and India, where the adoption of advanced medical technologies is accelerating.
- Dominant Region: North America (over 45% market share in the US)
- Leading Application Segment: Hospitals (approx. 85% market share)
- Dominant Product Type: Motorized Surgical Assist Systems (approx. 70% market share)
- Key Drivers for Dominance (North America):
- Advanced healthcare infrastructure
- High patient affordability
- Early adoption of new technologies
- Favorable reimbursement policies
- Significant R&D investments
- Emerging Regional Markets: Europe, Asia-Pacific
Surgical Assist Systems Product Developments
Recent product developments in Surgical Assist Systems are centered on enhancing surgeon capabilities, improving patient outcomes, and streamlining operating room workflows. Innovations include AI-powered surgical robots offering real-time data analysis and predictive guidance, advanced robotic arms with increased dexterity for minimally invasive procedures, and intelligent surgical tables with integrated imaging capabilities for better visualization. These advancements are not only increasing the precision and safety of complex surgeries but also contributing to shorter patient recovery times and reduced surgeon fatigue. Companies are also focusing on developing user-friendly interfaces and modular designs that can be adapted to various surgical specialties, thereby expanding the market fit and competitive advantage of their offerings.
Key Drivers of Surgical Assist Systems Growth
The growth of the Surgical Assist Systems market is primarily fueled by several interconnected factors. Technological advancements, particularly in robotics, AI, and sensor technology, are continuously enhancing the precision, efficiency, and safety of surgical procedures. The increasing demand for minimally invasive surgeries, driven by patient preference for faster recovery and reduced scarring, directly boosts the adoption of these advanced systems. Furthermore, the rising global burden of chronic diseases and an aging population necessitate more complex and sophisticated surgical interventions. Economic factors, such as increasing healthcare expenditure by governments and private payers, alongside growing disposable incomes in emerging economies, also contribute significantly to market expansion. Regulatory bodies' increasing focus on patient safety and improved surgical outcomes indirectly encourages the adoption of advanced assist systems that meet these stringent requirements.
- Technological Advancements: Robotics, AI, miniaturization
- Patient Demand: Minimally invasive procedures, faster recovery
- Demographic Shifts: Aging population, rise in chronic diseases
- Economic Factors: Growing healthcare spending, increased affordability
- Regulatory Push: Emphasis on patient safety and improved outcomes
Challenges in the Surgical Assist Systems Market
Despite the promising growth trajectory, the Surgical Assist Systems market faces several significant challenges. The high initial cost of advanced robotic systems and motorized equipment presents a substantial financial barrier for many healthcare providers, particularly in resource-constrained settings, potentially limiting market penetration. Stringent regulatory approval processes for novel surgical technologies can lead to extended development timelines and increased costs, slowing down the introduction of innovative products. Furthermore, the need for specialized training and skilled personnel to operate and maintain these sophisticated systems can be a bottleneck, requiring significant investment in human capital development. Supply chain disruptions, as witnessed in recent global events, can impact the availability of critical components and finished products. Finally, the presence of established, albeit less advanced, surgical tools and techniques creates a competitive pressure, requiring continuous innovation and demonstration of superior value proposition by surgical assist system manufacturers.
- High Initial Investment Costs: Restricts adoption by smaller facilities.
- Stringent Regulatory Hurdles: Prolonged approval times and increased R&D expenses.
- Skilled Workforce Requirements: Need for specialized training and expertise.
- Supply Chain Volatility: Risk of component shortages and delivery delays.
- Competitive Landscape: Pressure from traditional surgical tools and existing technologies.
Emerging Opportunities in Surgical Assist Systems
Emerging opportunities in the Surgical Assist Systems market lie in the continued integration of artificial intelligence and machine learning for enhanced surgical planning and real-time decision support. The expansion of minimally invasive techniques into new surgical specialties, such as neurosurgery and reconstructive surgery, presents significant growth avenues. Furthermore, the development of smaller, more affordable, and user-friendly robotic systems tailored for outpatient clinics and underserved regions can unlock substantial market potential. Strategic partnerships between medical device manufacturers, AI developers, and healthcare providers will be crucial in co-creating innovative solutions. The growing emphasis on remote surgery and telesurgery, facilitated by advancements in connectivity and robotics, also represents a transformative opportunity for the sector.
Leading Players in the Surgical Assist Systems Sector
- Getinge
- Hill-Rom
- Skytron
- STERIS
- Stryker
- Mizuho
- Alvo
- UFSK-OSYS
- Medifa-hesse
- Eschmann Equipment
- AGA Sanitatsartikel
- Lojer
- Schmitz
- Schaerer Medical
- Brumaba
- Bender
- Merivaara
- Infinium Medical
- Image Diagnostics
- Mindray Medical
- PAX Medical
Key Milestones in Surgical Assist Systems Industry
- 2019: Launch of advanced robotic surgical platforms with enhanced AI capabilities by leading manufacturers.
- 2020: Increased adoption of remote-controlled surgical assist systems due to global health crisis.
- 2021: Introduction of next-generation motorized surgical tables with integrated imaging and patient monitoring.
- 2022: Major regulatory approvals for novel AI-driven surgical navigation systems.
- 2023: Strategic acquisitions of specialized robotic technology companies by larger market players.
- 2024 (Q1-Q4): Significant advancements in haptic feedback technology for robotic surgery, improving surgeon tactile sensation.
Strategic Outlook for Surgical Assist Systems Market
The strategic outlook for the Surgical Assist Systems market remains exceptionally positive, driven by relentless innovation and evolving healthcare demands. Future growth will be accelerated by the widespread integration of AI and data analytics, leading to increasingly autonomous and intelligent surgical systems. The expansion of robotic assistance into a broader range of surgical procedures, including outpatient settings, will be a key growth accelerator. Strategic investments in research and development, focusing on miniaturization, enhanced connectivity, and improved user interfaces, will be critical for competitive advantage. Furthermore, companies that can effectively address cost barriers and develop solutions for emerging markets will capture significant long-term growth opportunities, solidifying their position in this rapidly advancing sector.
Surgical Assist Systems Segmentation
-
1. Application
- 1.1. Hospital
- 1.2. Clinic
-
2. Types
- 2.1. Motorized
- 2.2. Non-motorized
Surgical Assist Systems Segmentation By Geography
-
1. North America
- 1.1. United States
- 1.2. Canada
- 1.3. Mexico
-
2. South America
- 2.1. Brazil
- 2.2. Argentina
- 2.3. Rest of South America
-
3. Europe
- 3.1. United Kingdom
- 3.2. Germany
- 3.3. France
- 3.4. Italy
- 3.5. Spain
- 3.6. Russia
- 3.7. Benelux
- 3.8. Nordics
- 3.9. Rest of Europe
-
4. Middle East & Africa
- 4.1. Turkey
- 4.2. Israel
- 4.3. GCC
- 4.4. North Africa
- 4.5. South Africa
- 4.6. Rest of Middle East & Africa
-
5. Asia Pacific
- 5.1. China
- 5.2. India
- 5.3. Japan
- 5.4. South Korea
- 5.5. ASEAN
- 5.6. Oceania
- 5.7. Rest of Asia Pacific
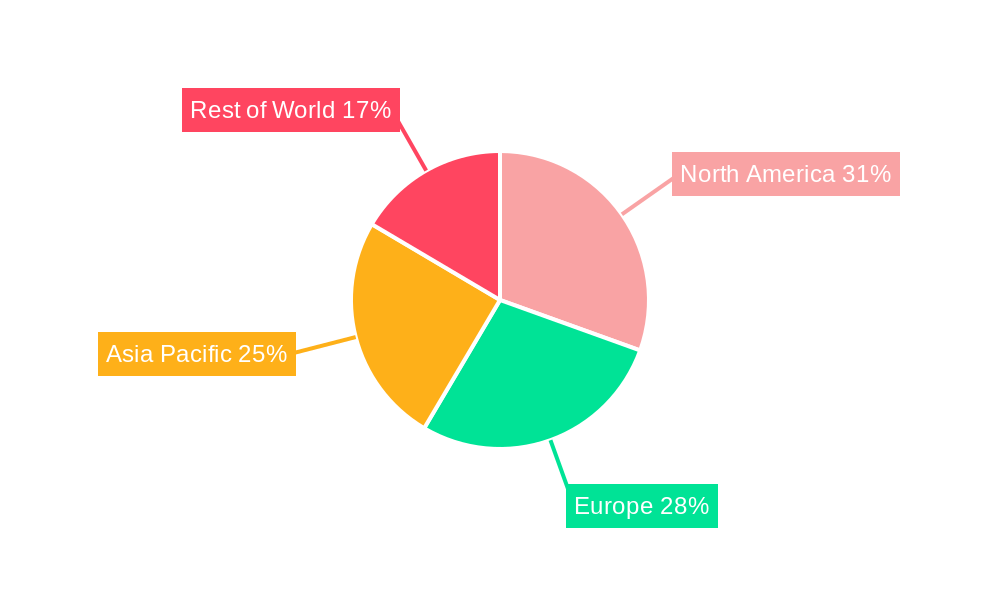
Surgical Assist Systems Regional Market Share
Geographic Coverage of Surgical Assist Systems
Surgical Assist Systems REPORT HIGHLIGHTS
| Aspects | Details |
|---|---|
| Study Period | 2020-2034 |
| Base Year | 2025 |
| Estimated Year | 2026 |
| Forecast Period | 2026-2034 |
| Historical Period | 2020-2025 |
| Growth Rate | CAGR of 8.58% from 2020-2034 |
| Segmentation |
|
Table of Contents
- 1. Introduction
- 1.1. Research Scope
- 1.2. Market Segmentation
- 1.3. Research Methodology
- 1.4. Definitions and Assumptions
- 2. Executive Summary
- 2.1. Introduction
- 3. Market Dynamics
- 3.1. Introduction
- 3.2. Market Drivers
- 3.3. Market Restrains
- 3.4. Market Trends
- 4. Market Factor Analysis
- 4.1. Porters Five Forces
- 4.2. Supply/Value Chain
- 4.3. PESTEL analysis
- 4.4. Market Entropy
- 4.5. Patent/Trademark Analysis
- 5. Global Surgical Assist Systems Analysis, Insights and Forecast, 2020-2032
- 5.1. Market Analysis, Insights and Forecast - by Application
- 5.1.1. Hospital
- 5.1.2. Clinic
- 5.2. Market Analysis, Insights and Forecast - by Types
- 5.2.1. Motorized
- 5.2.2. Non-motorized
- 5.3. Market Analysis, Insights and Forecast - by Region
- 5.3.1. North America
- 5.3.2. South America
- 5.3.3. Europe
- 5.3.4. Middle East & Africa
- 5.3.5. Asia Pacific
- 5.1. Market Analysis, Insights and Forecast - by Application
- 6. North America Surgical Assist Systems Analysis, Insights and Forecast, 2020-2032
- 6.1. Market Analysis, Insights and Forecast - by Application
- 6.1.1. Hospital
- 6.1.2. Clinic
- 6.2. Market Analysis, Insights and Forecast - by Types
- 6.2.1. Motorized
- 6.2.2. Non-motorized
- 6.1. Market Analysis, Insights and Forecast - by Application
- 7. South America Surgical Assist Systems Analysis, Insights and Forecast, 2020-2032
- 7.1. Market Analysis, Insights and Forecast - by Application
- 7.1.1. Hospital
- 7.1.2. Clinic
- 7.2. Market Analysis, Insights and Forecast - by Types
- 7.2.1. Motorized
- 7.2.2. Non-motorized
- 7.1. Market Analysis, Insights and Forecast - by Application
- 8. Europe Surgical Assist Systems Analysis, Insights and Forecast, 2020-2032
- 8.1. Market Analysis, Insights and Forecast - by Application
- 8.1.1. Hospital
- 8.1.2. Clinic
- 8.2. Market Analysis, Insights and Forecast - by Types
- 8.2.1. Motorized
- 8.2.2. Non-motorized
- 8.1. Market Analysis, Insights and Forecast - by Application
- 9. Middle East & Africa Surgical Assist Systems Analysis, Insights and Forecast, 2020-2032
- 9.1. Market Analysis, Insights and Forecast - by Application
- 9.1.1. Hospital
- 9.1.2. Clinic
- 9.2. Market Analysis, Insights and Forecast - by Types
- 9.2.1. Motorized
- 9.2.2. Non-motorized
- 9.1. Market Analysis, Insights and Forecast - by Application
- 10. Asia Pacific Surgical Assist Systems Analysis, Insights and Forecast, 2020-2032
- 10.1. Market Analysis, Insights and Forecast - by Application
- 10.1.1. Hospital
- 10.1.2. Clinic
- 10.2. Market Analysis, Insights and Forecast - by Types
- 10.2.1. Motorized
- 10.2.2. Non-motorized
- 10.1. Market Analysis, Insights and Forecast - by Application
- 11. Competitive Analysis
- 11.1. Global Market Share Analysis 2025
- 11.2. Company Profiles
- 11.2.1 Getinge
- 11.2.1.1. Overview
- 11.2.1.2. Products
- 11.2.1.3. SWOT Analysis
- 11.2.1.4. Recent Developments
- 11.2.1.5. Financials (Based on Availability)
- 11.2.2 Hill-Rom
- 11.2.2.1. Overview
- 11.2.2.2. Products
- 11.2.2.3. SWOT Analysis
- 11.2.2.4. Recent Developments
- 11.2.2.5. Financials (Based on Availability)
- 11.2.3 Skytron
- 11.2.3.1. Overview
- 11.2.3.2. Products
- 11.2.3.3. SWOT Analysis
- 11.2.3.4. Recent Developments
- 11.2.3.5. Financials (Based on Availability)
- 11.2.4 STERIS
- 11.2.4.1. Overview
- 11.2.4.2. Products
- 11.2.4.3. SWOT Analysis
- 11.2.4.4. Recent Developments
- 11.2.4.5. Financials (Based on Availability)
- 11.2.5 Stryker
- 11.2.5.1. Overview
- 11.2.5.2. Products
- 11.2.5.3. SWOT Analysis
- 11.2.5.4. Recent Developments
- 11.2.5.5. Financials (Based on Availability)
- 11.2.6 Mizuho
- 11.2.6.1. Overview
- 11.2.6.2. Products
- 11.2.6.3. SWOT Analysis
- 11.2.6.4. Recent Developments
- 11.2.6.5. Financials (Based on Availability)
- 11.2.7 Alvo
- 11.2.7.1. Overview
- 11.2.7.2. Products
- 11.2.7.3. SWOT Analysis
- 11.2.7.4. Recent Developments
- 11.2.7.5. Financials (Based on Availability)
- 11.2.8 UFSK-OSYS
- 11.2.8.1. Overview
- 11.2.8.2. Products
- 11.2.8.3. SWOT Analysis
- 11.2.8.4. Recent Developments
- 11.2.8.5. Financials (Based on Availability)
- 11.2.9 Medifa-hesse
- 11.2.9.1. Overview
- 11.2.9.2. Products
- 11.2.9.3. SWOT Analysis
- 11.2.9.4. Recent Developments
- 11.2.9.5. Financials (Based on Availability)
- 11.2.10 Eschmann Equipment
- 11.2.10.1. Overview
- 11.2.10.2. Products
- 11.2.10.3. SWOT Analysis
- 11.2.10.4. Recent Developments
- 11.2.10.5. Financials (Based on Availability)
- 11.2.11 AGA Sanitatsartikel
- 11.2.11.1. Overview
- 11.2.11.2. Products
- 11.2.11.3. SWOT Analysis
- 11.2.11.4. Recent Developments
- 11.2.11.5. Financials (Based on Availability)
- 11.2.12 Lojer
- 11.2.12.1. Overview
- 11.2.12.2. Products
- 11.2.12.3. SWOT Analysis
- 11.2.12.4. Recent Developments
- 11.2.12.5. Financials (Based on Availability)
- 11.2.13 Schmitz
- 11.2.13.1. Overview
- 11.2.13.2. Products
- 11.2.13.3. SWOT Analysis
- 11.2.13.4. Recent Developments
- 11.2.13.5. Financials (Based on Availability)
- 11.2.14 Schaerer Medical
- 11.2.14.1. Overview
- 11.2.14.2. Products
- 11.2.14.3. SWOT Analysis
- 11.2.14.4. Recent Developments
- 11.2.14.5. Financials (Based on Availability)
- 11.2.15 Brumaba
- 11.2.15.1. Overview
- 11.2.15.2. Products
- 11.2.15.3. SWOT Analysis
- 11.2.15.4. Recent Developments
- 11.2.15.5. Financials (Based on Availability)
- 11.2.16 Bender
- 11.2.16.1. Overview
- 11.2.16.2. Products
- 11.2.16.3. SWOT Analysis
- 11.2.16.4. Recent Developments
- 11.2.16.5. Financials (Based on Availability)
- 11.2.17 Merivaara
- 11.2.17.1. Overview
- 11.2.17.2. Products
- 11.2.17.3. SWOT Analysis
- 11.2.17.4. Recent Developments
- 11.2.17.5. Financials (Based on Availability)
- 11.2.18 Infinium Medical
- 11.2.18.1. Overview
- 11.2.18.2. Products
- 11.2.18.3. SWOT Analysis
- 11.2.18.4. Recent Developments
- 11.2.18.5. Financials (Based on Availability)
- 11.2.19 Image Diagnostics
- 11.2.19.1. Overview
- 11.2.19.2. Products
- 11.2.19.3. SWOT Analysis
- 11.2.19.4. Recent Developments
- 11.2.19.5. Financials (Based on Availability)
- 11.2.20 Mindray Medical
- 11.2.20.1. Overview
- 11.2.20.2. Products
- 11.2.20.3. SWOT Analysis
- 11.2.20.4. Recent Developments
- 11.2.20.5. Financials (Based on Availability)
- 11.2.21 PAX Medical
- 11.2.21.1. Overview
- 11.2.21.2. Products
- 11.2.21.3. SWOT Analysis
- 11.2.21.4. Recent Developments
- 11.2.21.5. Financials (Based on Availability)
- 11.2.1 Getinge
List of Figures
- Figure 1: Global Surgical Assist Systems Revenue Breakdown (billion, %) by Region 2025 & 2033
- Figure 2: Global Surgical Assist Systems Volume Breakdown (K, %) by Region 2025 & 2033
- Figure 3: North America Surgical Assist Systems Revenue (billion), by Application 2025 & 2033
- Figure 4: North America Surgical Assist Systems Volume (K), by Application 2025 & 2033
- Figure 5: North America Surgical Assist Systems Revenue Share (%), by Application 2025 & 2033
- Figure 6: North America Surgical Assist Systems Volume Share (%), by Application 2025 & 2033
- Figure 7: North America Surgical Assist Systems Revenue (billion), by Types 2025 & 2033
- Figure 8: North America Surgical Assist Systems Volume (K), by Types 2025 & 2033
- Figure 9: North America Surgical Assist Systems Revenue Share (%), by Types 2025 & 2033
- Figure 10: North America Surgical Assist Systems Volume Share (%), by Types 2025 & 2033
- Figure 11: North America Surgical Assist Systems Revenue (billion), by Country 2025 & 2033
- Figure 12: North America Surgical Assist Systems Volume (K), by Country 2025 & 2033
- Figure 13: North America Surgical Assist Systems Revenue Share (%), by Country 2025 & 2033
- Figure 14: North America Surgical Assist Systems Volume Share (%), by Country 2025 & 2033
- Figure 15: South America Surgical Assist Systems Revenue (billion), by Application 2025 & 2033
- Figure 16: South America Surgical Assist Systems Volume (K), by Application 2025 & 2033
- Figure 17: South America Surgical Assist Systems Revenue Share (%), by Application 2025 & 2033
- Figure 18: South America Surgical Assist Systems Volume Share (%), by Application 2025 & 2033
- Figure 19: South America Surgical Assist Systems Revenue (billion), by Types 2025 & 2033
- Figure 20: South America Surgical Assist Systems Volume (K), by Types 2025 & 2033
- Figure 21: South America Surgical Assist Systems Revenue Share (%), by Types 2025 & 2033
- Figure 22: South America Surgical Assist Systems Volume Share (%), by Types 2025 & 2033
- Figure 23: South America Surgical Assist Systems Revenue (billion), by Country 2025 & 2033
- Figure 24: South America Surgical Assist Systems Volume (K), by Country 2025 & 2033
- Figure 25: South America Surgical Assist Systems Revenue Share (%), by Country 2025 & 2033
- Figure 26: South America Surgical Assist Systems Volume Share (%), by Country 2025 & 2033
- Figure 27: Europe Surgical Assist Systems Revenue (billion), by Application 2025 & 2033
- Figure 28: Europe Surgical Assist Systems Volume (K), by Application 2025 & 2033
- Figure 29: Europe Surgical Assist Systems Revenue Share (%), by Application 2025 & 2033
- Figure 30: Europe Surgical Assist Systems Volume Share (%), by Application 2025 & 2033
- Figure 31: Europe Surgical Assist Systems Revenue (billion), by Types 2025 & 2033
- Figure 32: Europe Surgical Assist Systems Volume (K), by Types 2025 & 2033
- Figure 33: Europe Surgical Assist Systems Revenue Share (%), by Types 2025 & 2033
- Figure 34: Europe Surgical Assist Systems Volume Share (%), by Types 2025 & 2033
- Figure 35: Europe Surgical Assist Systems Revenue (billion), by Country 2025 & 2033
- Figure 36: Europe Surgical Assist Systems Volume (K), by Country 2025 & 2033
- Figure 37: Europe Surgical Assist Systems Revenue Share (%), by Country 2025 & 2033
- Figure 38: Europe Surgical Assist Systems Volume Share (%), by Country 2025 & 2033
- Figure 39: Middle East & Africa Surgical Assist Systems Revenue (billion), by Application 2025 & 2033
- Figure 40: Middle East & Africa Surgical Assist Systems Volume (K), by Application 2025 & 2033
- Figure 41: Middle East & Africa Surgical Assist Systems Revenue Share (%), by Application 2025 & 2033
- Figure 42: Middle East & Africa Surgical Assist Systems Volume Share (%), by Application 2025 & 2033
- Figure 43: Middle East & Africa Surgical Assist Systems Revenue (billion), by Types 2025 & 2033
- Figure 44: Middle East & Africa Surgical Assist Systems Volume (K), by Types 2025 & 2033
- Figure 45: Middle East & Africa Surgical Assist Systems Revenue Share (%), by Types 2025 & 2033
- Figure 46: Middle East & Africa Surgical Assist Systems Volume Share (%), by Types 2025 & 2033
- Figure 47: Middle East & Africa Surgical Assist Systems Revenue (billion), by Country 2025 & 2033
- Figure 48: Middle East & Africa Surgical Assist Systems Volume (K), by Country 2025 & 2033
- Figure 49: Middle East & Africa Surgical Assist Systems Revenue Share (%), by Country 2025 & 2033
- Figure 50: Middle East & Africa Surgical Assist Systems Volume Share (%), by Country 2025 & 2033
- Figure 51: Asia Pacific Surgical Assist Systems Revenue (billion), by Application 2025 & 2033
- Figure 52: Asia Pacific Surgical Assist Systems Volume (K), by Application 2025 & 2033
- Figure 53: Asia Pacific Surgical Assist Systems Revenue Share (%), by Application 2025 & 2033
- Figure 54: Asia Pacific Surgical Assist Systems Volume Share (%), by Application 2025 & 2033
- Figure 55: Asia Pacific Surgical Assist Systems Revenue (billion), by Types 2025 & 2033
- Figure 56: Asia Pacific Surgical Assist Systems Volume (K), by Types 2025 & 2033
- Figure 57: Asia Pacific Surgical Assist Systems Revenue Share (%), by Types 2025 & 2033
- Figure 58: Asia Pacific Surgical Assist Systems Volume Share (%), by Types 2025 & 2033
- Figure 59: Asia Pacific Surgical Assist Systems Revenue (billion), by Country 2025 & 2033
- Figure 60: Asia Pacific Surgical Assist Systems Volume (K), by Country 2025 & 2033
- Figure 61: Asia Pacific Surgical Assist Systems Revenue Share (%), by Country 2025 & 2033
- Figure 62: Asia Pacific Surgical Assist Systems Volume Share (%), by Country 2025 & 2033
List of Tables
- Table 1: Global Surgical Assist Systems Revenue billion Forecast, by Application 2020 & 2033
- Table 2: Global Surgical Assist Systems Volume K Forecast, by Application 2020 & 2033
- Table 3: Global Surgical Assist Systems Revenue billion Forecast, by Types 2020 & 2033
- Table 4: Global Surgical Assist Systems Volume K Forecast, by Types 2020 & 2033
- Table 5: Global Surgical Assist Systems Revenue billion Forecast, by Region 2020 & 2033
- Table 6: Global Surgical Assist Systems Volume K Forecast, by Region 2020 & 2033
- Table 7: Global Surgical Assist Systems Revenue billion Forecast, by Application 2020 & 2033
- Table 8: Global Surgical Assist Systems Volume K Forecast, by Application 2020 & 2033
- Table 9: Global Surgical Assist Systems Revenue billion Forecast, by Types 2020 & 2033
- Table 10: Global Surgical Assist Systems Volume K Forecast, by Types 2020 & 2033
- Table 11: Global Surgical Assist Systems Revenue billion Forecast, by Country 2020 & 2033
- Table 12: Global Surgical Assist Systems Volume K Forecast, by Country 2020 & 2033
- Table 13: United States Surgical Assist Systems Revenue (billion) Forecast, by Application 2020 & 2033
- Table 14: United States Surgical Assist Systems Volume (K) Forecast, by Application 2020 & 2033
- Table 15: Canada Surgical Assist Systems Revenue (billion) Forecast, by Application 2020 & 2033
- Table 16: Canada Surgical Assist Systems Volume (K) Forecast, by Application 2020 & 2033
- Table 17: Mexico Surgical Assist Systems Revenue (billion) Forecast, by Application 2020 & 2033
- Table 18: Mexico Surgical Assist Systems Volume (K) Forecast, by Application 2020 & 2033
- Table 19: Global Surgical Assist Systems Revenue billion Forecast, by Application 2020 & 2033
- Table 20: Global Surgical Assist Systems Volume K Forecast, by Application 2020 & 2033
- Table 21: Global Surgical Assist Systems Revenue billion Forecast, by Types 2020 & 2033
- Table 22: Global Surgical Assist Systems Volume K Forecast, by Types 2020 & 2033
- Table 23: Global Surgical Assist Systems Revenue billion Forecast, by Country 2020 & 2033
- Table 24: Global Surgical Assist Systems Volume K Forecast, by Country 2020 & 2033
- Table 25: Brazil Surgical Assist Systems Revenue (billion) Forecast, by Application 2020 & 2033
- Table 26: Brazil Surgical Assist Systems Volume (K) Forecast, by Application 2020 & 2033
- Table 27: Argentina Surgical Assist Systems Revenue (billion) Forecast, by Application 2020 & 2033
- Table 28: Argentina Surgical Assist Systems Volume (K) Forecast, by Application 2020 & 2033
- Table 29: Rest of South America Surgical Assist Systems Revenue (billion) Forecast, by Application 2020 & 2033
- Table 30: Rest of South America Surgical Assist Systems Volume (K) Forecast, by Application 2020 & 2033
- Table 31: Global Surgical Assist Systems Revenue billion Forecast, by Application 2020 & 2033
- Table 32: Global Surgical Assist Systems Volume K Forecast, by Application 2020 & 2033
- Table 33: Global Surgical Assist Systems Revenue billion Forecast, by Types 2020 & 2033
- Table 34: Global Surgical Assist Systems Volume K Forecast, by Types 2020 & 2033
- Table 35: Global Surgical Assist Systems Revenue billion Forecast, by Country 2020 & 2033
- Table 36: Global Surgical Assist Systems Volume K Forecast, by Country 2020 & 2033
- Table 37: United Kingdom Surgical Assist Systems Revenue (billion) Forecast, by Application 2020 & 2033
- Table 38: United Kingdom Surgical Assist Systems Volume (K) Forecast, by Application 2020 & 2033
- Table 39: Germany Surgical Assist Systems Revenue (billion) Forecast, by Application 2020 & 2033
- Table 40: Germany Surgical Assist Systems Volume (K) Forecast, by Application 2020 & 2033
- Table 41: France Surgical Assist Systems Revenue (billion) Forecast, by Application 2020 & 2033
- Table 42: France Surgical Assist Systems Volume (K) Forecast, by Application 2020 & 2033
- Table 43: Italy Surgical Assist Systems Revenue (billion) Forecast, by Application 2020 & 2033
- Table 44: Italy Surgical Assist Systems Volume (K) Forecast, by Application 2020 & 2033
- Table 45: Spain Surgical Assist Systems Revenue (billion) Forecast, by Application 2020 & 2033
- Table 46: Spain Surgical Assist Systems Volume (K) Forecast, by Application 2020 & 2033
- Table 47: Russia Surgical Assist Systems Revenue (billion) Forecast, by Application 2020 & 2033
- Table 48: Russia Surgical Assist Systems Volume (K) Forecast, by Application 2020 & 2033
- Table 49: Benelux Surgical Assist Systems Revenue (billion) Forecast, by Application 2020 & 2033
- Table 50: Benelux Surgical Assist Systems Volume (K) Forecast, by Application 2020 & 2033
- Table 51: Nordics Surgical Assist Systems Revenue (billion) Forecast, by Application 2020 & 2033
- Table 52: Nordics Surgical Assist Systems Volume (K) Forecast, by Application 2020 & 2033
- Table 53: Rest of Europe Surgical Assist Systems Revenue (billion) Forecast, by Application 2020 & 2033
- Table 54: Rest of Europe Surgical Assist Systems Volume (K) Forecast, by Application 2020 & 2033
- Table 55: Global Surgical Assist Systems Revenue billion Forecast, by Application 2020 & 2033
- Table 56: Global Surgical Assist Systems Volume K Forecast, by Application 2020 & 2033
- Table 57: Global Surgical Assist Systems Revenue billion Forecast, by Types 2020 & 2033
- Table 58: Global Surgical Assist Systems Volume K Forecast, by Types 2020 & 2033
- Table 59: Global Surgical Assist Systems Revenue billion Forecast, by Country 2020 & 2033
- Table 60: Global Surgical Assist Systems Volume K Forecast, by Country 2020 & 2033
- Table 61: Turkey Surgical Assist Systems Revenue (billion) Forecast, by Application 2020 & 2033
- Table 62: Turkey Surgical Assist Systems Volume (K) Forecast, by Application 2020 & 2033
- Table 63: Israel Surgical Assist Systems Revenue (billion) Forecast, by Application 2020 & 2033
- Table 64: Israel Surgical Assist Systems Volume (K) Forecast, by Application 2020 & 2033
- Table 65: GCC Surgical Assist Systems Revenue (billion) Forecast, by Application 2020 & 2033
- Table 66: GCC Surgical Assist Systems Volume (K) Forecast, by Application 2020 & 2033
- Table 67: North Africa Surgical Assist Systems Revenue (billion) Forecast, by Application 2020 & 2033
- Table 68: North Africa Surgical Assist Systems Volume (K) Forecast, by Application 2020 & 2033
- Table 69: South Africa Surgical Assist Systems Revenue (billion) Forecast, by Application 2020 & 2033
- Table 70: South Africa Surgical Assist Systems Volume (K) Forecast, by Application 2020 & 2033
- Table 71: Rest of Middle East & Africa Surgical Assist Systems Revenue (billion) Forecast, by Application 2020 & 2033
- Table 72: Rest of Middle East & Africa Surgical Assist Systems Volume (K) Forecast, by Application 2020 & 2033
- Table 73: Global Surgical Assist Systems Revenue billion Forecast, by Application 2020 & 2033
- Table 74: Global Surgical Assist Systems Volume K Forecast, by Application 2020 & 2033
- Table 75: Global Surgical Assist Systems Revenue billion Forecast, by Types 2020 & 2033
- Table 76: Global Surgical Assist Systems Volume K Forecast, by Types 2020 & 2033
- Table 77: Global Surgical Assist Systems Revenue billion Forecast, by Country 2020 & 2033
- Table 78: Global Surgical Assist Systems Volume K Forecast, by Country 2020 & 2033
- Table 79: China Surgical Assist Systems Revenue (billion) Forecast, by Application 2020 & 2033
- Table 80: China Surgical Assist Systems Volume (K) Forecast, by Application 2020 & 2033
- Table 81: India Surgical Assist Systems Revenue (billion) Forecast, by Application 2020 & 2033
- Table 82: India Surgical Assist Systems Volume (K) Forecast, by Application 2020 & 2033
- Table 83: Japan Surgical Assist Systems Revenue (billion) Forecast, by Application 2020 & 2033
- Table 84: Japan Surgical Assist Systems Volume (K) Forecast, by Application 2020 & 2033
- Table 85: South Korea Surgical Assist Systems Revenue (billion) Forecast, by Application 2020 & 2033
- Table 86: South Korea Surgical Assist Systems Volume (K) Forecast, by Application 2020 & 2033
- Table 87: ASEAN Surgical Assist Systems Revenue (billion) Forecast, by Application 2020 & 2033
- Table 88: ASEAN Surgical Assist Systems Volume (K) Forecast, by Application 2020 & 2033
- Table 89: Oceania Surgical Assist Systems Revenue (billion) Forecast, by Application 2020 & 2033
- Table 90: Oceania Surgical Assist Systems Volume (K) Forecast, by Application 2020 & 2033
- Table 91: Rest of Asia Pacific Surgical Assist Systems Revenue (billion) Forecast, by Application 2020 & 2033
- Table 92: Rest of Asia Pacific Surgical Assist Systems Volume (K) Forecast, by Application 2020 & 2033
Frequently Asked Questions
1. What is the projected Compound Annual Growth Rate (CAGR) of the Surgical Assist Systems?
The projected CAGR is approximately 8.58%.
2. Which companies are prominent players in the Surgical Assist Systems?
Key companies in the market include Getinge, Hill-Rom, Skytron, STERIS, Stryker, Mizuho, Alvo, UFSK-OSYS, Medifa-hesse, Eschmann Equipment, AGA Sanitatsartikel, Lojer, Schmitz, Schaerer Medical, Brumaba, Bender, Merivaara, Infinium Medical, Image Diagnostics, Mindray Medical, PAX Medical.
3. What are the main segments of the Surgical Assist Systems?
The market segments include Application, Types.
4. Can you provide details about the market size?
The market size is estimated to be USD 9.18 billion as of 2022.
5. What are some drivers contributing to market growth?
N/A
6. What are the notable trends driving market growth?
N/A
7. Are there any restraints impacting market growth?
N/A
8. Can you provide examples of recent developments in the market?
N/A
9. What pricing options are available for accessing the report?
Pricing options include single-user, multi-user, and enterprise licenses priced at USD 3350.00, USD 5025.00, and USD 6700.00 respectively.
10. Is the market size provided in terms of value or volume?
The market size is provided in terms of value, measured in billion and volume, measured in K.
11. Are there any specific market keywords associated with the report?
Yes, the market keyword associated with the report is "Surgical Assist Systems," which aids in identifying and referencing the specific market segment covered.
12. How do I determine which pricing option suits my needs best?
The pricing options vary based on user requirements and access needs. Individual users may opt for single-user licenses, while businesses requiring broader access may choose multi-user or enterprise licenses for cost-effective access to the report.
13. Are there any additional resources or data provided in the Surgical Assist Systems report?
While the report offers comprehensive insights, it's advisable to review the specific contents or supplementary materials provided to ascertain if additional resources or data are available.
14. How can I stay updated on further developments or reports in the Surgical Assist Systems?
To stay informed about further developments, trends, and reports in the Surgical Assist Systems, consider subscribing to industry newsletters, following relevant companies and organizations, or regularly checking reputable industry news sources and publications.
Methodology
Step 1 - Identification of Relevant Samples Size from Population Database


Step 2 - Approaches for Defining Global Market Size (Value, Volume* & Price*)

Note*: In applicable scenarios
Step 3 - Data Sources
Primary Research
- Web Analytics
- Survey Reports
- Research Institute
- Latest Research Reports
- Opinion Leaders
Secondary Research
- Annual Reports
- White Paper
- Latest Press Release
- Industry Association
- Paid Database
- Investor Presentations

Step 4 - Data Triangulation
Involves using different sources of information in order to increase the validity of a study
These sources are likely to be stakeholders in a program - participants, other researchers, program staff, other community members, and so on.
Then we put all data in single framework & apply various statistical tools to find out the dynamic on the market.
During the analysis stage, feedback from the stakeholder groups would be compared to determine areas of agreement as well as areas of divergence