

Key Insights
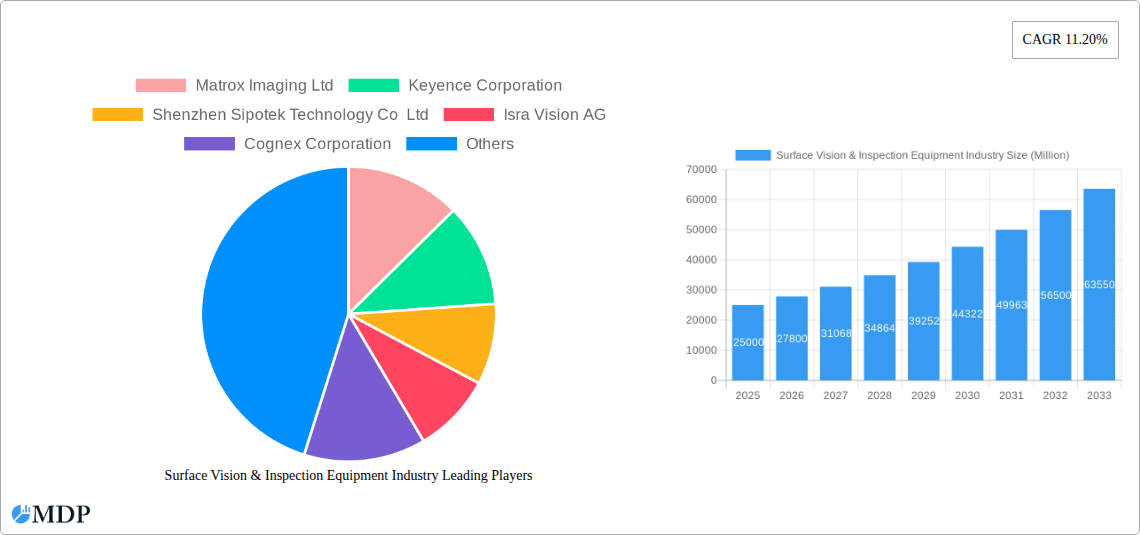
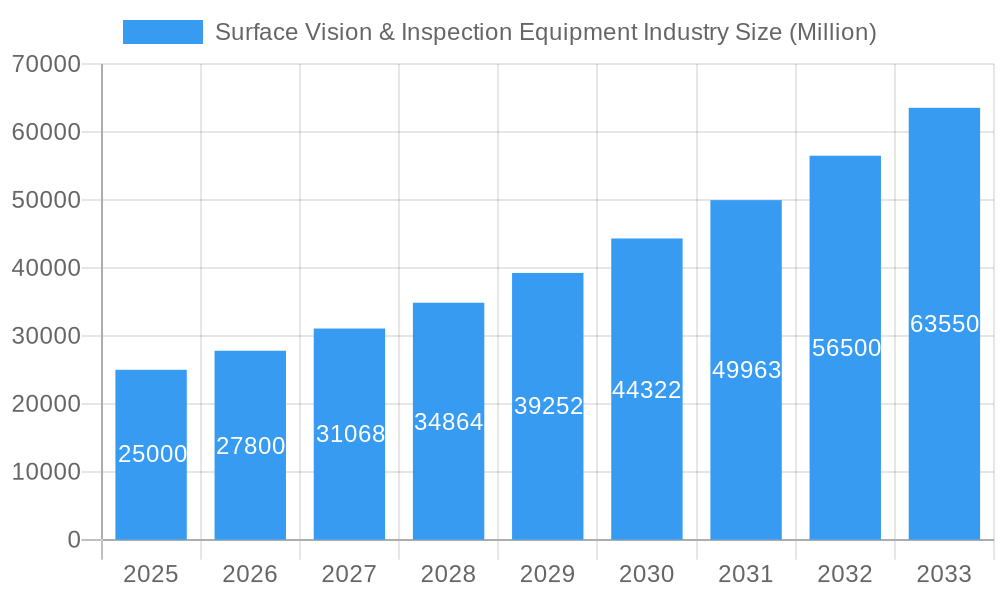
The global surface vision and inspection equipment market is projected for substantial growth, driven by increasing industrial automation and the adoption of Industry 4.0 technologies. With a robust Compound Annual Growth Rate (CAGR) of 14.56%, the market is anticipated to reach a size of $14.86 billion by 2033, commencing from the base year 2025. Key growth catalysts include the escalating demand for high-quality production and efficient processes across automotive, electronics, and pharmaceutical sectors. Advancements in Artificial Intelligence (AI) and Machine Learning (ML) integrated into vision systems are enhancing accuracy and speed. Stringent quality control mandates further propel market expansion. The camera segment holds a dominant share, underscoring the criticality of high-resolution imaging. Leading innovators like Cognex, Keyence, and Matrox Imaging are pivotal in driving technological progress. However, initial investment costs and the requirement for skilled personnel may pose challenges, particularly for small and medium-sized enterprises.
Surface Vision & Inspection Equipment Industry Market Size (In Billion)
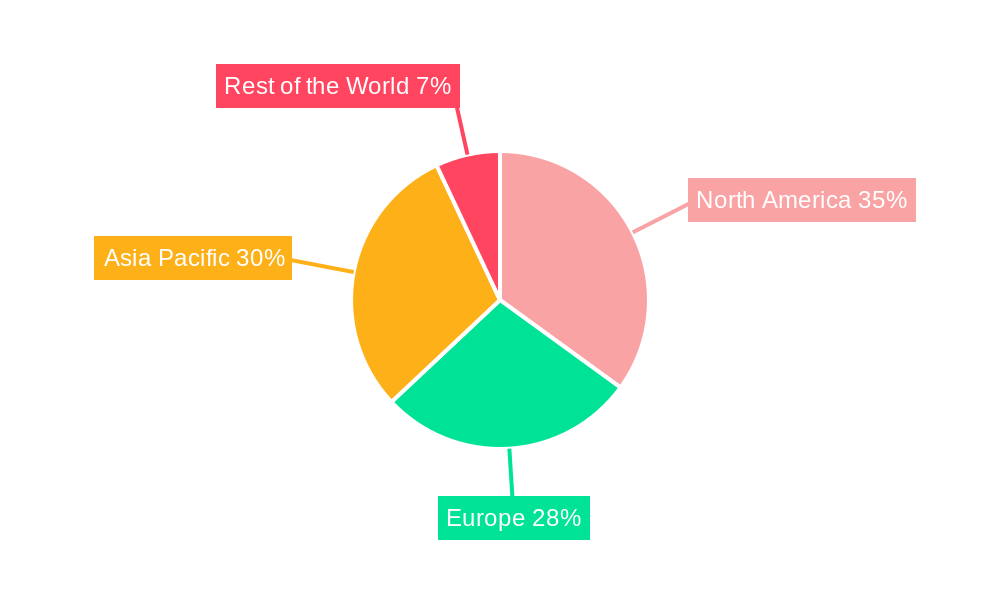
Geographically, North America and Asia Pacific are poised to lead market share due to established manufacturing bases and advanced technological infrastructure. Europe is also expected to maintain a significant presence, supported by its advanced manufacturing sector and automation adoption. The forecast period will witness continued market expansion driven by ongoing technological innovations and increasing automation across diverse industries. The market will evolve towards more integrated, user-friendly, and cost-effective solutions, addressing niche industry requirements and existing restraints.
Surface Vision & Inspection Equipment Industry Company Market Share
Surface Vision & Inspection Equipment Industry: A Comprehensive Market Report (2019-2033)
This in-depth report provides a comprehensive analysis of the global Surface Vision & Inspection Equipment market, offering invaluable insights for stakeholders, investors, and industry professionals. The study period spans from 2019 to 2033, with 2025 serving as both the base and estimated year. The report projects robust growth, reaching a market value of xx Million by 2033. This report is crucial for understanding the current landscape and predicting future trends in this dynamic sector.
Surface Vision & Inspection Equipment Industry Market Dynamics & Concentration
The global surface vision and inspection equipment market is characterized by moderate concentration, with key players holding significant market share. However, the market exhibits a dynamic competitive landscape with continuous innovation and strategic mergers and acquisitions (M&A) driving consolidation. Between 2019 and 2024, approximately xx M&A deals were recorded, signifying the industry's appetite for growth through strategic partnerships. Major players, including Cognex Corporation and Keyence Corporation, hold a significant portion (approximately xx%) of the market share, but smaller niche players also contribute to the market's vibrancy. Innovation is a key driver, with companies investing heavily in advanced technologies like AI-powered vision systems and improved sensor technologies. Regulatory frameworks, particularly those related to safety and quality control in various end-use industries, significantly influence market trends. The market also experiences competitive pressures from substitute technologies, although their impact remains limited due to the specific demands of high-precision surface inspection. Finally, end-user trends, particularly the increasing adoption of automation in manufacturing and the growing demand for quality assurance across diverse sectors, are fostering market growth.
Surface Vision & Inspection Equipment Industry Industry Trends & Analysis
The surface vision and inspection equipment market exhibits a strong growth trajectory, driven by several factors. The compound annual growth rate (CAGR) from 2025 to 2033 is projected at xx%, reflecting the increasing demand for automated inspection solutions across various sectors. Technological disruptions, such as the integration of artificial intelligence (AI) and machine learning (ML) into vision systems, are enhancing inspection accuracy and efficiency, thus driving market penetration. Consumer preferences are shifting towards higher-quality products and increased automation in manufacturing, further bolstering the demand for advanced inspection equipment. The competitive dynamics are marked by continuous product innovation, strategic partnerships, and acquisitions, which all contribute to the overall market growth. The market penetration rate of advanced vision systems is expected to reach xx% by 2033, reflecting the widespread adoption of these technologies across various industries. This is fueled by factors such as increasing production volumes, a greater emphasis on quality control, and the desire to reduce production costs.
Leading Markets & Segments in Surface Vision & Inspection Equipment Industry
The automotive industry remains the dominant application segment, accounting for approximately xx% of the market in 2025. This is attributed to the stringent quality requirements within automotive manufacturing and the high demand for automated inspection solutions in this sector.
- Key Drivers in the Automotive Segment: Stringent quality standards, increasing production volumes, and the adoption of advanced driver-assistance systems (ADAS).
The electrical and electronics segment is also a significant contributor, representing approximately xx% of the market share in 2025. Growth in this sector is fueled by the miniaturization of electronic components and the growing demand for high-precision inspection in the manufacturing process.
- Key Drivers in the Electrical & Electronics Segment: Miniaturization of components, growing demand for higher quality standards in consumer electronics and the need for efficient quality control in PCB manufacturing.
In terms of components, the camera segment holds the largest market share, with approximately xx% in 2025, owing to the crucial role cameras play in capturing visual data for inspection purposes.
- Key Drivers in the Camera Segment: Advancements in image sensor technology, increasing demand for high-resolution cameras, and the integration of AI and ML capabilities.
Geographically, North America and Asia-Pacific are the leading regions, with North America leading in terms of technological advancements and Asia-Pacific driving growth through increasing manufacturing activities. Europe holds a substantial market share, driven by its robust automotive and manufacturing industries.
Surface Vision & Inspection Equipment Industry Product Developments
Recent years have witnessed significant product innovations in the surface vision and inspection equipment industry. This includes the development of AI-powered vision systems that offer improved accuracy and speed, along with 3D vision systems capable of capturing complex surface geometries. These advancements have broadened the applications of these systems beyond traditional manufacturing, extending into areas such as medical device inspection and food quality control. The integration of smart sensors and advanced image processing algorithms further enhances the capabilities of these systems, enabling real-time analysis and automated defect detection. This increased functionality contributes to improved efficiency and reduced production costs, thus increasing market fit and creating competitive advantages for manufacturers.
Key Drivers of Surface Vision & Inspection Equipment Industry Growth
Several factors drive the growth of the surface vision and inspection equipment industry. Technological advancements, particularly in AI, machine learning, and 3D imaging, are improving the accuracy and speed of inspection processes. Economic growth in various sectors, especially manufacturing, increases demand for automation and quality control solutions. Finally, stringent regulatory requirements regarding product quality and safety in diverse industries further fuel market expansion. These factors combine to create a positive environment for continued market growth.
Challenges in the Surface Vision & Inspection Equipment Industry Market
The surface vision and inspection equipment industry faces various challenges. High initial investment costs for advanced systems can hinder adoption, particularly for small and medium-sized enterprises (SMEs). Supply chain disruptions and fluctuations in raw material costs can impact production and profitability. Intense competition, particularly from established players, and the emergence of new entrants with innovative solutions, place considerable pressure on market participants. These factors collectively create a dynamic and challenging environment.
Emerging Opportunities in Surface Vision & Inspection Equipment Industry
The future holds significant growth opportunities for the surface vision and inspection equipment industry. Technological breakthroughs in areas like hyperspectral imaging and improved AI algorithms promise to enhance inspection capabilities further. Strategic partnerships between equipment manufacturers and end-users will drive the development of customized solutions tailored to specific industry needs. Expansion into new and emerging markets, particularly in developing economies experiencing rapid industrialization, will create significant growth potential. These trends point to a bright outlook for the industry.
Leading Players in the Surface Vision & Inspection Equipment Industry Sector
- Matrox Imaging Ltd
- Keyence Corporation
- Shenzhen Sipotek Technology Co Ltd
- Isra Vision AG
- Cognex Corporation
- Stemmer Imaging AG
- AMETEK Surface Vision
- Omron Corporation
- Comvis AG
- Daitron Inc
- Flexfilm Ltd
- Edmund Scientific Corporation
- Panasonic Corporation
Key Milestones in Surface Vision & Inspection Equipment Industry Industry
- 2020: Cognex Corporation launches its In-Sight 2800 vision system, enhancing AI capabilities.
- 2021: Keyence Corporation introduces its new line of 3D laser displacement sensors.
- 2022: Matrox Imaging Ltd partners with a leading AI software provider to integrate AI capabilities into its vision systems.
- 2023: Several M&A activities are observed in the industry, consolidating market shares.
- 2024: Introduction of new hyperspectral imaging systems for enhanced surface defect detection.
Strategic Outlook for Surface Vision & Inspection Equipment Industry Market
The future of the surface vision and inspection equipment market is promising. Continued technological advancements, coupled with increasing demand for automation and quality control across various sectors, will drive significant growth. Strategic partnerships, acquisitions, and expansion into new markets will further enhance the market's potential. The industry is poised for sustained expansion, driven by the need for enhanced efficiency, productivity, and quality assurance across numerous applications.
Surface Vision & Inspection Equipment Industry Segmentation
-
1. Component
- 1.1. Camera
- 1.2. Lighting Equipment
- 1.3. Optics
- 1.4. Other Components
-
2. Application
- 2.1. Automotive
- 2.2. Electrical & Electronics
- 2.3. Medical & Pharmaceuticals
- 2.4. Food & Beverages
- 2.5. Postal & Logistics
- 2.6. Other Applications
Surface Vision & Inspection Equipment Industry Segmentation By Geography
- 1. North America
- 2. Europe
- 3. Asia Pacific
- 4. Rest of the World
Surface Vision & Inspection Equipment Industry Regional Market Share
Geographic Coverage of Surface Vision & Inspection Equipment Industry
Surface Vision & Inspection Equipment Industry REPORT HIGHLIGHTS
| Aspects | Details |
|---|---|
| Study Period | 2020-2034 |
| Base Year | 2025 |
| Estimated Year | 2026 |
| Forecast Period | 2026-2034 |
| Historical Period | 2020-2025 |
| Growth Rate | CAGR of 14.56% from 2020-2034 |
| Segmentation |
|
Table of Contents
- 1. Introduction
- 1.1. Research Scope
- 1.2. Market Segmentation
- 1.3. Research Objective
- 1.4. Definitions and Assumptions
- 2. Executive Summary
- 2.1. Market Snapshot
- 3. Market Dynamics
- 3.1. Market Drivers
- 3.2. Market Restrains
- 3.3. Market Trends
- 3.4. Market Opportunities
- 4. Market Factor Analysis
- 4.1. Porters Five Forces
- 4.1.1. Bargaining Power of Suppliers
- 4.1.2. Bargaining Power of Buyers
- 4.1.3. Threat of New Entrants
- 4.1.4. Threat of Substitutes
- 4.1.5. Competitive Rivalry
- 4.2. PESTEL analysis
- 4.3. BCG Analysis
- 4.3.1. Stars (High Growth, High Market Share)
- 4.3.2. Cash Cows (Low Growth, High Market Share)
- 4.3.3. Question Mark (High Growth, Low Market Share)
- 4.3.4. Dogs (Low Growth, Low Market Share)
- 4.4. Ansoff Matrix Analysis
- 4.5. Supply Chain Analysis
- 4.6. Regulatory Landscape
- 4.7. Current Market Potential and Opportunity Assessment (TAM–SAM–SOM Framework)
- 4.8. MDP Analyst Note
- 4.1. Porters Five Forces
- 5. Market Analysis, Insights and Forecast 2021-2033
- 5.1. Market Analysis, Insights and Forecast - by Component
- 5.1.1. Camera
- 5.1.2. Lighting Equipment
- 5.1.3. Optics
- 5.1.4. Other Components
- 5.2. Market Analysis, Insights and Forecast - by Application
- 5.2.1. Automotive
- 5.2.2. Electrical & Electronics
- 5.2.3. Medical & Pharmaceuticals
- 5.2.4. Food & Beverages
- 5.2.5. Postal & Logistics
- 5.2.6. Other Applications
- 5.3. Market Analysis, Insights and Forecast - by Region
- 5.3.1. North America
- 5.3.2. Europe
- 5.3.3. Asia Pacific
- 5.3.4. Rest of the World
- 5.1. Market Analysis, Insights and Forecast - by Component
- 6. Global Surface Vision & Inspection Equipment Industry Analysis, Insights and Forecast, 2021-2033
- 6.1. Market Analysis, Insights and Forecast - by Component
- 6.1.1. Camera
- 6.1.2. Lighting Equipment
- 6.1.3. Optics
- 6.1.4. Other Components
- 6.2. Market Analysis, Insights and Forecast - by Application
- 6.2.1. Automotive
- 6.2.2. Electrical & Electronics
- 6.2.3. Medical & Pharmaceuticals
- 6.2.4. Food & Beverages
- 6.2.5. Postal & Logistics
- 6.2.6. Other Applications
- 6.1. Market Analysis, Insights and Forecast - by Component
- 7. North America Surface Vision & Inspection Equipment Industry Analysis, Insights and Forecast, 2020-2032
- 7.1. Market Analysis, Insights and Forecast - by Component
- 7.1.1. Camera
- 7.1.2. Lighting Equipment
- 7.1.3. Optics
- 7.1.4. Other Components
- 7.2. Market Analysis, Insights and Forecast - by Application
- 7.2.1. Automotive
- 7.2.2. Electrical & Electronics
- 7.2.3. Medical & Pharmaceuticals
- 7.2.4. Food & Beverages
- 7.2.5. Postal & Logistics
- 7.2.6. Other Applications
- 7.1. Market Analysis, Insights and Forecast - by Component
- 8. Europe Surface Vision & Inspection Equipment Industry Analysis, Insights and Forecast, 2020-2032
- 8.1. Market Analysis, Insights and Forecast - by Component
- 8.1.1. Camera
- 8.1.2. Lighting Equipment
- 8.1.3. Optics
- 8.1.4. Other Components
- 8.2. Market Analysis, Insights and Forecast - by Application
- 8.2.1. Automotive
- 8.2.2. Electrical & Electronics
- 8.2.3. Medical & Pharmaceuticals
- 8.2.4. Food & Beverages
- 8.2.5. Postal & Logistics
- 8.2.6. Other Applications
- 8.1. Market Analysis, Insights and Forecast - by Component
- 9. Asia Pacific Surface Vision & Inspection Equipment Industry Analysis, Insights and Forecast, 2020-2032
- 9.1. Market Analysis, Insights and Forecast - by Component
- 9.1.1. Camera
- 9.1.2. Lighting Equipment
- 9.1.3. Optics
- 9.1.4. Other Components
- 9.2. Market Analysis, Insights and Forecast - by Application
- 9.2.1. Automotive
- 9.2.2. Electrical & Electronics
- 9.2.3. Medical & Pharmaceuticals
- 9.2.4. Food & Beverages
- 9.2.5. Postal & Logistics
- 9.2.6. Other Applications
- 9.1. Market Analysis, Insights and Forecast - by Component
- 10. Rest of the World Surface Vision & Inspection Equipment Industry Analysis, Insights and Forecast, 2020-2032
- 10.1. Market Analysis, Insights and Forecast - by Component
- 10.1.1. Camera
- 10.1.2. Lighting Equipment
- 10.1.3. Optics
- 10.1.4. Other Components
- 10.2. Market Analysis, Insights and Forecast - by Application
- 10.2.1. Automotive
- 10.2.2. Electrical & Electronics
- 10.2.3. Medical & Pharmaceuticals
- 10.2.4. Food & Beverages
- 10.2.5. Postal & Logistics
- 10.2.6. Other Applications
- 10.1. Market Analysis, Insights and Forecast - by Component
- 11. Competitive Analysis
- 11.1. Company Profiles
- 11.1.1 Matrox Imaging Ltd
- 11.1.1.1. Company Overview
- 11.1.1.2. Products
- 11.1.1.3. Company Financials
- 11.1.1.4. SWOT Analysis
- 11.1.2 Keyence Corporation
- 11.1.2.1. Company Overview
- 11.1.2.2. Products
- 11.1.2.3. Company Financials
- 11.1.2.4. SWOT Analysis
- 11.1.3 Shenzhen Sipotek Technology Co Ltd
- 11.1.3.1. Company Overview
- 11.1.3.2. Products
- 11.1.3.3. Company Financials
- 11.1.3.4. SWOT Analysis
- 11.1.4 Isra Vision AG
- 11.1.4.1. Company Overview
- 11.1.4.2. Products
- 11.1.4.3. Company Financials
- 11.1.4.4. SWOT Analysis
- 11.1.5 Cognex Corporation
- 11.1.5.1. Company Overview
- 11.1.5.2. Products
- 11.1.5.3. Company Financials
- 11.1.5.4. SWOT Analysis
- 11.1.6 Stemmer Imaging AG
- 11.1.6.1. Company Overview
- 11.1.6.2. Products
- 11.1.6.3. Company Financials
- 11.1.6.4. SWOT Analysis
- 11.1.7 AMETEK Surface Vision
- 11.1.7.1. Company Overview
- 11.1.7.2. Products
- 11.1.7.3. Company Financials
- 11.1.7.4. SWOT Analysis
- 11.1.8 Omron Corporation
- 11.1.8.1. Company Overview
- 11.1.8.2. Products
- 11.1.8.3. Company Financials
- 11.1.8.4. SWOT Analysis
- 11.1.9 Comvis AG*List Not Exhaustive
- 11.1.9.1. Company Overview
- 11.1.9.2. Products
- 11.1.9.3. Company Financials
- 11.1.9.4. SWOT Analysis
- 11.1.10 Daitron Inc
- 11.1.10.1. Company Overview
- 11.1.10.2. Products
- 11.1.10.3. Company Financials
- 11.1.10.4. SWOT Analysis
- 11.1.11 Flexfilm Ltd
- 11.1.11.1. Company Overview
- 11.1.11.2. Products
- 11.1.11.3. Company Financials
- 11.1.11.4. SWOT Analysis
- 11.1.12 Edmund Scientific Corporation
- 11.1.12.1. Company Overview
- 11.1.12.2. Products
- 11.1.12.3. Company Financials
- 11.1.12.4. SWOT Analysis
- 11.1.13 Panasonic Corporation
- 11.1.13.1. Company Overview
- 11.1.13.2. Products
- 11.1.13.3. Company Financials
- 11.1.13.4. SWOT Analysis
- 11.1.1 Matrox Imaging Ltd
- 11.2. Market Entropy
- 11.2.1 Company's Key Areas Served
- 11.2.2 Recent Developments
- 11.3. Company Market Share Analysis 2025
- 11.3.1 Top 5 Companies Market Share Analysis
- 11.3.2 Top 3 Companies Market Share Analysis
- 11.4. List of Potential Customers
- 12. Research Methodology
List of Figures
- Figure 1: Global Surface Vision & Inspection Equipment Industry Revenue Breakdown (billion, %) by Region 2025 & 2033
- Figure 2: North America Surface Vision & Inspection Equipment Industry Revenue (billion), by Component 2025 & 2033
- Figure 3: North America Surface Vision & Inspection Equipment Industry Revenue Share (%), by Component 2025 & 2033
- Figure 4: North America Surface Vision & Inspection Equipment Industry Revenue (billion), by Application 2025 & 2033
- Figure 5: North America Surface Vision & Inspection Equipment Industry Revenue Share (%), by Application 2025 & 2033
- Figure 6: North America Surface Vision & Inspection Equipment Industry Revenue (billion), by Country 2025 & 2033
- Figure 7: North America Surface Vision & Inspection Equipment Industry Revenue Share (%), by Country 2025 & 2033
- Figure 8: Europe Surface Vision & Inspection Equipment Industry Revenue (billion), by Component 2025 & 2033
- Figure 9: Europe Surface Vision & Inspection Equipment Industry Revenue Share (%), by Component 2025 & 2033
- Figure 10: Europe Surface Vision & Inspection Equipment Industry Revenue (billion), by Application 2025 & 2033
- Figure 11: Europe Surface Vision & Inspection Equipment Industry Revenue Share (%), by Application 2025 & 2033
- Figure 12: Europe Surface Vision & Inspection Equipment Industry Revenue (billion), by Country 2025 & 2033
- Figure 13: Europe Surface Vision & Inspection Equipment Industry Revenue Share (%), by Country 2025 & 2033
- Figure 14: Asia Pacific Surface Vision & Inspection Equipment Industry Revenue (billion), by Component 2025 & 2033
- Figure 15: Asia Pacific Surface Vision & Inspection Equipment Industry Revenue Share (%), by Component 2025 & 2033
- Figure 16: Asia Pacific Surface Vision & Inspection Equipment Industry Revenue (billion), by Application 2025 & 2033
- Figure 17: Asia Pacific Surface Vision & Inspection Equipment Industry Revenue Share (%), by Application 2025 & 2033
- Figure 18: Asia Pacific Surface Vision & Inspection Equipment Industry Revenue (billion), by Country 2025 & 2033
- Figure 19: Asia Pacific Surface Vision & Inspection Equipment Industry Revenue Share (%), by Country 2025 & 2033
- Figure 20: Rest of the World Surface Vision & Inspection Equipment Industry Revenue (billion), by Component 2025 & 2033
- Figure 21: Rest of the World Surface Vision & Inspection Equipment Industry Revenue Share (%), by Component 2025 & 2033
- Figure 22: Rest of the World Surface Vision & Inspection Equipment Industry Revenue (billion), by Application 2025 & 2033
- Figure 23: Rest of the World Surface Vision & Inspection Equipment Industry Revenue Share (%), by Application 2025 & 2033
- Figure 24: Rest of the World Surface Vision & Inspection Equipment Industry Revenue (billion), by Country 2025 & 2033
- Figure 25: Rest of the World Surface Vision & Inspection Equipment Industry Revenue Share (%), by Country 2025 & 2033
List of Tables
- Table 1: Global Surface Vision & Inspection Equipment Industry Revenue billion Forecast, by Component 2020 & 2033
- Table 2: Global Surface Vision & Inspection Equipment Industry Revenue billion Forecast, by Application 2020 & 2033
- Table 3: Global Surface Vision & Inspection Equipment Industry Revenue billion Forecast, by Region 2020 & 2033
- Table 4: Global Surface Vision & Inspection Equipment Industry Revenue billion Forecast, by Component 2020 & 2033
- Table 5: Global Surface Vision & Inspection Equipment Industry Revenue billion Forecast, by Application 2020 & 2033
- Table 6: Global Surface Vision & Inspection Equipment Industry Revenue billion Forecast, by Country 2020 & 2033
- Table 7: Global Surface Vision & Inspection Equipment Industry Revenue billion Forecast, by Component 2020 & 2033
- Table 8: Global Surface Vision & Inspection Equipment Industry Revenue billion Forecast, by Application 2020 & 2033
- Table 9: Global Surface Vision & Inspection Equipment Industry Revenue billion Forecast, by Country 2020 & 2033
- Table 10: Global Surface Vision & Inspection Equipment Industry Revenue billion Forecast, by Component 2020 & 2033
- Table 11: Global Surface Vision & Inspection Equipment Industry Revenue billion Forecast, by Application 2020 & 2033
- Table 12: Global Surface Vision & Inspection Equipment Industry Revenue billion Forecast, by Country 2020 & 2033
- Table 13: Global Surface Vision & Inspection Equipment Industry Revenue billion Forecast, by Component 2020 & 2033
- Table 14: Global Surface Vision & Inspection Equipment Industry Revenue billion Forecast, by Application 2020 & 2033
- Table 15: Global Surface Vision & Inspection Equipment Industry Revenue billion Forecast, by Country 2020 & 2033
Frequently Asked Questions
1. What is the projected Compound Annual Growth Rate (CAGR) of the Surface Vision & Inspection Equipment Industry?
The projected CAGR is approximately 14.56%.
2. Which companies are prominent players in the Surface Vision & Inspection Equipment Industry?
Key companies in the market include Matrox Imaging Ltd, Keyence Corporation, Shenzhen Sipotek Technology Co Ltd, Isra Vision AG, Cognex Corporation, Stemmer Imaging AG, AMETEK Surface Vision, Omron Corporation, Comvis AG*List Not Exhaustive, Daitron Inc, Flexfilm Ltd, Edmund Scientific Corporation, Panasonic Corporation.
3. What are the main segments of the Surface Vision & Inspection Equipment Industry?
The market segments include Component, Application.
4. Can you provide details about the market size?
The market size is estimated to be USD 14.86 billion as of 2022.
5. What are some drivers contributing to market growth?
; Increasing Need for Better Manufacturing Production Capacity at Reduced Cost; Growing Demand for Qualitative Products; Increasing Adoption of Industrial 4.0 and IoT.
6. What are the notable trends driving market growth?
Camera Segment is expected to Hold the Largest Market Size during the Forecast Period.
7. Are there any restraints impacting market growth?
; Lack of Skilled Labor.
8. Can you provide examples of recent developments in the market?
N/A
9. What pricing options are available for accessing the report?
Pricing options include single-user, multi-user, and enterprise licenses priced at USD 4750, USD 5250, and USD 8750 respectively.
10. Is the market size provided in terms of value or volume?
The market size is provided in terms of value, measured in billion.
11. Are there any specific market keywords associated with the report?
Yes, the market keyword associated with the report is "Surface Vision & Inspection Equipment Industry," which aids in identifying and referencing the specific market segment covered.
12. How do I determine which pricing option suits my needs best?
The pricing options vary based on user requirements and access needs. Individual users may opt for single-user licenses, while businesses requiring broader access may choose multi-user or enterprise licenses for cost-effective access to the report.
13. Are there any additional resources or data provided in the Surface Vision & Inspection Equipment Industry report?
While the report offers comprehensive insights, it's advisable to review the specific contents or supplementary materials provided to ascertain if additional resources or data are available.
14. How can I stay updated on further developments or reports in the Surface Vision & Inspection Equipment Industry?
To stay informed about further developments, trends, and reports in the Surface Vision & Inspection Equipment Industry, consider subscribing to industry newsletters, following relevant companies and organizations, or regularly checking reputable industry news sources and publications.
Methodology
Step 1 - Identification of Relevant Samples Size from Population Database


Step 2 - Approaches for Defining Global Market Size (Value, Volume* & Price*)

Note*: In applicable scenarios
Step 3 - Data Sources
Primary Research
- Web Analytics
- Survey Reports
- Research Institute
- Latest Research Reports
- Opinion Leaders
Secondary Research
- Annual Reports
- White Paper
- Latest Press Release
- Industry Association
- Paid Database
- Investor Presentations

Step 4 - Data Triangulation
Involves using different sources of information in order to increase the validity of a study
These sources are likely to be stakeholders in a program - participants, other researchers, program staff, other community members, and so on.
Then we put all data in single framework & apply various statistical tools to find out the dynamic on the market.
During the analysis stage, feedback from the stakeholder groups would be compared to determine areas of agreement as well as areas of divergence