

Key Insights
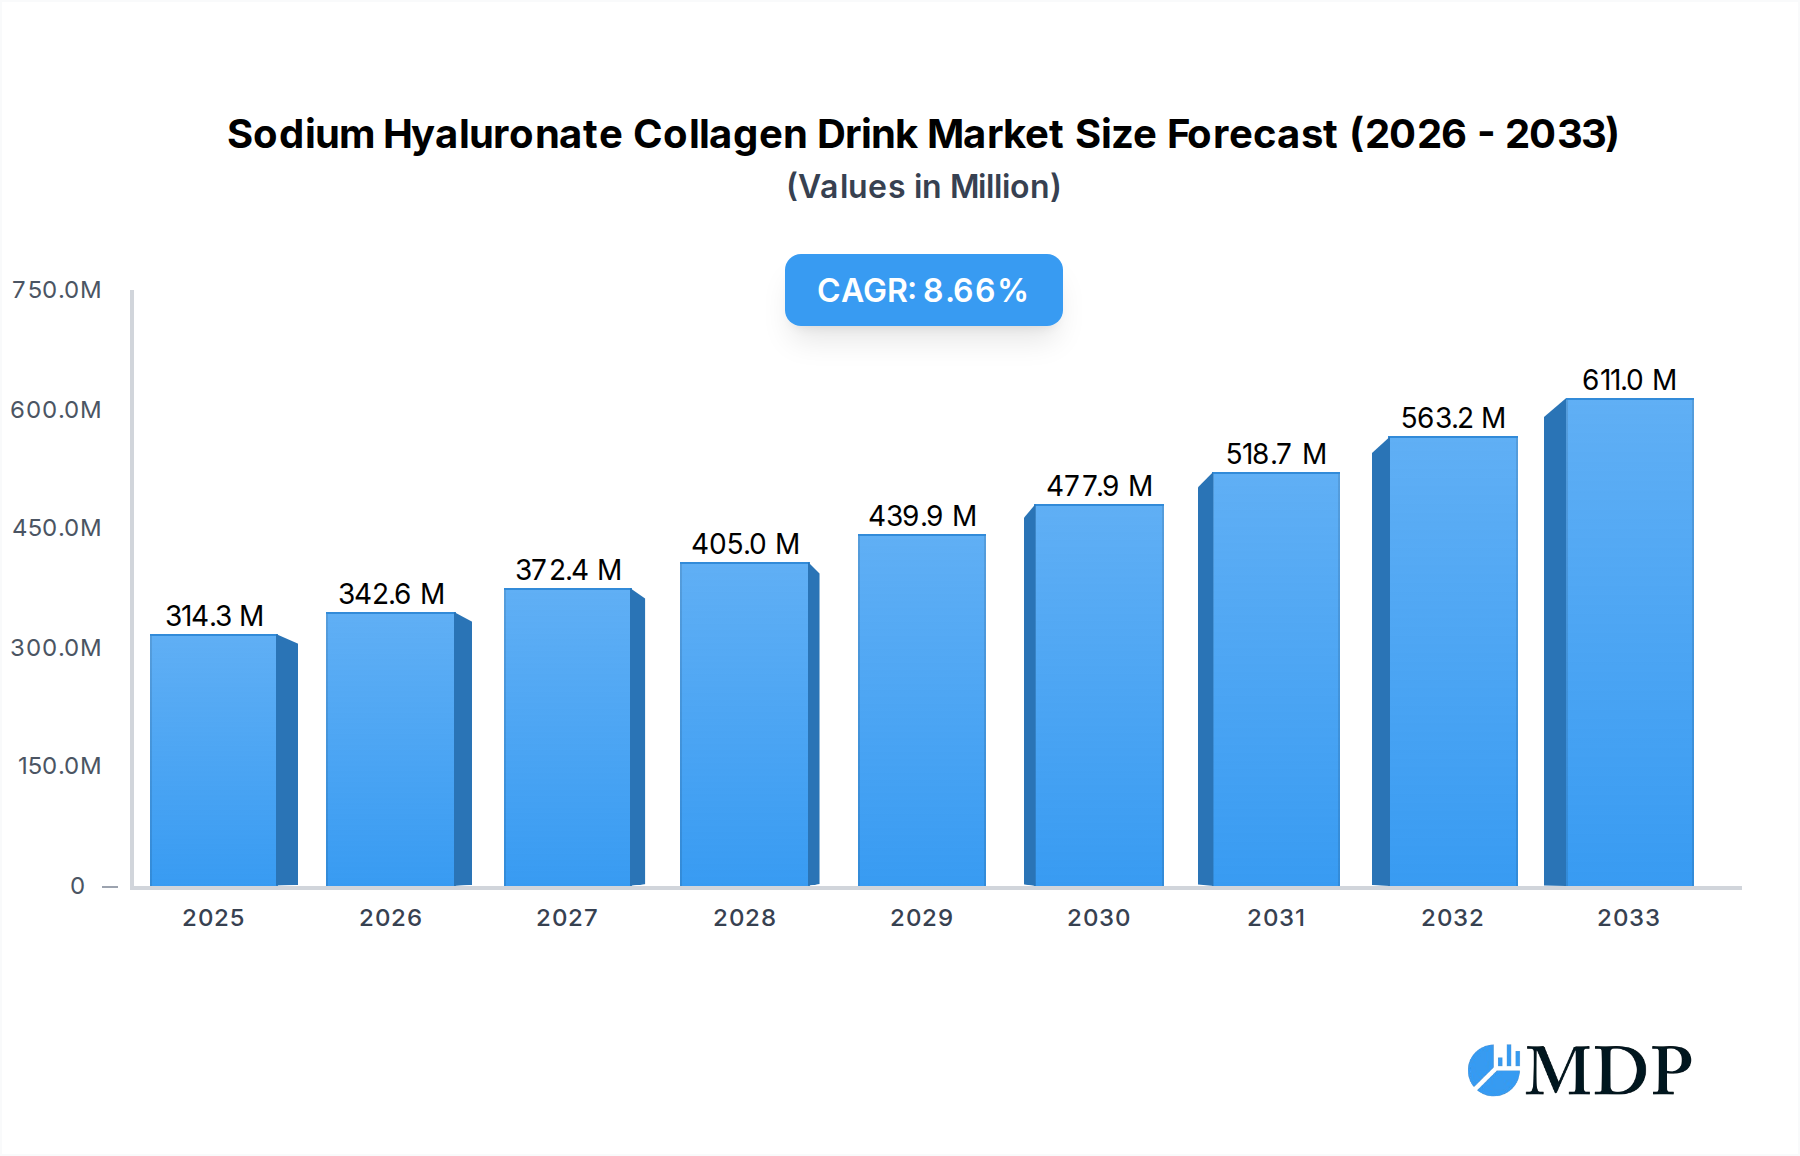
The global Sodium Hyaluronate Collagen Drink market is poised for significant expansion, projected to reach USD 314.3 million by 2025. This growth is fueled by an anticipated Compound Annual Growth Rate (CAGR) of 9% over the forecast period. The increasing consumer awareness surrounding the synergistic benefits of hyaluronic acid and collagen for skin health, joint lubrication, and overall wellness is a primary driver. As individuals prioritize preventative healthcare and seek ingestible beauty solutions, demand for these functional beverages is escalating. The market is also benefiting from advancements in formulation and ingredient sourcing, leading to more palatable and effective products. The growing prevalence of an aging global population, alongside a rising disposable income in emerging economies, further bolsters market prospects as consumers invest in products that promote longevity and vitality.
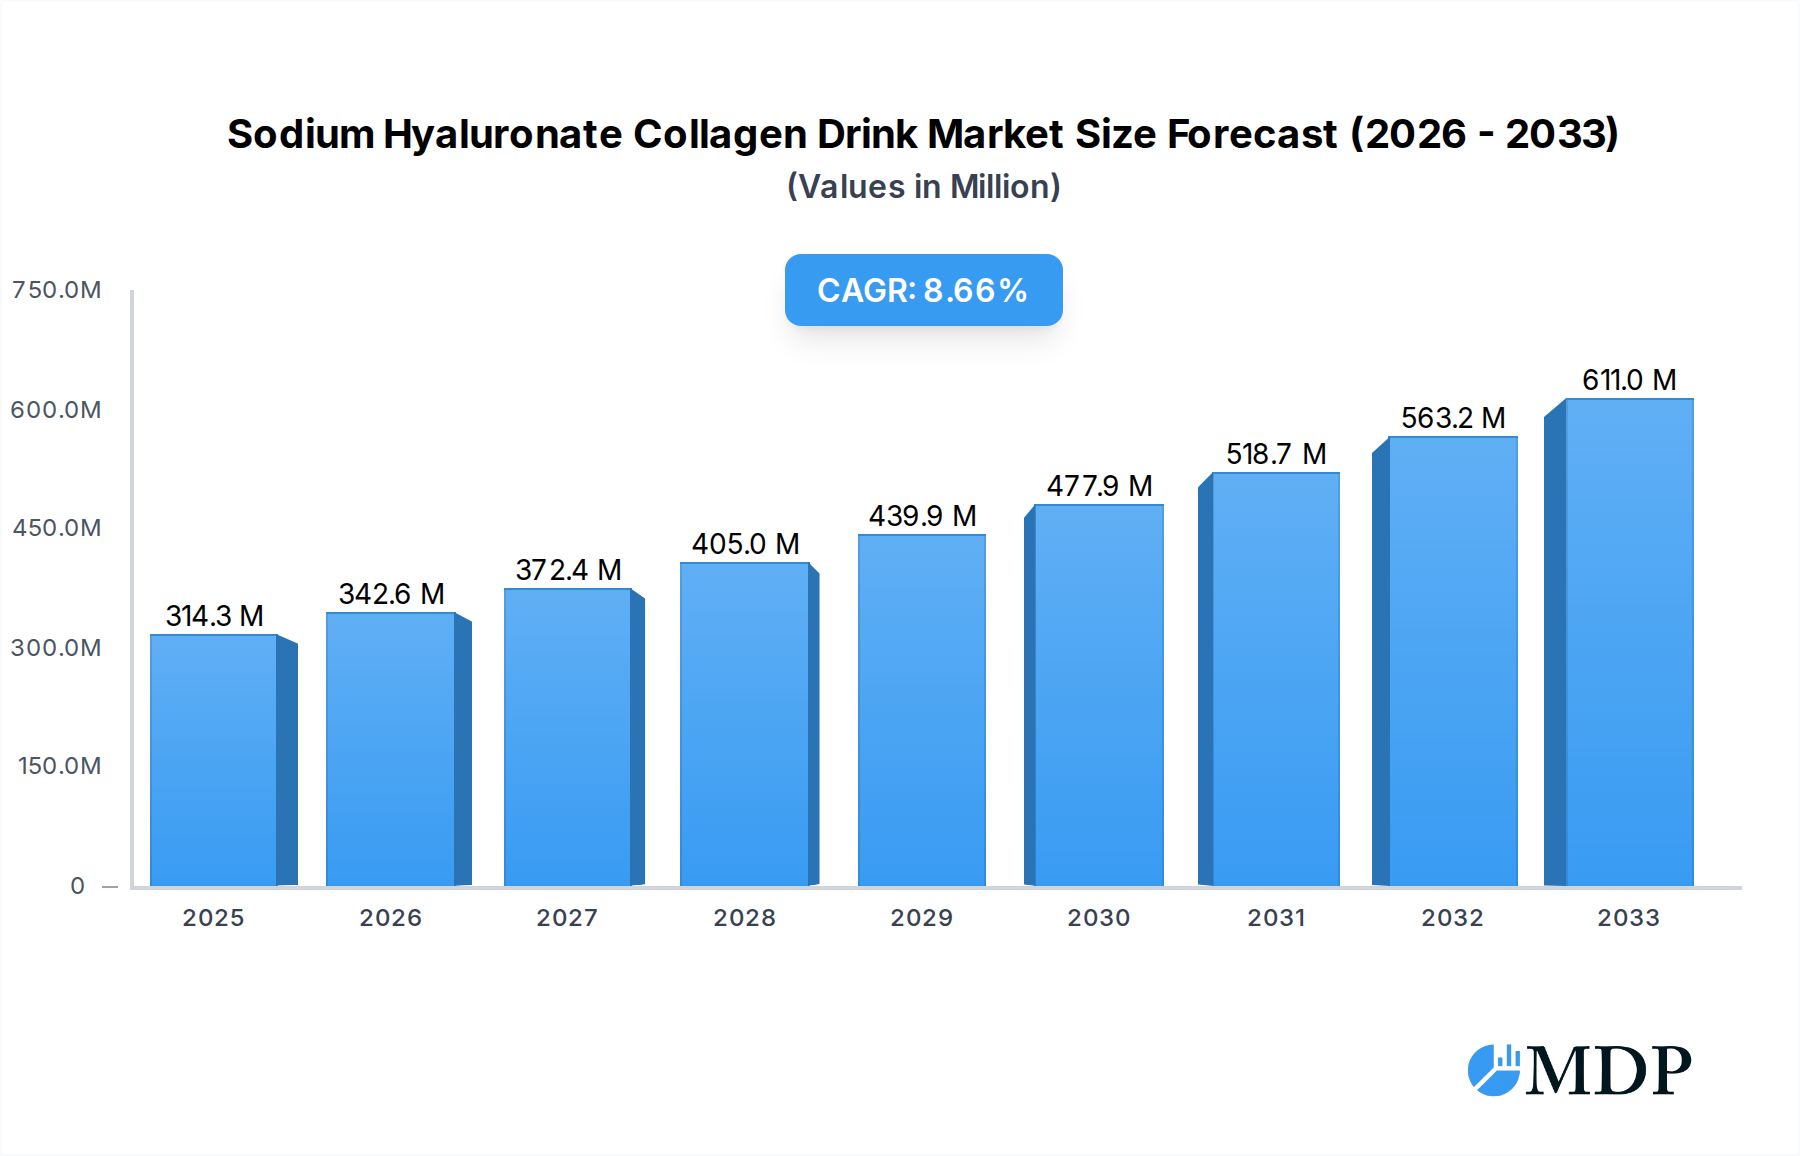
Sodium Hyaluronate Collagen Drink Market Size (In Million)

The market segmentation reveals a strong presence in the Personal Use application, driven by individual consumer purchasing for health and beauty enhancement. However, the Commercial Use segment, encompassing applications in spas, wellness centers, and as part of specialized dietary plans, is expected to witness robust growth. By type, the 30 mL and 50 mL pack sizes are likely to dominate due to their convenience and single-serving appeal, catering to busy lifestyles. Geographically, the Asia Pacific region, particularly China and India, is emerging as a key growth engine, attributed to a burgeoning middle class, increasing health consciousness, and a strong cultural appreciation for skincare and anti-aging solutions. North America and Europe remain mature yet substantial markets, driven by established wellness trends and a high adoption rate of functional beverages. Emerging trends such as the integration of additional beneficial ingredients like vitamins and antioxidants, and the development of specialized formulations for specific concerns like joint health, are expected to shape the market landscape.
Sodium Hyaluronate Collagen Drink Company Market Share
Unveiling the Future: Sodium Hyaluronate Collagen Drink Market Analysis (2019–2033)
This comprehensive report delves into the dynamic global market for Sodium Hyaluronate Collagen Drinks, a rapidly evolving sector driven by increasing consumer demand for ingestible beauty and wellness solutions. Our in-depth analysis covers the historical performance (2019–2024), current market landscape (2025), and future projections (2025–2033), offering invaluable insights for industry stakeholders. The report is meticulously structured to provide actionable intelligence, identifying key growth drivers, emerging trends, competitive strategies, and potential challenges within this high-growth industry. With a focus on advanced analytics and granular segment breakdown, this report is your definitive guide to navigating and capitalizing on the burgeoning Sodium Hyaluronate Collagen Drink market.
Sodium Hyaluronate Collagen Drink Market Dynamics & Concentration
The Sodium Hyaluronate Collagen Drink market is characterized by a moderate to high concentration, with a few key players holding significant market share, estimated at XX million USD in the base year 2025. Innovation is a primary driver, fueled by continuous research and development into enhanced formulations, bioavailability, and novel delivery mechanisms. Regulatory frameworks, particularly concerning health claims and ingredient safety, play a crucial role in shaping market access and product development. The market is influenced by the availability of product substitutes, such as topical collagen and hyaluronic acid treatments, and the growing consumer preference for convenient, ingestible solutions.
- Market Concentration: Dominated by established nutraceutical and cosmetic ingredient manufacturers. Key players include Bloomage Biotechnology and Hunan Jingfeng Pharmaceutical, collectively holding an estimated XX% market share.
- Innovation Drivers: Focus on increasing collagen absorption, synergistic ingredient combinations (e.g., vitamins, antioxidants), and pleasant taste profiles.
- Regulatory Frameworks: Stringent regulations around health claims and ingredient sourcing in major markets like North America and Europe. Compliance with regional food and supplement guidelines is paramount.
- Product Substitutes: Topical skincare products offering collagen and hyaluronic acid benefits, as well as other ingestible supplements like marine collagen peptides and vitamin C supplements.
- End-User Trends: Growing consumer interest in anti-aging, skin hydration, joint health, and overall wellness. Demand for natural and clean-label products is on the rise.
- M&A Activities: A limited number of strategic acquisitions and partnerships aimed at expanding product portfolios, market reach, and technological capabilities. The estimated number of M&A deals in the historical period (2019-2024) stands at XX.
Sodium Hyaluronate Collagen Drink Industry Trends & Analysis
The Sodium Hyaluronate Collagen Drink industry is poised for significant expansion, driven by a confluence of powerful market growth drivers, technological disruptions, evolving consumer preferences, and intensifying competitive dynamics. The projected Compound Annual Growth Rate (CAGR) for the forecast period (2025–2033) is estimated at a robust XX%, indicating a strong upward trajectory. Market penetration, currently at XX%, is expected to surge as consumer awareness and product accessibility increase globally. Technological advancements are central to this growth, with ongoing research focusing on improving the efficacy and absorption of both hyaluronic acid and collagen. This includes exploring various molecular weights of hyaluronic acid and different forms of collagen peptides, such as hydrolyzed collagen and marine collagen, to optimize their benefits.
Consumer preferences are a pivotal force shaping product development and marketing strategies. There is a discernible shift towards holistic wellness, where beauty is perceived as an inside-out process. Consumers are actively seeking convenient, palatable, and scientifically backed solutions for maintaining youthful skin, healthy joints, and overall vitality. This demand is translating into a preference for ready-to-drink formats that fit seamlessly into busy lifestyles. The rise of the "beauty-from-within" trend, supported by endorsements from influencers and positive testimonials, further fuels this market segment.
Competitive dynamics are becoming more pronounced as new entrants and established brands vie for market share. Companies are differentiating themselves through ingredient quality, scientific validation, branding, and distribution strategies. The market is witnessing increased investment in marketing and education to inform consumers about the benefits of Sodium Hyaluronate Collagen Drinks. Furthermore, the integration of smart packaging and personalized nutrition concepts could represent future competitive advantages. The overall market size in the base year 2025 is estimated at XX million USD.
Leading Markets & Segments in Sodium Hyaluronate Collagen Drink
The Sodium Hyaluronate Collagen Drink market exhibits distinct regional and segmental dominance, driven by a combination of economic policies, infrastructural development, and evolving consumer behaviors. Asia-Pacific, particularly China, is emerging as a dominant region due to its large population, increasing disposable income, and a deeply ingrained culture of beauty and wellness. Within this region, countries like South Korea and Japan also represent significant markets, known for their pioneering role in ingestible beauty products. North America and Europe follow closely, driven by a growing awareness of anti-aging solutions and the increasing availability of premium, science-backed formulations.
The Personal Use segment is overwhelmingly dominant, accounting for an estimated XX% of the total market share in 2025. This is attributed to the direct-to-consumer appeal, focusing on individual beauty and wellness goals. Consumers are increasingly investing in these drinks as part of their daily skincare and health routines, seeking tangible benefits like improved skin hydration, elasticity, and reduced appearance of fine lines and wrinkles. The convenience and perceived efficacy of ingestible formats align perfectly with modern lifestyles, making them a preferred choice over topical applications for many.
Within the Type segment, the 30 mL and 50 mL formats are the most popular due to their portability and convenient single-serving nature. These sizes are ideal for on-the-go consumption and allow consumers to easily integrate the drink into their daily routines. The Others category, which includes larger multi-serving bottles or sachets, holds a smaller but growing share, catering to household consumption or those seeking bulk purchase options.
- Dominant Region: Asia-Pacific, driven by strong demand in China, South Korea, and Japan.
- Dominant Country: China, with a rapidly expanding middle class and a high propensity for beauty and wellness spending.
- Dominant Segment (Application): Personal Use, reflecting the focus on individual anti-aging and skin health benefits.
- Key Drivers for Personal Use Dominance:
- Growing consumer investment in preventative aging solutions.
- Demand for convenient and effective beauty supplements.
- Influence of social media and beauty trends promoting internal wellness.
- Perceived higher bioavailability and efficacy of ingestible forms.
- Key Drivers for Personal Use Dominance:
- Dominant Segment (Type): 30 mL and 50 mL, offering optimal portability and single-serving convenience.
- Key Drivers for 30 mL/50 mL Dominance:
- Ease of consumption anytime, anywhere.
- Portion control and product freshness.
- Ideal for travel and busy schedules.
- Lower initial purchase barrier for new consumers.
- Key Drivers for 30 mL/50 mL Dominance:
Sodium Hyaluronate Collagen Drink Product Developments
Product innovation in the Sodium Hyaluronate Collagen Drink sector is characterized by a focus on enhanced efficacy, synergistic ingredient profiles, and appealing sensory experiences. Manufacturers are investing heavily in research to optimize the absorption rates of both collagen peptides and hyaluronic acid, utilizing advanced processing techniques and exploring different molecular weights. The inclusion of complementary ingredients such as vitamins (e.g., Vitamin C, Biotin), antioxidants, and other peptides is a key trend, aiming to deliver comprehensive skin and joint health benefits. These formulations often emphasize natural sourcing and clean-label claims to cater to health-conscious consumers. Competitive advantages are being forged through scientifically validated claims, appealing flavor profiles, and user-friendly packaging solutions, ensuring market fit and consumer satisfaction.
Key Drivers of Sodium Hyaluronate Collagen Drink Growth
The growth of the Sodium Hyaluronate Collagen Drink market is propelled by several interconnected factors. The escalating global demand for anti-aging solutions and preventative healthcare is a primary driver, with consumers increasingly investing in products that promote youthful skin and joint health. Technological advancements in formulation science and ingredient bioavailability are enhancing product efficacy, leading to greater consumer trust and adoption. Furthermore, the growing awareness among consumers about the benefits of "beauty from within" and the convenience of ingestible supplements are significantly contributing to market expansion. Favorable regulatory environments in key markets, supporting health claims and product approvals, also act as catalysts for growth.
Challenges in the Sodium Hyaluronate Collagen Drink Market
Despite the promising growth trajectory, the Sodium Hyaluronate Collagen Drink market faces several challenges. Regulatory hurdles related to health claims and ingredient approvals in certain regions can impede market entry and product promotion, leading to potential delays and increased compliance costs. The competitive landscape is intensifying, with numerous established and emerging players vying for market share, which can exert downward pressure on pricing. Ensuring a consistent and high-quality supply chain for raw materials like collagen peptides and hyaluronic acid can also be a concern, potentially impacting production costs and availability. Consumer education remains crucial to differentiate scientifically backed products from less effective alternatives.
Emerging Opportunities in Sodium Hyaluronate Collagen Drink
Emerging opportunities in the Sodium Hyaluronate Collagen Drink market are ripe for exploration. Technological breakthroughs in encapsulation and delivery systems offer potential for significantly improved absorption rates and targeted nutrient delivery. Strategic partnerships between ingredient manufacturers and finished product brands can accelerate innovation and market penetration. Expansion into untapped geographical markets, particularly in developing economies with a rising middle class and increasing disposable income, presents substantial growth potential. The development of personalized nutrition solutions, tailored to individual needs and genetic profiles, represents a long-term growth catalyst. Furthermore, the integration of sustainable sourcing and eco-friendly packaging practices can enhance brand appeal and capture a growing segment of environmentally conscious consumers.
Leading Players in the Sodium Hyaluronate Collagen Drink Sector
- Swisse
- Mary Kay
- Hunan Jingfeng Pharmaceutical
- Bloomage Biotechnology
- Beijing Konruns Pharmaceutical
- Eyoson Group
- Guangdong Saimei Group
- Topscience Biotech
- Shangdong Kangmei Pharmaceutical
Key Milestones in Sodium Hyaluronate Collagen Drink Industry
- 2019: Increased consumer awareness and early adoption of ingestible beauty supplements.
- 2020: Growth in online retail channels facilitating broader product accessibility.
- 2021: Introduction of novel formulations with enhanced bioavailability and synergistic ingredients.
- 2022: Rise of influencer marketing and social media campaigns significantly boosting product visibility.
- 2023: Expansion of product offerings to include vegan and plant-based collagen alternatives.
- 2024: Greater emphasis on clinical studies and scientific validation of product claims.
Strategic Outlook for Sodium Hyaluronate Collagen Drink Market
The strategic outlook for the Sodium Hyaluronate Collagen Drink market is exceptionally bright, driven by an accelerating global trend towards holistic wellness and ingestible beauty solutions. Future growth will be significantly influenced by continued innovation in formulation technology, focusing on enhanced bioavailability and multi-functional benefits. Companies that prioritize scientifically validated products, transparent ingredient sourcing, and appealing consumer experiences are well-positioned for success. Strategic collaborations, market expansion into emerging economies, and the development of personalized nutrition options will further amplify market potential. The emphasis on clean labels, sustainability, and convenient formats will remain critical for capturing and retaining consumer loyalty in this dynamic and expanding sector.
Sodium Hyaluronate Collagen Drink Segmentation
-
1. Application
- 1.1. Personal Use
- 1.2. Commercial Use
-
2. Type
- 2.1. 30 mL
- 2.2. 50 mL
- 2.3. Others
Sodium Hyaluronate Collagen Drink Segmentation By Geography
-
1. North America
- 1.1. United States
- 1.2. Canada
- 1.3. Mexico
-
2. South America
- 2.1. Brazil
- 2.2. Argentina
- 2.3. Rest of South America
-
3. Europe
- 3.1. United Kingdom
- 3.2. Germany
- 3.3. France
- 3.4. Italy
- 3.5. Spain
- 3.6. Russia
- 3.7. Benelux
- 3.8. Nordics
- 3.9. Rest of Europe
-
4. Middle East & Africa
- 4.1. Turkey
- 4.2. Israel
- 4.3. GCC
- 4.4. North Africa
- 4.5. South Africa
- 4.6. Rest of Middle East & Africa
-
5. Asia Pacific
- 5.1. China
- 5.2. India
- 5.3. Japan
- 5.4. South Korea
- 5.5. ASEAN
- 5.6. Oceania
- 5.7. Rest of Asia Pacific
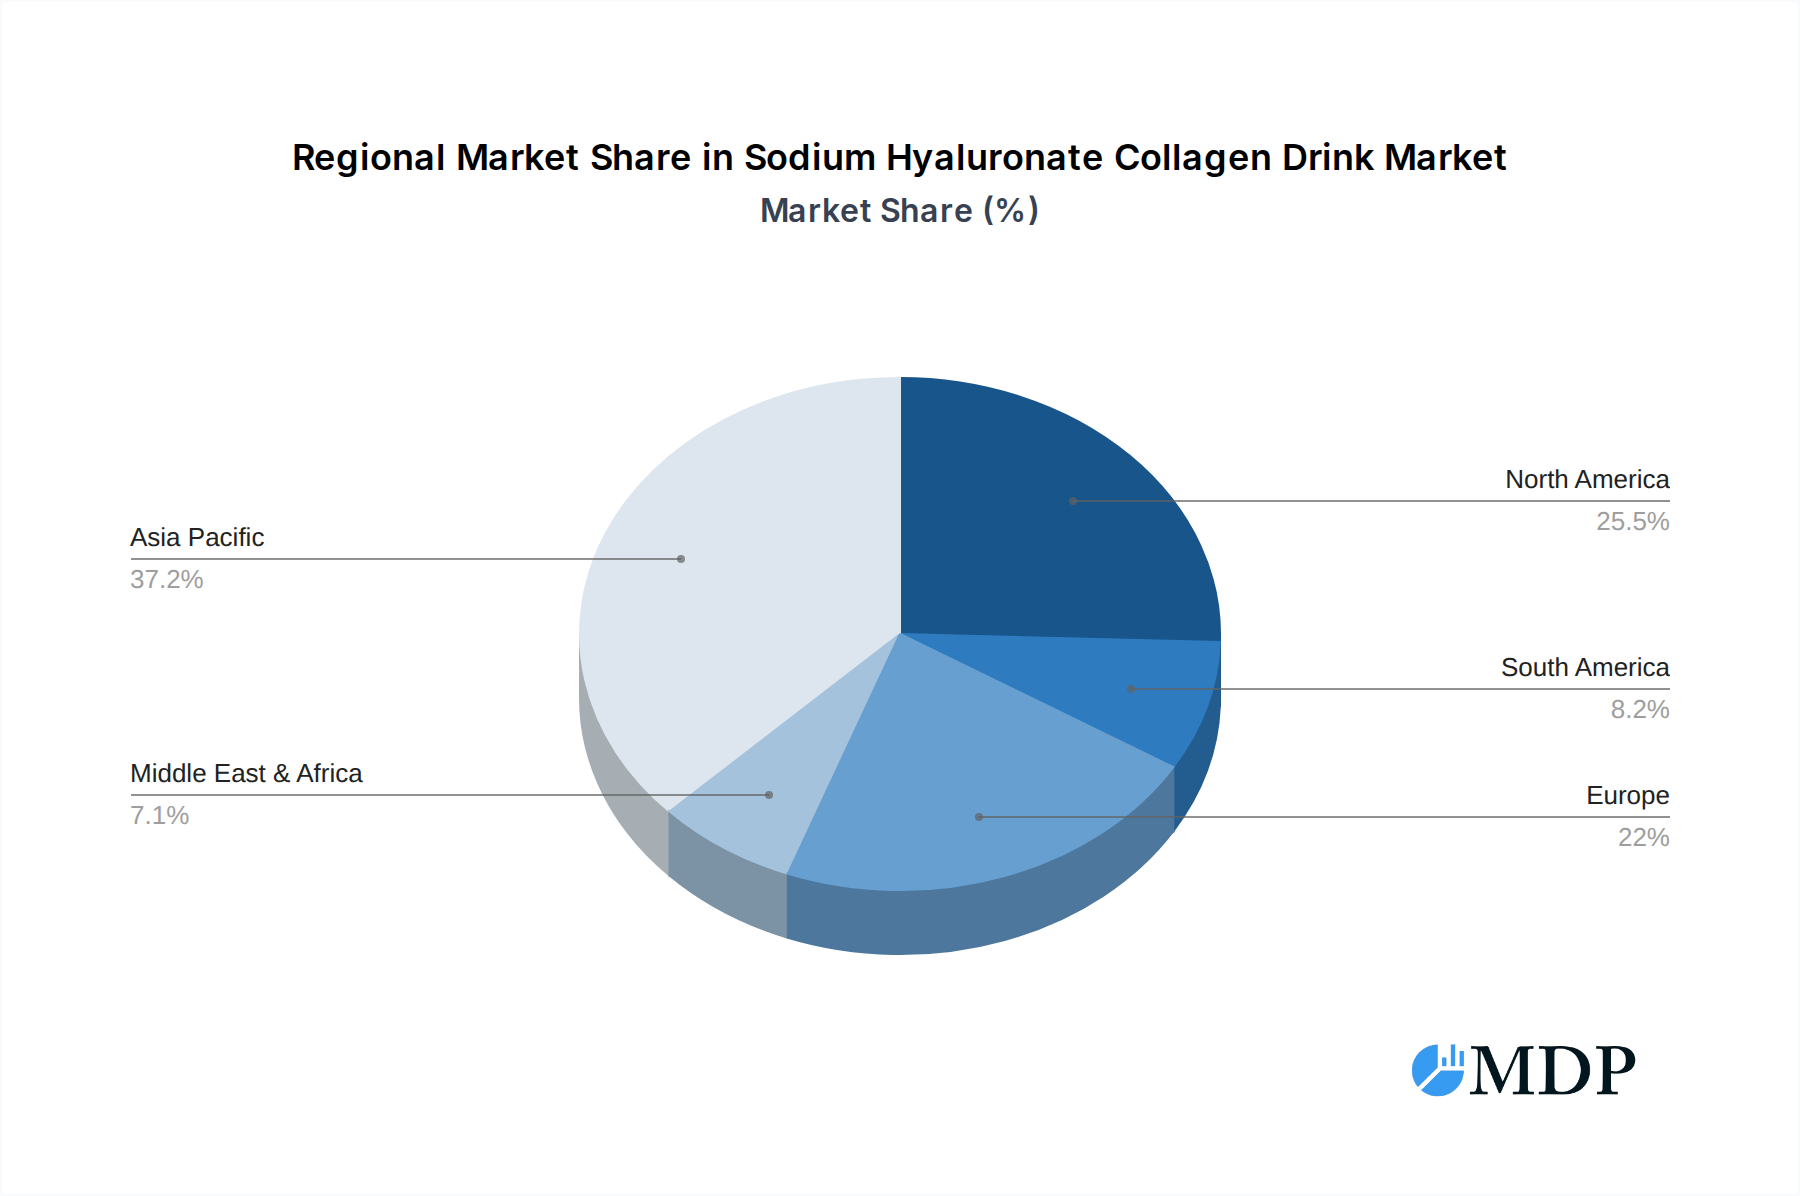
Sodium Hyaluronate Collagen Drink Regional Market Share
Geographic Coverage of Sodium Hyaluronate Collagen Drink
Sodium Hyaluronate Collagen Drink REPORT HIGHLIGHTS
| Aspects | Details |
|---|---|
| Study Period | 2020-2034 |
| Base Year | 2025 |
| Estimated Year | 2026 |
| Forecast Period | 2026-2034 |
| Historical Period | 2020-2025 |
| Growth Rate | CAGR of 12.3% from 2020-2034 |
| Segmentation |
|
Table of Contents
- 1. Introduction
- 1.1. Research Scope
- 1.2. Market Segmentation
- 1.3. Research Objective
- 1.4. Definitions and Assumptions
- 2. Executive Summary
- 2.1. Market Snapshot
- 3. Market Dynamics
- 3.1. Market Drivers
- 3.2. Market Restrains
- 3.3. Market Trends
- 3.4. Market Opportunities
- 4. Market Factor Analysis
- 4.1. Porters Five Forces
- 4.1.1. Bargaining Power of Suppliers
- 4.1.2. Bargaining Power of Buyers
- 4.1.3. Threat of New Entrants
- 4.1.4. Threat of Substitutes
- 4.1.5. Competitive Rivalry
- 4.2. PESTEL analysis
- 4.3. BCG Analysis
- 4.3.1. Stars (High Growth, High Market Share)
- 4.3.2. Cash Cows (Low Growth, High Market Share)
- 4.3.3. Question Mark (High Growth, Low Market Share)
- 4.3.4. Dogs (Low Growth, Low Market Share)
- 4.4. Ansoff Matrix Analysis
- 4.5. Supply Chain Analysis
- 4.6. Regulatory Landscape
- 4.7. Current Market Potential and Opportunity Assessment (TAM–SAM–SOM Framework)
- 4.8. MDP Analyst Note
- 4.1. Porters Five Forces
- 5. Market Analysis, Insights and Forecast 2021-2033
- 5.1. Market Analysis, Insights and Forecast - by Application
- 5.1.1. Personal Use
- 5.1.2. Commercial Use
- 5.2. Market Analysis, Insights and Forecast - by Type
- 5.2.1. 30 mL
- 5.2.2. 50 mL
- 5.2.3. Others
- 5.3. Market Analysis, Insights and Forecast - by Region
- 5.3.1. North America
- 5.3.2. South America
- 5.3.3. Europe
- 5.3.4. Middle East & Africa
- 5.3.5. Asia Pacific
- 5.1. Market Analysis, Insights and Forecast - by Application
- 6. Global Sodium Hyaluronate Collagen Drink Analysis, Insights and Forecast, 2021-2033
- 6.1. Market Analysis, Insights and Forecast - by Application
- 6.1.1. Personal Use
- 6.1.2. Commercial Use
- 6.2. Market Analysis, Insights and Forecast - by Type
- 6.2.1. 30 mL
- 6.2.2. 50 mL
- 6.2.3. Others
- 6.1. Market Analysis, Insights and Forecast - by Application
- 7. North America Sodium Hyaluronate Collagen Drink Analysis, Insights and Forecast, 2020-2032
- 7.1. Market Analysis, Insights and Forecast - by Application
- 7.1.1. Personal Use
- 7.1.2. Commercial Use
- 7.2. Market Analysis, Insights and Forecast - by Type
- 7.2.1. 30 mL
- 7.2.2. 50 mL
- 7.2.3. Others
- 7.1. Market Analysis, Insights and Forecast - by Application
- 8. South America Sodium Hyaluronate Collagen Drink Analysis, Insights and Forecast, 2020-2032
- 8.1. Market Analysis, Insights and Forecast - by Application
- 8.1.1. Personal Use
- 8.1.2. Commercial Use
- 8.2. Market Analysis, Insights and Forecast - by Type
- 8.2.1. 30 mL
- 8.2.2. 50 mL
- 8.2.3. Others
- 8.1. Market Analysis, Insights and Forecast - by Application
- 9. Europe Sodium Hyaluronate Collagen Drink Analysis, Insights and Forecast, 2020-2032
- 9.1. Market Analysis, Insights and Forecast - by Application
- 9.1.1. Personal Use
- 9.1.2. Commercial Use
- 9.2. Market Analysis, Insights and Forecast - by Type
- 9.2.1. 30 mL
- 9.2.2. 50 mL
- 9.2.3. Others
- 9.1. Market Analysis, Insights and Forecast - by Application
- 10. Middle East & Africa Sodium Hyaluronate Collagen Drink Analysis, Insights and Forecast, 2020-2032
- 10.1. Market Analysis, Insights and Forecast - by Application
- 10.1.1. Personal Use
- 10.1.2. Commercial Use
- 10.2. Market Analysis, Insights and Forecast - by Type
- 10.2.1. 30 mL
- 10.2.2. 50 mL
- 10.2.3. Others
- 10.1. Market Analysis, Insights and Forecast - by Application
- 11. Asia Pacific Sodium Hyaluronate Collagen Drink Analysis, Insights and Forecast, 2020-2032
- 11.1. Market Analysis, Insights and Forecast - by Application
- 11.1.1. Personal Use
- 11.1.2. Commercial Use
- 11.2. Market Analysis, Insights and Forecast - by Type
- 11.2.1. 30 mL
- 11.2.2. 50 mL
- 11.2.3. Others
- 11.1. Market Analysis, Insights and Forecast - by Application
- 12. Competitive Analysis
- 12.1. Company Profiles
- 12.1.1 Swisse
- 12.1.1.1. Company Overview
- 12.1.1.2. Products
- 12.1.1.3. Company Financials
- 12.1.1.4. SWOT Analysis
- 12.1.2 Mary Kay
- 12.1.2.1. Company Overview
- 12.1.2.2. Products
- 12.1.2.3. Company Financials
- 12.1.2.4. SWOT Analysis
- 12.1.3 Hunan Jingfeng Pharmaceutical
- 12.1.3.1. Company Overview
- 12.1.3.2. Products
- 12.1.3.3. Company Financials
- 12.1.3.4. SWOT Analysis
- 12.1.4 Bloomage Biotechnology
- 12.1.4.1. Company Overview
- 12.1.4.2. Products
- 12.1.4.3. Company Financials
- 12.1.4.4. SWOT Analysis
- 12.1.5 Beijing Konruns Pharmaceutical
- 12.1.5.1. Company Overview
- 12.1.5.2. Products
- 12.1.5.3. Company Financials
- 12.1.5.4. SWOT Analysis
- 12.1.6 Eyoson Group
- 12.1.6.1. Company Overview
- 12.1.6.2. Products
- 12.1.6.3. Company Financials
- 12.1.6.4. SWOT Analysis
- 12.1.7 Guangdong Saimei Group
- 12.1.7.1. Company Overview
- 12.1.7.2. Products
- 12.1.7.3. Company Financials
- 12.1.7.4. SWOT Analysis
- 12.1.8 Topscience Biotech
- 12.1.8.1. Company Overview
- 12.1.8.2. Products
- 12.1.8.3. Company Financials
- 12.1.8.4. SWOT Analysis
- 12.1.9 Shangdong Kangmei Pharmaceutical
- 12.1.9.1. Company Overview
- 12.1.9.2. Products
- 12.1.9.3. Company Financials
- 12.1.9.4. SWOT Analysis
- 12.1.1 Swisse
- 12.2. Market Entropy
- 12.2.1 Company's Key Areas Served
- 12.2.2 Recent Developments
- 12.3. Company Market Share Analysis 2025
- 12.3.1 Top 5 Companies Market Share Analysis
- 12.3.2 Top 3 Companies Market Share Analysis
- 12.4. List of Potential Customers
- 13. Research Methodology
List of Figures
- Figure 1: Global Sodium Hyaluronate Collagen Drink Revenue Breakdown (million, %) by Region 2025 & 2033
- Figure 2: Global Sodium Hyaluronate Collagen Drink Volume Breakdown (K, %) by Region 2025 & 2033
- Figure 3: North America Sodium Hyaluronate Collagen Drink Revenue (million), by Application 2025 & 2033
- Figure 4: North America Sodium Hyaluronate Collagen Drink Volume (K), by Application 2025 & 2033
- Figure 5: North America Sodium Hyaluronate Collagen Drink Revenue Share (%), by Application 2025 & 2033
- Figure 6: North America Sodium Hyaluronate Collagen Drink Volume Share (%), by Application 2025 & 2033
- Figure 7: North America Sodium Hyaluronate Collagen Drink Revenue (million), by Type 2025 & 2033
- Figure 8: North America Sodium Hyaluronate Collagen Drink Volume (K), by Type 2025 & 2033
- Figure 9: North America Sodium Hyaluronate Collagen Drink Revenue Share (%), by Type 2025 & 2033
- Figure 10: North America Sodium Hyaluronate Collagen Drink Volume Share (%), by Type 2025 & 2033
- Figure 11: North America Sodium Hyaluronate Collagen Drink Revenue (million), by Country 2025 & 2033
- Figure 12: North America Sodium Hyaluronate Collagen Drink Volume (K), by Country 2025 & 2033
- Figure 13: North America Sodium Hyaluronate Collagen Drink Revenue Share (%), by Country 2025 & 2033
- Figure 14: North America Sodium Hyaluronate Collagen Drink Volume Share (%), by Country 2025 & 2033
- Figure 15: South America Sodium Hyaluronate Collagen Drink Revenue (million), by Application 2025 & 2033
- Figure 16: South America Sodium Hyaluronate Collagen Drink Volume (K), by Application 2025 & 2033
- Figure 17: South America Sodium Hyaluronate Collagen Drink Revenue Share (%), by Application 2025 & 2033
- Figure 18: South America Sodium Hyaluronate Collagen Drink Volume Share (%), by Application 2025 & 2033
- Figure 19: South America Sodium Hyaluronate Collagen Drink Revenue (million), by Type 2025 & 2033
- Figure 20: South America Sodium Hyaluronate Collagen Drink Volume (K), by Type 2025 & 2033
- Figure 21: South America Sodium Hyaluronate Collagen Drink Revenue Share (%), by Type 2025 & 2033
- Figure 22: South America Sodium Hyaluronate Collagen Drink Volume Share (%), by Type 2025 & 2033
- Figure 23: South America Sodium Hyaluronate Collagen Drink Revenue (million), by Country 2025 & 2033
- Figure 24: South America Sodium Hyaluronate Collagen Drink Volume (K), by Country 2025 & 2033
- Figure 25: South America Sodium Hyaluronate Collagen Drink Revenue Share (%), by Country 2025 & 2033
- Figure 26: South America Sodium Hyaluronate Collagen Drink Volume Share (%), by Country 2025 & 2033
- Figure 27: Europe Sodium Hyaluronate Collagen Drink Revenue (million), by Application 2025 & 2033
- Figure 28: Europe Sodium Hyaluronate Collagen Drink Volume (K), by Application 2025 & 2033
- Figure 29: Europe Sodium Hyaluronate Collagen Drink Revenue Share (%), by Application 2025 & 2033
- Figure 30: Europe Sodium Hyaluronate Collagen Drink Volume Share (%), by Application 2025 & 2033
- Figure 31: Europe Sodium Hyaluronate Collagen Drink Revenue (million), by Type 2025 & 2033
- Figure 32: Europe Sodium Hyaluronate Collagen Drink Volume (K), by Type 2025 & 2033
- Figure 33: Europe Sodium Hyaluronate Collagen Drink Revenue Share (%), by Type 2025 & 2033
- Figure 34: Europe Sodium Hyaluronate Collagen Drink Volume Share (%), by Type 2025 & 2033
- Figure 35: Europe Sodium Hyaluronate Collagen Drink Revenue (million), by Country 2025 & 2033
- Figure 36: Europe Sodium Hyaluronate Collagen Drink Volume (K), by Country 2025 & 2033
- Figure 37: Europe Sodium Hyaluronate Collagen Drink Revenue Share (%), by Country 2025 & 2033
- Figure 38: Europe Sodium Hyaluronate Collagen Drink Volume Share (%), by Country 2025 & 2033
- Figure 39: Middle East & Africa Sodium Hyaluronate Collagen Drink Revenue (million), by Application 2025 & 2033
- Figure 40: Middle East & Africa Sodium Hyaluronate Collagen Drink Volume (K), by Application 2025 & 2033
- Figure 41: Middle East & Africa Sodium Hyaluronate Collagen Drink Revenue Share (%), by Application 2025 & 2033
- Figure 42: Middle East & Africa Sodium Hyaluronate Collagen Drink Volume Share (%), by Application 2025 & 2033
- Figure 43: Middle East & Africa Sodium Hyaluronate Collagen Drink Revenue (million), by Type 2025 & 2033
- Figure 44: Middle East & Africa Sodium Hyaluronate Collagen Drink Volume (K), by Type 2025 & 2033
- Figure 45: Middle East & Africa Sodium Hyaluronate Collagen Drink Revenue Share (%), by Type 2025 & 2033
- Figure 46: Middle East & Africa Sodium Hyaluronate Collagen Drink Volume Share (%), by Type 2025 & 2033
- Figure 47: Middle East & Africa Sodium Hyaluronate Collagen Drink Revenue (million), by Country 2025 & 2033
- Figure 48: Middle East & Africa Sodium Hyaluronate Collagen Drink Volume (K), by Country 2025 & 2033
- Figure 49: Middle East & Africa Sodium Hyaluronate Collagen Drink Revenue Share (%), by Country 2025 & 2033
- Figure 50: Middle East & Africa Sodium Hyaluronate Collagen Drink Volume Share (%), by Country 2025 & 2033
- Figure 51: Asia Pacific Sodium Hyaluronate Collagen Drink Revenue (million), by Application 2025 & 2033
- Figure 52: Asia Pacific Sodium Hyaluronate Collagen Drink Volume (K), by Application 2025 & 2033
- Figure 53: Asia Pacific Sodium Hyaluronate Collagen Drink Revenue Share (%), by Application 2025 & 2033
- Figure 54: Asia Pacific Sodium Hyaluronate Collagen Drink Volume Share (%), by Application 2025 & 2033
- Figure 55: Asia Pacific Sodium Hyaluronate Collagen Drink Revenue (million), by Type 2025 & 2033
- Figure 56: Asia Pacific Sodium Hyaluronate Collagen Drink Volume (K), by Type 2025 & 2033
- Figure 57: Asia Pacific Sodium Hyaluronate Collagen Drink Revenue Share (%), by Type 2025 & 2033
- Figure 58: Asia Pacific Sodium Hyaluronate Collagen Drink Volume Share (%), by Type 2025 & 2033
- Figure 59: Asia Pacific Sodium Hyaluronate Collagen Drink Revenue (million), by Country 2025 & 2033
- Figure 60: Asia Pacific Sodium Hyaluronate Collagen Drink Volume (K), by Country 2025 & 2033
- Figure 61: Asia Pacific Sodium Hyaluronate Collagen Drink Revenue Share (%), by Country 2025 & 2033
- Figure 62: Asia Pacific Sodium Hyaluronate Collagen Drink Volume Share (%), by Country 2025 & 2033
List of Tables
- Table 1: Global Sodium Hyaluronate Collagen Drink Revenue million Forecast, by Application 2020 & 2033
- Table 2: Global Sodium Hyaluronate Collagen Drink Volume K Forecast, by Application 2020 & 2033
- Table 3: Global Sodium Hyaluronate Collagen Drink Revenue million Forecast, by Type 2020 & 2033
- Table 4: Global Sodium Hyaluronate Collagen Drink Volume K Forecast, by Type 2020 & 2033
- Table 5: Global Sodium Hyaluronate Collagen Drink Revenue million Forecast, by Region 2020 & 2033
- Table 6: Global Sodium Hyaluronate Collagen Drink Volume K Forecast, by Region 2020 & 2033
- Table 7: Global Sodium Hyaluronate Collagen Drink Revenue million Forecast, by Application 2020 & 2033
- Table 8: Global Sodium Hyaluronate Collagen Drink Volume K Forecast, by Application 2020 & 2033
- Table 9: Global Sodium Hyaluronate Collagen Drink Revenue million Forecast, by Type 2020 & 2033
- Table 10: Global Sodium Hyaluronate Collagen Drink Volume K Forecast, by Type 2020 & 2033
- Table 11: Global Sodium Hyaluronate Collagen Drink Revenue million Forecast, by Country 2020 & 2033
- Table 12: Global Sodium Hyaluronate Collagen Drink Volume K Forecast, by Country 2020 & 2033
- Table 13: United States Sodium Hyaluronate Collagen Drink Revenue (million) Forecast, by Application 2020 & 2033
- Table 14: United States Sodium Hyaluronate Collagen Drink Volume (K) Forecast, by Application 2020 & 2033
- Table 15: Canada Sodium Hyaluronate Collagen Drink Revenue (million) Forecast, by Application 2020 & 2033
- Table 16: Canada Sodium Hyaluronate Collagen Drink Volume (K) Forecast, by Application 2020 & 2033
- Table 17: Mexico Sodium Hyaluronate Collagen Drink Revenue (million) Forecast, by Application 2020 & 2033
- Table 18: Mexico Sodium Hyaluronate Collagen Drink Volume (K) Forecast, by Application 2020 & 2033
- Table 19: Global Sodium Hyaluronate Collagen Drink Revenue million Forecast, by Application 2020 & 2033
- Table 20: Global Sodium Hyaluronate Collagen Drink Volume K Forecast, by Application 2020 & 2033
- Table 21: Global Sodium Hyaluronate Collagen Drink Revenue million Forecast, by Type 2020 & 2033
- Table 22: Global Sodium Hyaluronate Collagen Drink Volume K Forecast, by Type 2020 & 2033
- Table 23: Global Sodium Hyaluronate Collagen Drink Revenue million Forecast, by Country 2020 & 2033
- Table 24: Global Sodium Hyaluronate Collagen Drink Volume K Forecast, by Country 2020 & 2033
- Table 25: Brazil Sodium Hyaluronate Collagen Drink Revenue (million) Forecast, by Application 2020 & 2033
- Table 26: Brazil Sodium Hyaluronate Collagen Drink Volume (K) Forecast, by Application 2020 & 2033
- Table 27: Argentina Sodium Hyaluronate Collagen Drink Revenue (million) Forecast, by Application 2020 & 2033
- Table 28: Argentina Sodium Hyaluronate Collagen Drink Volume (K) Forecast, by Application 2020 & 2033
- Table 29: Rest of South America Sodium Hyaluronate Collagen Drink Revenue (million) Forecast, by Application 2020 & 2033
- Table 30: Rest of South America Sodium Hyaluronate Collagen Drink Volume (K) Forecast, by Application 2020 & 2033
- Table 31: Global Sodium Hyaluronate Collagen Drink Revenue million Forecast, by Application 2020 & 2033
- Table 32: Global Sodium Hyaluronate Collagen Drink Volume K Forecast, by Application 2020 & 2033
- Table 33: Global Sodium Hyaluronate Collagen Drink Revenue million Forecast, by Type 2020 & 2033
- Table 34: Global Sodium Hyaluronate Collagen Drink Volume K Forecast, by Type 2020 & 2033
- Table 35: Global Sodium Hyaluronate Collagen Drink Revenue million Forecast, by Country 2020 & 2033
- Table 36: Global Sodium Hyaluronate Collagen Drink Volume K Forecast, by Country 2020 & 2033
- Table 37: United Kingdom Sodium Hyaluronate Collagen Drink Revenue (million) Forecast, by Application 2020 & 2033
- Table 38: United Kingdom Sodium Hyaluronate Collagen Drink Volume (K) Forecast, by Application 2020 & 2033
- Table 39: Germany Sodium Hyaluronate Collagen Drink Revenue (million) Forecast, by Application 2020 & 2033
- Table 40: Germany Sodium Hyaluronate Collagen Drink Volume (K) Forecast, by Application 2020 & 2033
- Table 41: France Sodium Hyaluronate Collagen Drink Revenue (million) Forecast, by Application 2020 & 2033
- Table 42: France Sodium Hyaluronate Collagen Drink Volume (K) Forecast, by Application 2020 & 2033
- Table 43: Italy Sodium Hyaluronate Collagen Drink Revenue (million) Forecast, by Application 2020 & 2033
- Table 44: Italy Sodium Hyaluronate Collagen Drink Volume (K) Forecast, by Application 2020 & 2033
- Table 45: Spain Sodium Hyaluronate Collagen Drink Revenue (million) Forecast, by Application 2020 & 2033
- Table 46: Spain Sodium Hyaluronate Collagen Drink Volume (K) Forecast, by Application 2020 & 2033
- Table 47: Russia Sodium Hyaluronate Collagen Drink Revenue (million) Forecast, by Application 2020 & 2033
- Table 48: Russia Sodium Hyaluronate Collagen Drink Volume (K) Forecast, by Application 2020 & 2033
- Table 49: Benelux Sodium Hyaluronate Collagen Drink Revenue (million) Forecast, by Application 2020 & 2033
- Table 50: Benelux Sodium Hyaluronate Collagen Drink Volume (K) Forecast, by Application 2020 & 2033
- Table 51: Nordics Sodium Hyaluronate Collagen Drink Revenue (million) Forecast, by Application 2020 & 2033
- Table 52: Nordics Sodium Hyaluronate Collagen Drink Volume (K) Forecast, by Application 2020 & 2033
- Table 53: Rest of Europe Sodium Hyaluronate Collagen Drink Revenue (million) Forecast, by Application 2020 & 2033
- Table 54: Rest of Europe Sodium Hyaluronate Collagen Drink Volume (K) Forecast, by Application 2020 & 2033
- Table 55: Global Sodium Hyaluronate Collagen Drink Revenue million Forecast, by Application 2020 & 2033
- Table 56: Global Sodium Hyaluronate Collagen Drink Volume K Forecast, by Application 2020 & 2033
- Table 57: Global Sodium Hyaluronate Collagen Drink Revenue million Forecast, by Type 2020 & 2033
- Table 58: Global Sodium Hyaluronate Collagen Drink Volume K Forecast, by Type 2020 & 2033
- Table 59: Global Sodium Hyaluronate Collagen Drink Revenue million Forecast, by Country 2020 & 2033
- Table 60: Global Sodium Hyaluronate Collagen Drink Volume K Forecast, by Country 2020 & 2033
- Table 61: Turkey Sodium Hyaluronate Collagen Drink Revenue (million) Forecast, by Application 2020 & 2033
- Table 62: Turkey Sodium Hyaluronate Collagen Drink Volume (K) Forecast, by Application 2020 & 2033
- Table 63: Israel Sodium Hyaluronate Collagen Drink Revenue (million) Forecast, by Application 2020 & 2033
- Table 64: Israel Sodium Hyaluronate Collagen Drink Volume (K) Forecast, by Application 2020 & 2033
- Table 65: GCC Sodium Hyaluronate Collagen Drink Revenue (million) Forecast, by Application 2020 & 2033
- Table 66: GCC Sodium Hyaluronate Collagen Drink Volume (K) Forecast, by Application 2020 & 2033
- Table 67: North Africa Sodium Hyaluronate Collagen Drink Revenue (million) Forecast, by Application 2020 & 2033
- Table 68: North Africa Sodium Hyaluronate Collagen Drink Volume (K) Forecast, by Application 2020 & 2033
- Table 69: South Africa Sodium Hyaluronate Collagen Drink Revenue (million) Forecast, by Application 2020 & 2033
- Table 70: South Africa Sodium Hyaluronate Collagen Drink Volume (K) Forecast, by Application 2020 & 2033
- Table 71: Rest of Middle East & Africa Sodium Hyaluronate Collagen Drink Revenue (million) Forecast, by Application 2020 & 2033
- Table 72: Rest of Middle East & Africa Sodium Hyaluronate Collagen Drink Volume (K) Forecast, by Application 2020 & 2033
- Table 73: Global Sodium Hyaluronate Collagen Drink Revenue million Forecast, by Application 2020 & 2033
- Table 74: Global Sodium Hyaluronate Collagen Drink Volume K Forecast, by Application 2020 & 2033
- Table 75: Global Sodium Hyaluronate Collagen Drink Revenue million Forecast, by Type 2020 & 2033
- Table 76: Global Sodium Hyaluronate Collagen Drink Volume K Forecast, by Type 2020 & 2033
- Table 77: Global Sodium Hyaluronate Collagen Drink Revenue million Forecast, by Country 2020 & 2033
- Table 78: Global Sodium Hyaluronate Collagen Drink Volume K Forecast, by Country 2020 & 2033
- Table 79: China Sodium Hyaluronate Collagen Drink Revenue (million) Forecast, by Application 2020 & 2033
- Table 80: China Sodium Hyaluronate Collagen Drink Volume (K) Forecast, by Application 2020 & 2033
- Table 81: India Sodium Hyaluronate Collagen Drink Revenue (million) Forecast, by Application 2020 & 2033
- Table 82: India Sodium Hyaluronate Collagen Drink Volume (K) Forecast, by Application 2020 & 2033
- Table 83: Japan Sodium Hyaluronate Collagen Drink Revenue (million) Forecast, by Application 2020 & 2033
- Table 84: Japan Sodium Hyaluronate Collagen Drink Volume (K) Forecast, by Application 2020 & 2033
- Table 85: South Korea Sodium Hyaluronate Collagen Drink Revenue (million) Forecast, by Application 2020 & 2033
- Table 86: South Korea Sodium Hyaluronate Collagen Drink Volume (K) Forecast, by Application 2020 & 2033
- Table 87: ASEAN Sodium Hyaluronate Collagen Drink Revenue (million) Forecast, by Application 2020 & 2033
- Table 88: ASEAN Sodium Hyaluronate Collagen Drink Volume (K) Forecast, by Application 2020 & 2033
- Table 89: Oceania Sodium Hyaluronate Collagen Drink Revenue (million) Forecast, by Application 2020 & 2033
- Table 90: Oceania Sodium Hyaluronate Collagen Drink Volume (K) Forecast, by Application 2020 & 2033
- Table 91: Rest of Asia Pacific Sodium Hyaluronate Collagen Drink Revenue (million) Forecast, by Application 2020 & 2033
- Table 92: Rest of Asia Pacific Sodium Hyaluronate Collagen Drink Volume (K) Forecast, by Application 2020 & 2033
Frequently Asked Questions
1. What is the projected Compound Annual Growth Rate (CAGR) of the Sodium Hyaluronate Collagen Drink?
The projected CAGR is approximately 12.3%.
2. Which companies are prominent players in the Sodium Hyaluronate Collagen Drink?
Key companies in the market include Swisse, Mary Kay, Hunan Jingfeng Pharmaceutical, Bloomage Biotechnology, Beijing Konruns Pharmaceutical, Eyoson Group, Guangdong Saimei Group, Topscience Biotech, Shangdong Kangmei Pharmaceutical.
3. What are the main segments of the Sodium Hyaluronate Collagen Drink?
The market segments include Application, Type.
4. Can you provide details about the market size?
The market size is estimated to be USD 383.77 million as of 2022.
5. What are some drivers contributing to market growth?
N/A
6. What are the notable trends driving market growth?
N/A
7. Are there any restraints impacting market growth?
N/A
8. Can you provide examples of recent developments in the market?
N/A
9. What pricing options are available for accessing the report?
Pricing options include single-user, multi-user, and enterprise licenses priced at USD 3950.00, USD 5925.00, and USD 7900.00 respectively.
10. Is the market size provided in terms of value or volume?
The market size is provided in terms of value, measured in million and volume, measured in K.
11. Are there any specific market keywords associated with the report?
Yes, the market keyword associated with the report is "Sodium Hyaluronate Collagen Drink," which aids in identifying and referencing the specific market segment covered.
12. How do I determine which pricing option suits my needs best?
The pricing options vary based on user requirements and access needs. Individual users may opt for single-user licenses, while businesses requiring broader access may choose multi-user or enterprise licenses for cost-effective access to the report.
13. Are there any additional resources or data provided in the Sodium Hyaluronate Collagen Drink report?
While the report offers comprehensive insights, it's advisable to review the specific contents or supplementary materials provided to ascertain if additional resources or data are available.
14. How can I stay updated on further developments or reports in the Sodium Hyaluronate Collagen Drink?
To stay informed about further developments, trends, and reports in the Sodium Hyaluronate Collagen Drink, consider subscribing to industry newsletters, following relevant companies and organizations, or regularly checking reputable industry news sources and publications.
Methodology
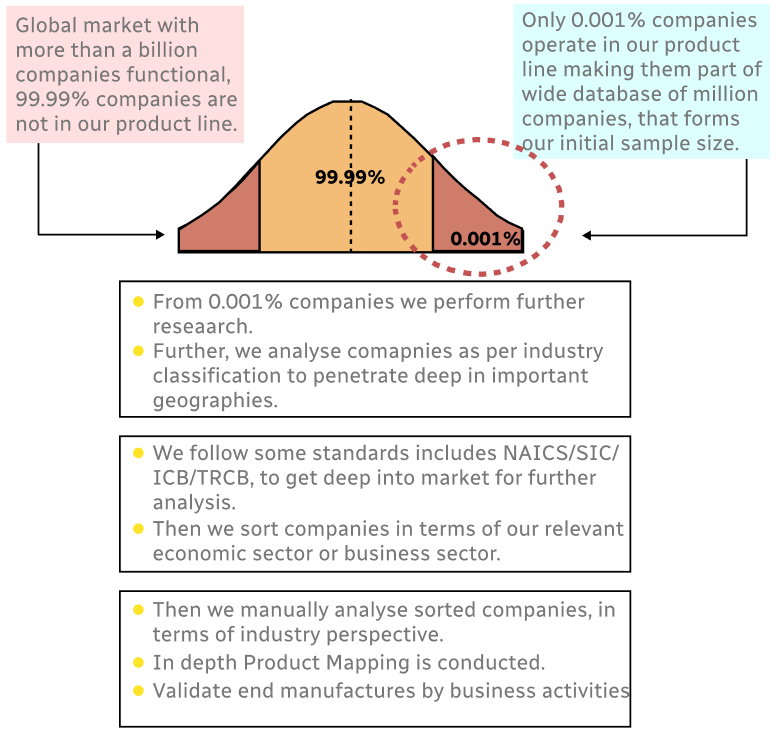
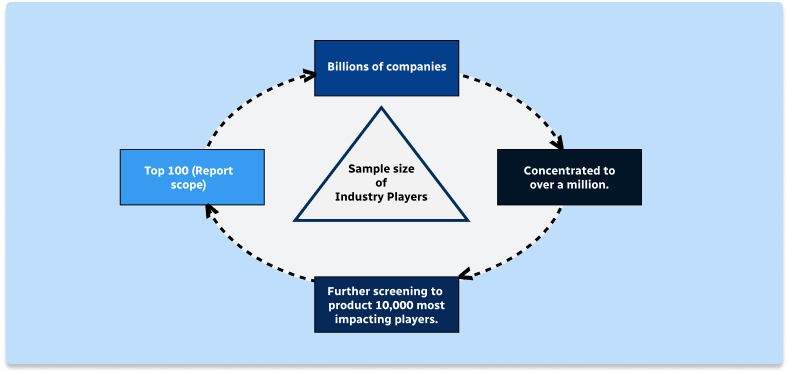
Step 1 - Identification of Relevant Samples Size from Population Database
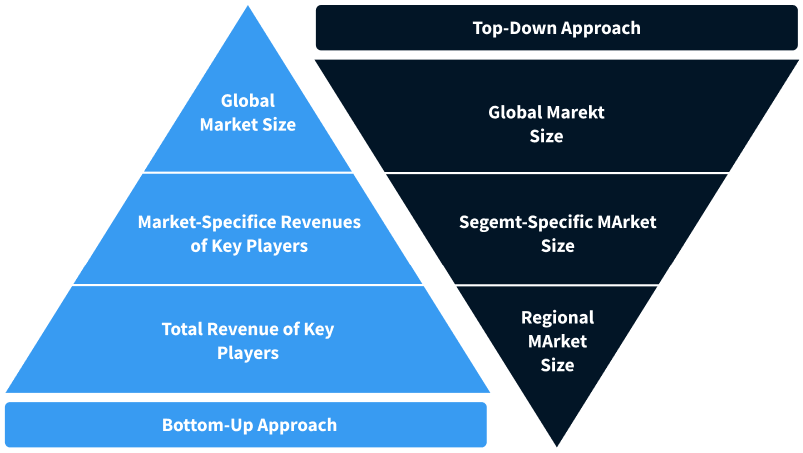
Step 2 - Approaches for Defining Global Market Size (Value, Volume* & Price*)
Note*: In applicable scenarios
Step 3 - Data Sources
Primary Research
- Web Analytics
- Survey Reports
- Research Institute
- Latest Research Reports
- Opinion Leaders
Secondary Research
- Annual Reports
- White Paper
- Latest Press Release
- Industry Association
- Paid Database
- Investor Presentations
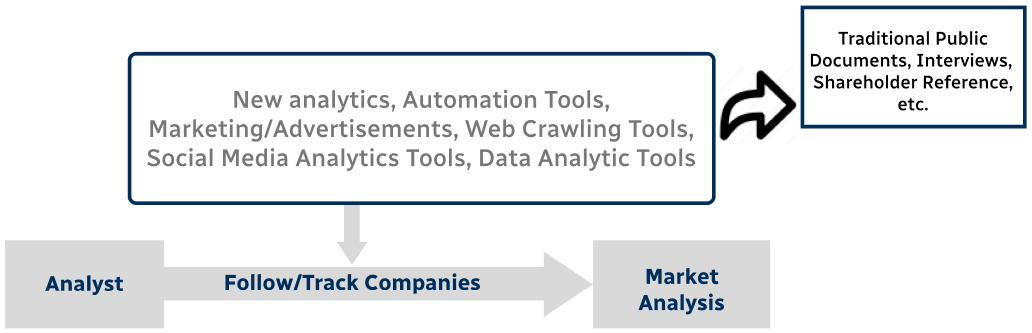
Step 4 - Data Triangulation
Involves using different sources of information in order to increase the validity of a study
These sources are likely to be stakeholders in a program - participants, other researchers, program staff, other community members, and so on.
Then we put all data in single framework & apply various statistical tools to find out the dynamic on the market.
During the analysis stage, feedback from the stakeholder groups would be compared to determine areas of agreement as well as areas of divergence