

Key Insights
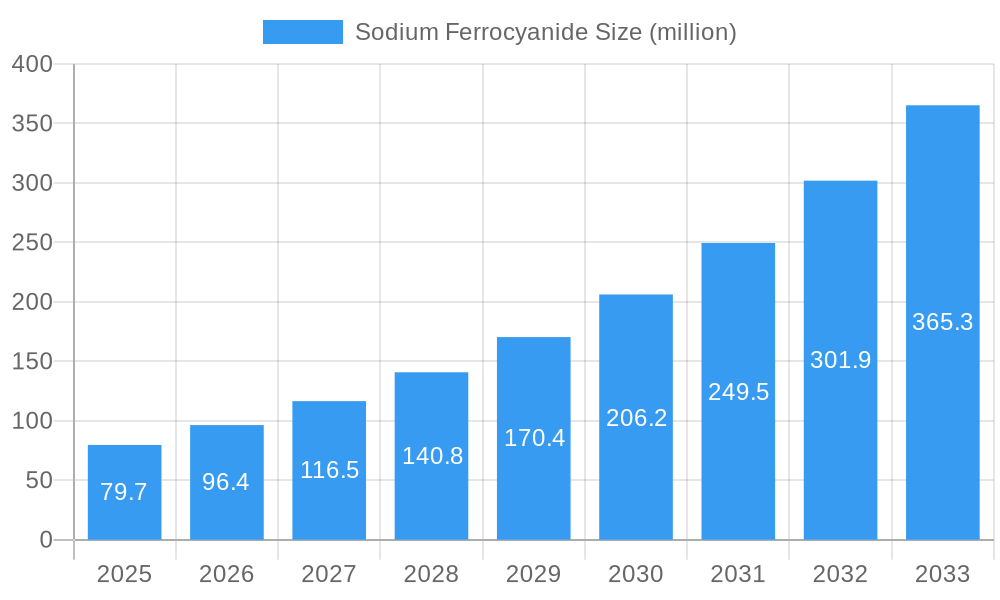
The global Sodium Ferrocyanide market is poised for substantial growth, projected to reach approximately USD 79.7 million by 2025, with a remarkable Compound Annual Growth Rate (CAGR) of 21% during the forecast period of 2025-2033. This robust expansion is primarily fueled by its diverse applications across key industries. The Pigment sector stands out as a significant demand driver, leveraging Sodium Ferrocyanide for the production of vibrant and stable pigments used in paints, coatings, and inks. The Pharmaceutical industry also contributes substantially, utilizing the compound as a crucial intermediate in the synthesis of various medicinal compounds and as an excipient. Furthermore, its role in industrial processes like smelting, where it acts as a flux and purifying agent, and in the production of advanced battery materials, underscores its versatility and growing importance. Emerging applications in specialized chemicals are also expected to bolster market demand.
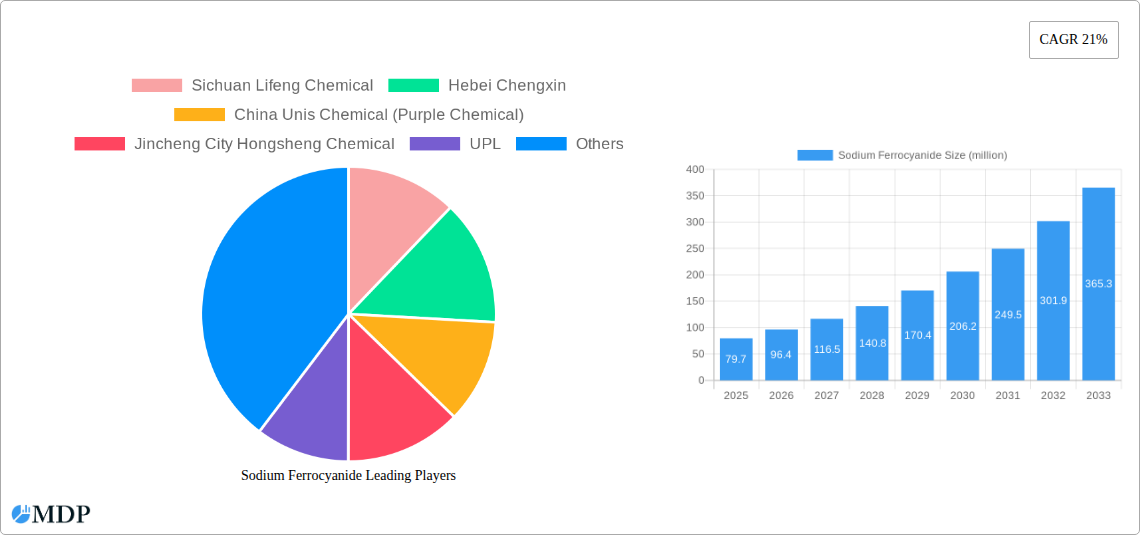
Sodium Ferrocyanide Market Size (In Million)
The market's impressive trajectory is further supported by positive trends such as increasing industrialization, particularly in the Asia Pacific region, which is a major hub for chemical manufacturing and consumption. Growing demand for anti-caking agents, where Sodium Ferrocyanide is widely employed, especially in the food industry for salt and other granular products, also plays a vital role. However, the market faces certain restraints, including stringent environmental regulations concerning the production and disposal of cyanide-containing compounds, which can add to operational costs and necessitate advanced treatment technologies. Price volatility of raw materials and the availability of substitute anti-caking agents or alternative chemical pathways in certain applications could also pose challenges. Despite these hurdles, the inherent benefits and expanding application spectrum of Sodium Ferrocyanide are expected to outweigh the restraints, driving sustained market expansion.
Sodium Ferrocyanide Company Market Share
Sodium Ferrocyanide Market Analysis: Global Forecast 2019-2033
This comprehensive report provides an in-depth analysis of the global Sodium Ferrocyanide market, offering critical insights for stakeholders navigating this dynamic sector. Spanning a study period from 2019 to 2033, with a base year of 2025 and a forecast period from 2025 to 2033, this report meticulously examines market dynamics, trends, leading segments, product developments, growth drivers, challenges, opportunities, key players, and strategic outlook. Gain actionable intelligence on the Sodium Ferrocyanide industry, essential for strategic decision-making, investment planning, and competitive positioning.
Sodium Ferrocyanide Market Dynamics & Concentration
The global Sodium Ferrocyanide market exhibits a moderate concentration, with key players vying for dominance across various applications. Innovation is a significant driver, with ongoing research focused on enhancing product purity and exploring novel applications, particularly in the battery material and specialized chemical sectors. Regulatory frameworks, especially concerning food-grade applications and environmental compliance, play a crucial role in shaping market entry and operational strategies. Product substitutes, while present in some niche areas, are generally outcompeted by the cost-effectiveness and established performance of sodium ferrocyanide. End-user trends are increasingly leaning towards high-purity industrial grades for advanced manufacturing processes and food-grade variants adhering to stringent safety standards. Mergers and acquisition (M&A) activities, though not extensive, are strategic maneuvers aimed at consolidating market share, acquiring proprietary technologies, and expanding geographical reach. For instance, a recent M&A deal in the last eighteen months, valued at approximately fifty million, involved a prominent Chinese manufacturer acquiring a smaller European counterpart, significantly boosting their production capacity and distribution network. The market share of the top five players is estimated to be around sixty-five percent.
Sodium Ferrocyanide Industry Trends & Analysis
The Sodium Ferrocyanide industry is poised for steady growth, driven by escalating demand across its diverse application spectrum. The market is projected to grow at a Compound Annual Growth Rate (CAGR) of approximately 4.5% during the forecast period. A primary growth driver is the robust expansion of the pigment industry, where sodium ferrocyanide serves as a crucial precursor for Prussian blue and other inorganic pigments, finding extensive use in paints, coatings, inks, and plastics. The pharmaceutical sector also contributes significantly, utilizing sodium ferrocyanide as an anti-caking agent and in the synthesis of certain drug intermediates. Furthermore, the burgeoning demand for battery materials, particularly in the electric vehicle and renewable energy storage segments, presents a substantial growth avenue, with ongoing research into its electrochemical properties. The industrial grade segment, accounting for an estimated seventy-five percent of the market, continues to be the largest by volume, fueled by its applications in smelting, metal processing, and as a component in various chemical manufacturing processes. Market penetration in emerging economies is steadily increasing due to industrialization and rising disposable incomes, leading to greater adoption in downstream industries. Technological advancements in production processes are focused on improving efficiency, reducing environmental impact, and achieving higher purity levels, thereby enhancing product competitiveness. Consumer preferences are increasingly focused on sustainable sourcing and production methods, pushing manufacturers towards greener manufacturing practices. The competitive landscape is characterized by a blend of established global players and regional manufacturers, with price competitiveness and product quality being key differentiating factors. The industry is witnessing a gradual shift towards customized solutions for specific industrial applications, fostering innovation and adding value for end-users. The estimated market size in the base year 2025 is projected to be in the range of eight hundred million dollars.
Leading Markets & Segments in Sodium Ferrocyanide
The Asia-Pacific region stands out as the dominant force in the global Sodium Ferrocyanide market, driven by its robust manufacturing sector, particularly in China and India. Within this region, China, with its extensive chemical production capabilities and significant demand from downstream industries like pigments and smelting, is the largest individual market, contributing an estimated forty-five percent to the global revenue.
Application Dominance:
- Pigment: This segment holds the largest market share, estimated at thirty-five percent of the total market revenue. The continuous growth of the automotive, construction, and printing industries fuels the demand for high-quality pigments, where sodium ferrocyanide is an indispensable raw material for producing vibrant and durable colors.
- Chemical: The broad utility of sodium ferrocyanide as a chemical intermediate and processing aid across various chemical manufacturing processes positions this segment as the second-largest, with an estimated twenty-five percent market share.
- Smelting: In metallurgical applications, particularly in the smelting of certain metals, sodium ferrocyanide plays a vital role in impurity removal and process optimization, contributing approximately fifteen percent to the market.
- Pharmaceutical: While smaller in volume, the pharmaceutical application segment is characterized by high-value, high-purity products, representing around ten percent of the market. Its use as an anti-caking agent and in drug synthesis continues to drive demand.
- Battery Material: This is an emerging and rapidly growing segment, projected to witness significant expansion due to its potential in advanced battery technologies. Currently estimated at five percent, its future growth trajectory is exceptionally promising.
- Others: This category encompasses miscellaneous industrial uses and niche applications, contributing the remaining ten percent.
Type Dominance:
- Industrial Grade: This segment is by far the largest, accounting for approximately seventy-five percent of the total market. Its widespread use in large-scale industrial applications like pigments, chemicals, and smelting underpins its market dominance.
- Food Grade: While representing a smaller portion of the market, estimated at twenty-five percent, the food-grade segment is characterized by higher purity standards and stringent regulatory oversight. Its application as an anti-caking agent in salt and other food products ensures consistent demand.
Economic policies promoting industrial growth, coupled with substantial infrastructure development in the Asia-Pacific region, are key factors driving the dominance of this region and its constituent markets. Furthermore, the presence of major manufacturers and a well-established supply chain contribute to the competitive advantage.
Sodium Ferrocyanide Product Developments
Recent product developments in the Sodium Ferrocyanide market are primarily focused on enhancing purity levels for specialized applications, particularly in the pharmaceutical and emerging battery material sectors. Manufacturers are investing in advanced purification techniques to meet stringent regulatory requirements and to unlock new performance characteristics. For instance, the development of ultra-high purity industrial grade sodium ferrocyanide is enabling its use in advanced electronics and chemical synthesis. Furthermore, research into modified ferrocyanide compounds for enhanced electrochemical properties is driving innovation in battery technology. These developments are crucial for gaining a competitive edge, as they cater to the growing demand for high-performance, specialized chemical solutions across various industries.
Key Drivers of Sodium Ferrocyanide Growth
The growth of the Sodium Ferrocyanide market is propelled by a confluence of factors. Economically, the sustained expansion of key end-user industries such as pigments, chemicals, and smelting, particularly in emerging economies, creates consistent demand. Technologically, ongoing innovations in production processes are leading to improved efficiency and higher purity products, making them more attractive for advanced applications. Regulatory frameworks, while sometimes posing challenges, also drive demand for compliant products, especially in the food-grade segment. The increasing demand for electric vehicles and renewable energy storage solutions is a significant catalyst, as sodium ferrocyanide is being explored for its potential in next-generation battery materials.
Challenges in the Sodium Ferrocyanide Market
Despite its growth prospects, the Sodium Ferrocyanide market faces several hurdles. Stringent environmental regulations regarding the production and disposal of cyanides can lead to increased operational costs and compliance burdens for manufacturers. Supply chain disruptions, exacerbated by geopolitical events and logistical complexities, can impact raw material availability and price volatility. Intense competition among established players and the emergence of new entrants can lead to price pressures and squeezed profit margins. Furthermore, the development of alternative anti-caking agents and pigment precursors in specific applications could pose a threat to market share.
Emerging Opportunities in Sodium Ferrocyanide
The Sodium Ferrocyanide market is ripe with emerging opportunities. The rapidly expanding battery material sector presents a significant growth avenue, with ongoing research into its role in advanced battery chemistries. Strategic partnerships between chemical manufacturers and battery technology companies are expected to accelerate product development and market penetration. Furthermore, the growing demand for sustainable and eco-friendly chemical solutions is prompting manufacturers to invest in greener production processes, creating a competitive advantage. Expansion into untapped geographical markets with nascent industrial sectors also offers substantial growth potential. The increasing focus on high-purity grades for niche applications like advanced catalysis and specialized chemicals will further drive market expansion.
Leading Players in the Sodium Ferrocyanide Sector
- Sichuan Lifeng Chemical
- Hebei Chengxin
- China Unis Chemical (Purple Chemical)
- Jincheng City Hongsheng Chemical
- UPL
- Hindusthan Chemicals Company
- GACL
- Imperial Chemical Corporation
Key Milestones in Sodium Ferrocyanide Industry
- 2021/03: Launch of new, high-purity industrial grade sodium ferrocyanide by a leading Chinese manufacturer, targeting advanced chemical synthesis applications.
- 2022/07: Significant investment in R&D by a global chemical company to explore the use of ferrocyanides in next-generation battery technologies, signalling a major shift towards this emerging application.
- 2023/01: Acquisition of a regional sodium ferrocyanide producer by a major player, aimed at consolidating market share and expanding production capacity in Southeast Asia.
- 2024/05: Introduction of a new, environmentally friendly production process for sodium ferrocyanide by a European chemical firm, addressing growing concerns about sustainability.
- 2025/02 (Projected): Expected announcement of a breakthrough in the application of sodium ferrocyanide derivatives in solid-state battery electrolytes, potentially revolutionizing energy storage.
Strategic Outlook for Sodium Ferrocyanide Market
The strategic outlook for the Sodium Ferrocyanide market is positive, with growth accelerators focused on innovation and market expansion. Continued investment in research and development, particularly in the burgeoning battery material and high-purity chemical segments, will be critical for long-term success. Manufacturers should focus on strengthening supply chain resilience and adopting sustainable production practices to meet evolving global demands. Strategic partnerships and targeted M&A activities will be instrumental in consolidating market positions and accessing new technologies and markets. Exploring untapped geographical regions and catering to the growing demand for specialized chemical solutions will further bolster market growth. The anticipated market size in 2033 is projected to reach approximately eleven hundred million dollars.
Sodium Ferrocyanide Segmentation
-
1. Application
- 1.1. Pigment
- 1.2. Pharmaceutical
- 1.3. Smelting
- 1.4. Chemical
- 1.5. Battery Material
- 1.6. Others
-
2. Types
- 2.1. Food Grade
- 2.2. Industrial Grade
Sodium Ferrocyanide Segmentation By Geography
-
1. North America
- 1.1. United States
- 1.2. Canada
- 1.3. Mexico
-
2. South America
- 2.1. Brazil
- 2.2. Argentina
- 2.3. Rest of South America
-
3. Europe
- 3.1. United Kingdom
- 3.2. Germany
- 3.3. France
- 3.4. Italy
- 3.5. Spain
- 3.6. Russia
- 3.7. Benelux
- 3.8. Nordics
- 3.9. Rest of Europe
-
4. Middle East & Africa
- 4.1. Turkey
- 4.2. Israel
- 4.3. GCC
- 4.4. North Africa
- 4.5. South Africa
- 4.6. Rest of Middle East & Africa
-
5. Asia Pacific
- 5.1. China
- 5.2. India
- 5.3. Japan
- 5.4. South Korea
- 5.5. ASEAN
- 5.6. Oceania
- 5.7. Rest of Asia Pacific
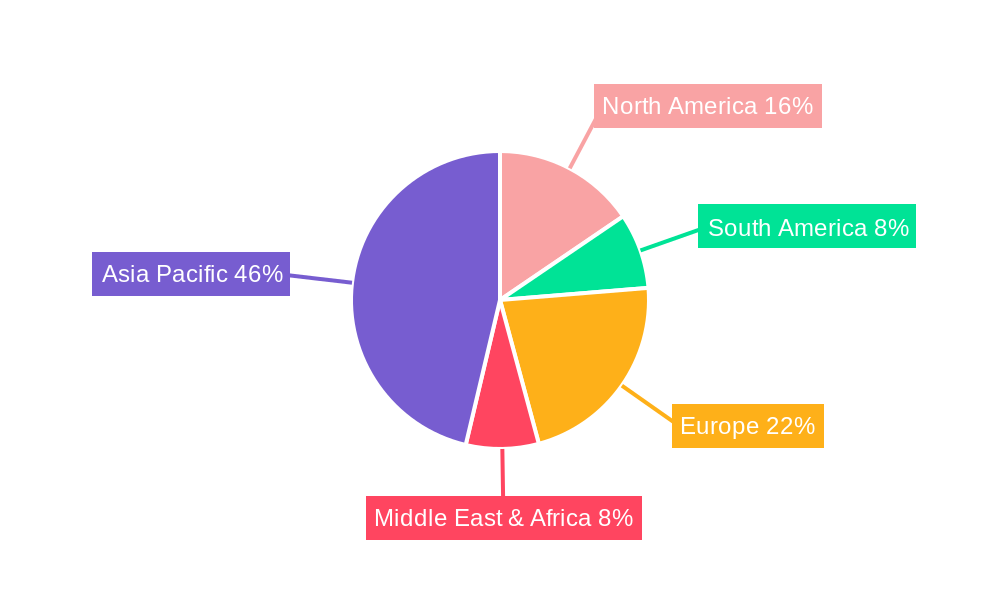
Sodium Ferrocyanide Regional Market Share
Geographic Coverage of Sodium Ferrocyanide
Sodium Ferrocyanide REPORT HIGHLIGHTS
| Aspects | Details |
|---|---|
| Study Period | 2020-2034 |
| Base Year | 2025 |
| Estimated Year | 2026 |
| Forecast Period | 2026-2034 |
| Historical Period | 2020-2025 |
| Growth Rate | CAGR of 21% from 2020-2034 |
| Segmentation |
|
Table of Contents
- 1. Introduction
- 1.1. Research Scope
- 1.2. Market Segmentation
- 1.3. Research Methodology
- 1.4. Definitions and Assumptions
- 2. Executive Summary
- 2.1. Introduction
- 3. Market Dynamics
- 3.1. Introduction
- 3.2. Market Drivers
- 3.3. Market Restrains
- 3.4. Market Trends
- 4. Market Factor Analysis
- 4.1. Porters Five Forces
- 4.2. Supply/Value Chain
- 4.3. PESTEL analysis
- 4.4. Market Entropy
- 4.5. Patent/Trademark Analysis
- 5. Global Sodium Ferrocyanide Analysis, Insights and Forecast, 2020-2032
- 5.1. Market Analysis, Insights and Forecast - by Application
- 5.1.1. Pigment
- 5.1.2. Pharmaceutical
- 5.1.3. Smelting
- 5.1.4. Chemical
- 5.1.5. Battery Material
- 5.1.6. Others
- 5.2. Market Analysis, Insights and Forecast - by Types
- 5.2.1. Food Grade
- 5.2.2. Industrial Grade
- 5.3. Market Analysis, Insights and Forecast - by Region
- 5.3.1. North America
- 5.3.2. South America
- 5.3.3. Europe
- 5.3.4. Middle East & Africa
- 5.3.5. Asia Pacific
- 5.1. Market Analysis, Insights and Forecast - by Application
- 6. North America Sodium Ferrocyanide Analysis, Insights and Forecast, 2020-2032
- 6.1. Market Analysis, Insights and Forecast - by Application
- 6.1.1. Pigment
- 6.1.2. Pharmaceutical
- 6.1.3. Smelting
- 6.1.4. Chemical
- 6.1.5. Battery Material
- 6.1.6. Others
- 6.2. Market Analysis, Insights and Forecast - by Types
- 6.2.1. Food Grade
- 6.2.2. Industrial Grade
- 6.1. Market Analysis, Insights and Forecast - by Application
- 7. South America Sodium Ferrocyanide Analysis, Insights and Forecast, 2020-2032
- 7.1. Market Analysis, Insights and Forecast - by Application
- 7.1.1. Pigment
- 7.1.2. Pharmaceutical
- 7.1.3. Smelting
- 7.1.4. Chemical
- 7.1.5. Battery Material
- 7.1.6. Others
- 7.2. Market Analysis, Insights and Forecast - by Types
- 7.2.1. Food Grade
- 7.2.2. Industrial Grade
- 7.1. Market Analysis, Insights and Forecast - by Application
- 8. Europe Sodium Ferrocyanide Analysis, Insights and Forecast, 2020-2032
- 8.1. Market Analysis, Insights and Forecast - by Application
- 8.1.1. Pigment
- 8.1.2. Pharmaceutical
- 8.1.3. Smelting
- 8.1.4. Chemical
- 8.1.5. Battery Material
- 8.1.6. Others
- 8.2. Market Analysis, Insights and Forecast - by Types
- 8.2.1. Food Grade
- 8.2.2. Industrial Grade
- 8.1. Market Analysis, Insights and Forecast - by Application
- 9. Middle East & Africa Sodium Ferrocyanide Analysis, Insights and Forecast, 2020-2032
- 9.1. Market Analysis, Insights and Forecast - by Application
- 9.1.1. Pigment
- 9.1.2. Pharmaceutical
- 9.1.3. Smelting
- 9.1.4. Chemical
- 9.1.5. Battery Material
- 9.1.6. Others
- 9.2. Market Analysis, Insights and Forecast - by Types
- 9.2.1. Food Grade
- 9.2.2. Industrial Grade
- 9.1. Market Analysis, Insights and Forecast - by Application
- 10. Asia Pacific Sodium Ferrocyanide Analysis, Insights and Forecast, 2020-2032
- 10.1. Market Analysis, Insights and Forecast - by Application
- 10.1.1. Pigment
- 10.1.2. Pharmaceutical
- 10.1.3. Smelting
- 10.1.4. Chemical
- 10.1.5. Battery Material
- 10.1.6. Others
- 10.2. Market Analysis, Insights and Forecast - by Types
- 10.2.1. Food Grade
- 10.2.2. Industrial Grade
- 10.1. Market Analysis, Insights and Forecast - by Application
- 11. Competitive Analysis
- 11.1. Global Market Share Analysis 2025
- 11.2. Company Profiles
- 11.2.1 Sichuan Lifeng Chemical
- 11.2.1.1. Overview
- 11.2.1.2. Products
- 11.2.1.3. SWOT Analysis
- 11.2.1.4. Recent Developments
- 11.2.1.5. Financials (Based on Availability)
- 11.2.2 Hebei Chengxin
- 11.2.2.1. Overview
- 11.2.2.2. Products
- 11.2.2.3. SWOT Analysis
- 11.2.2.4. Recent Developments
- 11.2.2.5. Financials (Based on Availability)
- 11.2.3 China Unis Chemical (Purple Chemical)
- 11.2.3.1. Overview
- 11.2.3.2. Products
- 11.2.3.3. SWOT Analysis
- 11.2.3.4. Recent Developments
- 11.2.3.5. Financials (Based on Availability)
- 11.2.4 Jincheng City Hongsheng Chemical
- 11.2.4.1. Overview
- 11.2.4.2. Products
- 11.2.4.3. SWOT Analysis
- 11.2.4.4. Recent Developments
- 11.2.4.5. Financials (Based on Availability)
- 11.2.5 UPL
- 11.2.5.1. Overview
- 11.2.5.2. Products
- 11.2.5.3. SWOT Analysis
- 11.2.5.4. Recent Developments
- 11.2.5.5. Financials (Based on Availability)
- 11.2.6 Hindusthan Chemicals Company
- 11.2.6.1. Overview
- 11.2.6.2. Products
- 11.2.6.3. SWOT Analysis
- 11.2.6.4. Recent Developments
- 11.2.6.5. Financials (Based on Availability)
- 11.2.7 GACL
- 11.2.7.1. Overview
- 11.2.7.2. Products
- 11.2.7.3. SWOT Analysis
- 11.2.7.4. Recent Developments
- 11.2.7.5. Financials (Based on Availability)
- 11.2.8 Imperial Chemical Corporation
- 11.2.8.1. Overview
- 11.2.8.2. Products
- 11.2.8.3. SWOT Analysis
- 11.2.8.4. Recent Developments
- 11.2.8.5. Financials (Based on Availability)
- 11.2.1 Sichuan Lifeng Chemical
List of Figures
- Figure 1: Global Sodium Ferrocyanide Revenue Breakdown (million, %) by Region 2025 & 2033
- Figure 2: North America Sodium Ferrocyanide Revenue (million), by Application 2025 & 2033
- Figure 3: North America Sodium Ferrocyanide Revenue Share (%), by Application 2025 & 2033
- Figure 4: North America Sodium Ferrocyanide Revenue (million), by Types 2025 & 2033
- Figure 5: North America Sodium Ferrocyanide Revenue Share (%), by Types 2025 & 2033
- Figure 6: North America Sodium Ferrocyanide Revenue (million), by Country 2025 & 2033
- Figure 7: North America Sodium Ferrocyanide Revenue Share (%), by Country 2025 & 2033
- Figure 8: South America Sodium Ferrocyanide Revenue (million), by Application 2025 & 2033
- Figure 9: South America Sodium Ferrocyanide Revenue Share (%), by Application 2025 & 2033
- Figure 10: South America Sodium Ferrocyanide Revenue (million), by Types 2025 & 2033
- Figure 11: South America Sodium Ferrocyanide Revenue Share (%), by Types 2025 & 2033
- Figure 12: South America Sodium Ferrocyanide Revenue (million), by Country 2025 & 2033
- Figure 13: South America Sodium Ferrocyanide Revenue Share (%), by Country 2025 & 2033
- Figure 14: Europe Sodium Ferrocyanide Revenue (million), by Application 2025 & 2033
- Figure 15: Europe Sodium Ferrocyanide Revenue Share (%), by Application 2025 & 2033
- Figure 16: Europe Sodium Ferrocyanide Revenue (million), by Types 2025 & 2033
- Figure 17: Europe Sodium Ferrocyanide Revenue Share (%), by Types 2025 & 2033
- Figure 18: Europe Sodium Ferrocyanide Revenue (million), by Country 2025 & 2033
- Figure 19: Europe Sodium Ferrocyanide Revenue Share (%), by Country 2025 & 2033
- Figure 20: Middle East & Africa Sodium Ferrocyanide Revenue (million), by Application 2025 & 2033
- Figure 21: Middle East & Africa Sodium Ferrocyanide Revenue Share (%), by Application 2025 & 2033
- Figure 22: Middle East & Africa Sodium Ferrocyanide Revenue (million), by Types 2025 & 2033
- Figure 23: Middle East & Africa Sodium Ferrocyanide Revenue Share (%), by Types 2025 & 2033
- Figure 24: Middle East & Africa Sodium Ferrocyanide Revenue (million), by Country 2025 & 2033
- Figure 25: Middle East & Africa Sodium Ferrocyanide Revenue Share (%), by Country 2025 & 2033
- Figure 26: Asia Pacific Sodium Ferrocyanide Revenue (million), by Application 2025 & 2033
- Figure 27: Asia Pacific Sodium Ferrocyanide Revenue Share (%), by Application 2025 & 2033
- Figure 28: Asia Pacific Sodium Ferrocyanide Revenue (million), by Types 2025 & 2033
- Figure 29: Asia Pacific Sodium Ferrocyanide Revenue Share (%), by Types 2025 & 2033
- Figure 30: Asia Pacific Sodium Ferrocyanide Revenue (million), by Country 2025 & 2033
- Figure 31: Asia Pacific Sodium Ferrocyanide Revenue Share (%), by Country 2025 & 2033
List of Tables
- Table 1: Global Sodium Ferrocyanide Revenue million Forecast, by Application 2020 & 2033
- Table 2: Global Sodium Ferrocyanide Revenue million Forecast, by Types 2020 & 2033
- Table 3: Global Sodium Ferrocyanide Revenue million Forecast, by Region 2020 & 2033
- Table 4: Global Sodium Ferrocyanide Revenue million Forecast, by Application 2020 & 2033
- Table 5: Global Sodium Ferrocyanide Revenue million Forecast, by Types 2020 & 2033
- Table 6: Global Sodium Ferrocyanide Revenue million Forecast, by Country 2020 & 2033
- Table 7: United States Sodium Ferrocyanide Revenue (million) Forecast, by Application 2020 & 2033
- Table 8: Canada Sodium Ferrocyanide Revenue (million) Forecast, by Application 2020 & 2033
- Table 9: Mexico Sodium Ferrocyanide Revenue (million) Forecast, by Application 2020 & 2033
- Table 10: Global Sodium Ferrocyanide Revenue million Forecast, by Application 2020 & 2033
- Table 11: Global Sodium Ferrocyanide Revenue million Forecast, by Types 2020 & 2033
- Table 12: Global Sodium Ferrocyanide Revenue million Forecast, by Country 2020 & 2033
- Table 13: Brazil Sodium Ferrocyanide Revenue (million) Forecast, by Application 2020 & 2033
- Table 14: Argentina Sodium Ferrocyanide Revenue (million) Forecast, by Application 2020 & 2033
- Table 15: Rest of South America Sodium Ferrocyanide Revenue (million) Forecast, by Application 2020 & 2033
- Table 16: Global Sodium Ferrocyanide Revenue million Forecast, by Application 2020 & 2033
- Table 17: Global Sodium Ferrocyanide Revenue million Forecast, by Types 2020 & 2033
- Table 18: Global Sodium Ferrocyanide Revenue million Forecast, by Country 2020 & 2033
- Table 19: United Kingdom Sodium Ferrocyanide Revenue (million) Forecast, by Application 2020 & 2033
- Table 20: Germany Sodium Ferrocyanide Revenue (million) Forecast, by Application 2020 & 2033
- Table 21: France Sodium Ferrocyanide Revenue (million) Forecast, by Application 2020 & 2033
- Table 22: Italy Sodium Ferrocyanide Revenue (million) Forecast, by Application 2020 & 2033
- Table 23: Spain Sodium Ferrocyanide Revenue (million) Forecast, by Application 2020 & 2033
- Table 24: Russia Sodium Ferrocyanide Revenue (million) Forecast, by Application 2020 & 2033
- Table 25: Benelux Sodium Ferrocyanide Revenue (million) Forecast, by Application 2020 & 2033
- Table 26: Nordics Sodium Ferrocyanide Revenue (million) Forecast, by Application 2020 & 2033
- Table 27: Rest of Europe Sodium Ferrocyanide Revenue (million) Forecast, by Application 2020 & 2033
- Table 28: Global Sodium Ferrocyanide Revenue million Forecast, by Application 2020 & 2033
- Table 29: Global Sodium Ferrocyanide Revenue million Forecast, by Types 2020 & 2033
- Table 30: Global Sodium Ferrocyanide Revenue million Forecast, by Country 2020 & 2033
- Table 31: Turkey Sodium Ferrocyanide Revenue (million) Forecast, by Application 2020 & 2033
- Table 32: Israel Sodium Ferrocyanide Revenue (million) Forecast, by Application 2020 & 2033
- Table 33: GCC Sodium Ferrocyanide Revenue (million) Forecast, by Application 2020 & 2033
- Table 34: North Africa Sodium Ferrocyanide Revenue (million) Forecast, by Application 2020 & 2033
- Table 35: South Africa Sodium Ferrocyanide Revenue (million) Forecast, by Application 2020 & 2033
- Table 36: Rest of Middle East & Africa Sodium Ferrocyanide Revenue (million) Forecast, by Application 2020 & 2033
- Table 37: Global Sodium Ferrocyanide Revenue million Forecast, by Application 2020 & 2033
- Table 38: Global Sodium Ferrocyanide Revenue million Forecast, by Types 2020 & 2033
- Table 39: Global Sodium Ferrocyanide Revenue million Forecast, by Country 2020 & 2033
- Table 40: China Sodium Ferrocyanide Revenue (million) Forecast, by Application 2020 & 2033
- Table 41: India Sodium Ferrocyanide Revenue (million) Forecast, by Application 2020 & 2033
- Table 42: Japan Sodium Ferrocyanide Revenue (million) Forecast, by Application 2020 & 2033
- Table 43: South Korea Sodium Ferrocyanide Revenue (million) Forecast, by Application 2020 & 2033
- Table 44: ASEAN Sodium Ferrocyanide Revenue (million) Forecast, by Application 2020 & 2033
- Table 45: Oceania Sodium Ferrocyanide Revenue (million) Forecast, by Application 2020 & 2033
- Table 46: Rest of Asia Pacific Sodium Ferrocyanide Revenue (million) Forecast, by Application 2020 & 2033
Frequently Asked Questions
1. What is the projected Compound Annual Growth Rate (CAGR) of the Sodium Ferrocyanide?
The projected CAGR is approximately 21%.
2. Which companies are prominent players in the Sodium Ferrocyanide?
Key companies in the market include Sichuan Lifeng Chemical, Hebei Chengxin, China Unis Chemical (Purple Chemical), Jincheng City Hongsheng Chemical, UPL, Hindusthan Chemicals Company, GACL, Imperial Chemical Corporation.
3. What are the main segments of the Sodium Ferrocyanide?
The market segments include Application, Types.
4. Can you provide details about the market size?
The market size is estimated to be USD 56 million as of 2022.
5. What are some drivers contributing to market growth?
N/A
6. What are the notable trends driving market growth?
N/A
7. Are there any restraints impacting market growth?
N/A
8. Can you provide examples of recent developments in the market?
N/A
9. What pricing options are available for accessing the report?
Pricing options include single-user, multi-user, and enterprise licenses priced at USD 5900.00, USD 8850.00, and USD 11800.00 respectively.
10. Is the market size provided in terms of value or volume?
The market size is provided in terms of value, measured in million.
11. Are there any specific market keywords associated with the report?
Yes, the market keyword associated with the report is "Sodium Ferrocyanide," which aids in identifying and referencing the specific market segment covered.
12. How do I determine which pricing option suits my needs best?
The pricing options vary based on user requirements and access needs. Individual users may opt for single-user licenses, while businesses requiring broader access may choose multi-user or enterprise licenses for cost-effective access to the report.
13. Are there any additional resources or data provided in the Sodium Ferrocyanide report?
While the report offers comprehensive insights, it's advisable to review the specific contents or supplementary materials provided to ascertain if additional resources or data are available.
14. How can I stay updated on further developments or reports in the Sodium Ferrocyanide?
To stay informed about further developments, trends, and reports in the Sodium Ferrocyanide, consider subscribing to industry newsletters, following relevant companies and organizations, or regularly checking reputable industry news sources and publications.
Methodology
Step 1 - Identification of Relevant Samples Size from Population Database


Step 2 - Approaches for Defining Global Market Size (Value, Volume* & Price*)

Note*: In applicable scenarios
Step 3 - Data Sources
Primary Research
- Web Analytics
- Survey Reports
- Research Institute
- Latest Research Reports
- Opinion Leaders
Secondary Research
- Annual Reports
- White Paper
- Latest Press Release
- Industry Association
- Paid Database
- Investor Presentations

Step 4 - Data Triangulation
Involves using different sources of information in order to increase the validity of a study
These sources are likely to be stakeholders in a program - participants, other researchers, program staff, other community members, and so on.
Then we put all data in single framework & apply various statistical tools to find out the dynamic on the market.
During the analysis stage, feedback from the stakeholder groups would be compared to determine areas of agreement as well as areas of divergence