

Key Insights
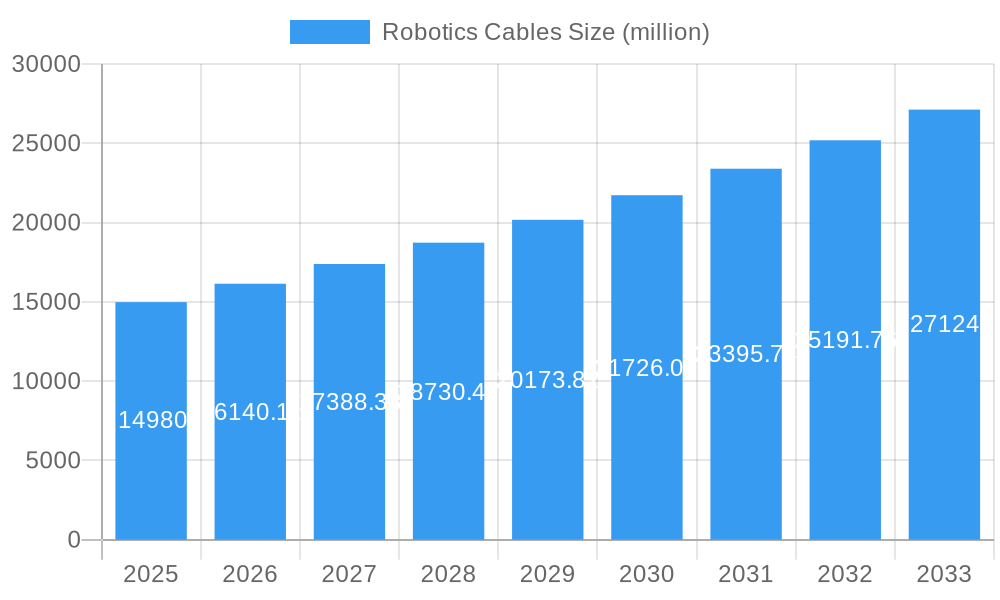
The global Robotics Cables market is poised for significant expansion, with a projected market size of USD 14.98 billion in 2025, growing at a robust Compound Annual Growth Rate (CAGR) of 7.63% through 2033. This growth is primarily propelled by the increasing adoption of automation across a multitude of industries, including manufacturing, healthcare, and logistics. The escalating demand for advanced robotics in sectors like Aerospace, Medical, and Industrial applications, driven by the need for enhanced precision, efficiency, and safety, is a critical growth factor. Furthermore, the burgeoning use of robotics in Transportation & Logistics for tasks such as warehousing, order fulfillment, and autonomous delivery systems is a major catalyst. The continuous innovation in cable technologies, focusing on higher bandwidth, increased durability, and miniaturization, is also contributing to market expansion, enabling more sophisticated and versatile robotic systems.
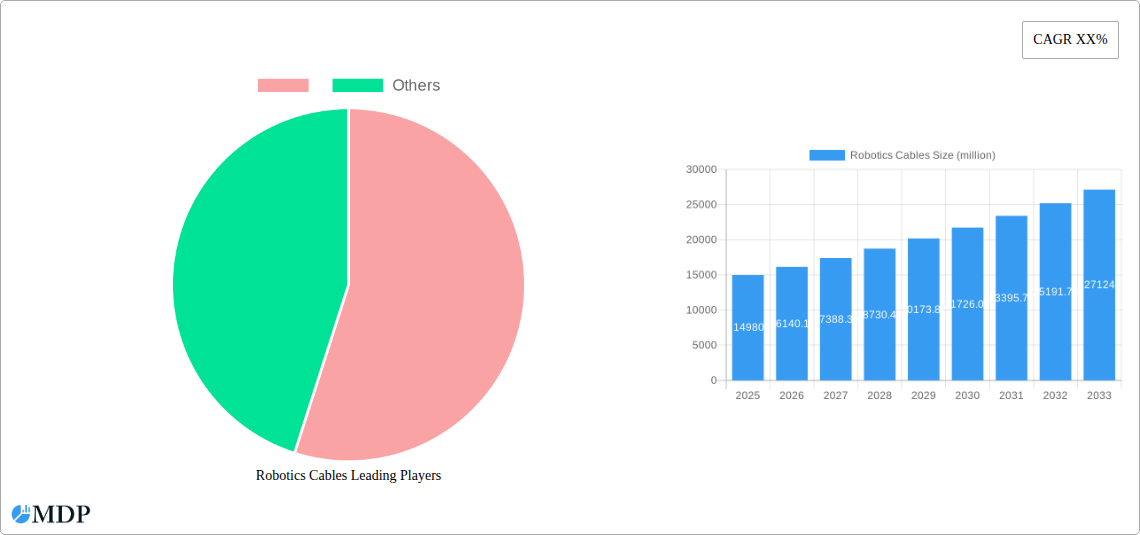
Robotics Cables Market Size (In Billion)
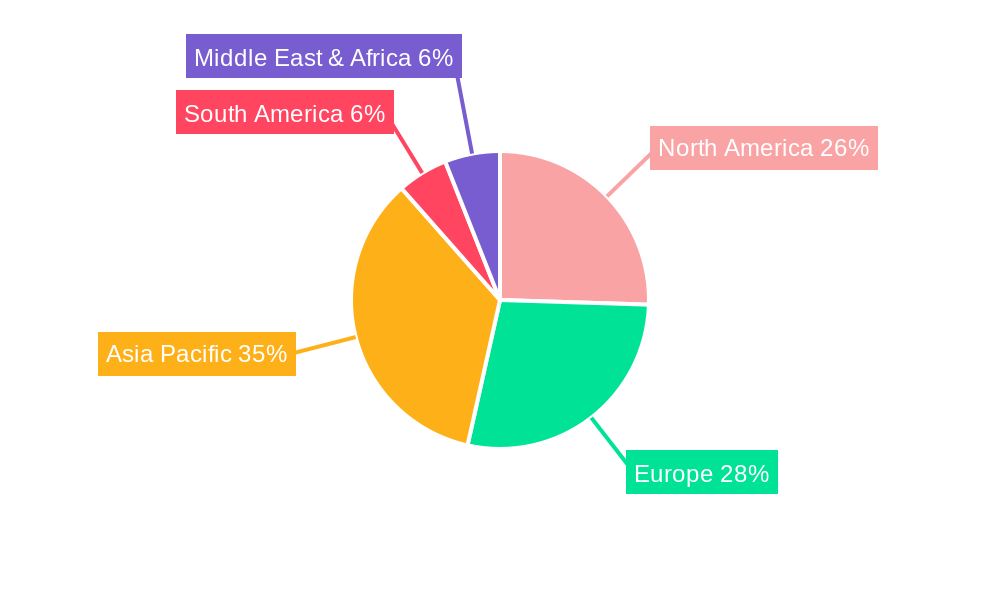
The market for Robotics Cables is characterized by a diverse range of product types catering to specific robotic functionalities. Data Cables are essential for high-speed communication and data transfer, crucial for complex robotic operations and AI integration. Control Cables are fundamental for transmitting signals and power to robotic actuators and sensors, ensuring precise movement and control. Motor Cables, designed to handle high currents and electromagnetic interference, are vital for powering robotic motors. Fibre Optic Cables are increasingly being adopted for their superior data transmission capabilities in demanding environments. Bus Cables facilitate communication between different components within a robotic system. Geographically, Asia Pacific is anticipated to lead the market due to rapid industrialization and widespread robotics adoption in countries like China and India. North America and Europe are also substantial markets, driven by technological advancements and a strong presence of leading robotics manufacturers and end-users.
Robotics Cables Company Market Share
Unlocking the Future of Automation: A Comprehensive Report on the Global Robotics Cables Market (2019-2033)
This in-depth report provides a critical analysis of the global Robotics Cables market, encompassing a comprehensive study period from 2019 to 2033, with a base and estimated year of 2025. Delve into market dynamics, innovation drivers, and the competitive landscape, uncovering trends and opportunities shaping this vital sector of industrial automation. The report is meticulously designed to equip industry stakeholders with actionable insights, leveraging high-traffic keywords to maximize search visibility and engagement within the robotics and automation ecosystem.
Robotics Cables Market Dynamics & Concentration
The global Robotics Cables market exhibits a moderate concentration, with leading players holding a significant collective market share, estimated to be in the billions. Innovation remains a primary driver, fueled by advancements in robot dexterity, speed, and operational complexity. Regulatory frameworks, particularly concerning safety standards and electromagnetic compatibility (EMC), are increasingly influencing product design and market entry. Product substitutes, though limited for specialized robotic applications, include traditional wiring solutions that are gradually being phased out in favor of integrated robotics cable systems. End-user trends point towards a growing demand for higher bandwidth, increased flexibility, and robust durability in robotics cabling across various applications. Mergers and acquisitions (M&A) activities, although not at an astronomical rate, are strategic, with an estimated XX deal counts observed during the historical period, aimed at consolidating market presence and expanding product portfolios. These activities often involve companies seeking to enhance their offerings in specialized cable types such as Fibre Optic Cables or Bus Cables.
Robotics Cables Industry Trends & Analysis
The Robotics Cables industry is experiencing robust growth, driven by the pervasive adoption of automation across diverse sectors. The compound annual growth rate (CAGR) for this market is projected to be in the high single digits, potentially reaching billions in market value by the forecast period. Technological disruptions, including the integration of AI, machine learning, and the Industrial Internet of Things (IIoT) into robotic systems, are creating a demand for sophisticated cabling solutions capable of handling increased data transmission and complex control signals. Consumer preferences are shifting towards highly integrated, plug-and-play cable assemblies that simplify installation and maintenance, reducing downtime. Competitive dynamics are characterized by both established manufacturers and emerging players focusing on specialized niches, such as high-flexibility motor cables or ruggedized data cables for harsh industrial environments. Market penetration of advanced robotics cables continues to rise, as industries recognize the critical role these components play in the overall performance and reliability of automated systems. The drive for greater efficiency and precision in manufacturing, coupled with the increasing labor costs, are significant market growth drivers.
Leading Markets & Segments in Robotics Cables
The Industrial segment stands as a dominant force in the Robotics Cables market, largely propelled by widespread automation in manufacturing, automotive, and electronics production. Within this segment, Control Cables and Motor Cables are experiencing significant demand due to the increasing sophistication of industrial robots requiring precise movement and power transmission. Economical policies promoting industrial expansion and investments in smart factory initiatives are key drivers of this dominance. Geographically, Asia-Pacific is the leading region, with countries like China and South Korea at the forefront of robotic adoption and manufacturing, contributing billions to the regional market. The Transportation & Logistics segment is a rapidly growing application, fueled by the rise of automated warehouses, autonomous vehicles, and material handling systems, demanding robust and high-speed Data Cables and Bus Cables. In Aerospace, the need for lightweight, high-performance Fibre Optic Cables for data transmission and control in robotic assembly and inspection is a significant growth factor. The Medical sector is increasingly integrating robotics for surgery, diagnostics, and rehabilitation, driving demand for sterile and biocompatible robotics cables with exceptional reliability.
Robotics Cables Product Developments
Product innovation in the Robotics Cables sector is centered on enhancing performance, durability, and ease of integration. Manufacturers are developing ultra-flexible, high-bend-cycle cables that can withstand millions of movements, crucial for collaborative robots and high-speed automation. Advancements in material science are leading to cables with improved resistance to extreme temperatures, chemicals, and abrasion, expanding their applicability in harsh environments. The integration of smart functionalities within cables, such as embedded sensors for condition monitoring, is a burgeoning trend, offering predictive maintenance capabilities. These developments provide a competitive advantage by enabling robotic systems to operate more reliably, efficiently, and in a wider range of conditions, contributing to increased operational uptime and reduced total cost of ownership, with market impact in the billions.
Key Drivers of Robotics Cables Growth
Several key factors are propelling the growth of the Robotics Cables market. Technological advancements in robotic systems themselves necessitate increasingly sophisticated cabling solutions for higher data rates, increased signal integrity, and enhanced flexibility. The global push towards Industry 4.0 and the adoption of smart factory concepts are driving significant investment in automation, directly boosting the demand for robotics cables. Economic factors, including rising labor costs and the need for increased productivity, make automation an attractive proposition for businesses across sectors. Furthermore, evolving regulatory landscapes that emphasize safety and efficiency in automated systems are indirectly encouraging the use of high-quality, standardized robotics cables.
Challenges in the Robotics Cables Market
Despite robust growth, the Robotics Cables market faces several challenges. Stringent regulatory compliance for different regions and applications can increase development costs and time-to-market. Supply chain disruptions, as evidenced by recent global events, can impact the availability of raw materials and components, leading to price volatility and potential production delays, with quantifiable impacts in the billions. Intense competition among manufacturers, particularly in price-sensitive segments, can squeeze profit margins. The rapid pace of technological change also presents a challenge, requiring continuous R&D investment to keep pace with evolving robotic system requirements, posing a significant hurdle for smaller players.
Emerging Opportunities in Robotics Cables
Emerging opportunities in the Robotics Cables market are abundant, driven by several catalysts. The expanding use of collaborative robots (cobots) in human-robot interaction scenarios requires specialized cables that are safe, flexible, and compact. The growing adoption of robotics in emerging economies and developing nations presents a significant untapped market potential. Strategic partnerships between robotics manufacturers and cable suppliers are fostering co-development of integrated solutions, leading to more efficient and cost-effective robotic systems. Furthermore, the increasing demand for robotics in unconventional applications like agriculture, construction, and underwater exploration opens up new avenues for specialized cable designs and materials, promising billions in future revenue.
Leading Players in the Robotics Cables Sector
- ABB
- KUKA
- FANUC
- Yaskawa Electric
- Siemens
- Rockwell Automation
- TE Connectivity
- Lapp Kabel
- Prysmian Group
- Sumitomo Electric Industries
- Belden
- Helukabel
- Alpha Wire
- Igus
Key Milestones in Robotics Cables Industry
- 2019: Increased focus on high-flexibility and drag-chain-compatible robotics cables to support advanced automation.
- 2020: Growing adoption of Ethernet-based industrial networks (e.g., EtherNet/IP, PROFINET) driving demand for robust industrial Ethernet robotics cables.
- 2021: Significant supply chain challenges impacting raw material availability and pricing for cable components.
- 2022: Rise of collaborative robots (cobots) spurs demand for safer and more compact robotics cable solutions.
- 2023: Advancements in Fibre Optic Cables for robotics, enabling higher bandwidth and faster data transfer for complex robotic operations.
- 2024: Growing interest in integrated cable assemblies with built-in sensors for condition monitoring and predictive maintenance.
- 2025: Continued strong growth in industrial automation, particularly in the Asia-Pacific region, fueling market expansion.
Strategic Outlook for Robotics Cables Market
The strategic outlook for the Robotics Cables market is exceptionally positive, driven by an accelerating global trend towards automation and the continuous evolution of robotic technology. Future growth will be significantly influenced by the development of more intelligent and autonomous robotic systems, which will demand cables with enhanced data handling capabilities and greater resilience. Opportunities lie in expanding into new application areas such as autonomous mobile robots (AMRs) in logistics and the growing use of robotics in sustainable energy sectors. Strategic investments in R&D for next-generation materials and miniaturized, high-performance cabling solutions will be crucial for market leaders to maintain their competitive edge and capitalize on the projected market expansion, expected to reach trillions in value.
Robotics Cables Segmentation
-
1. Application
- 1.1. Transportation & Logistics
- 1.2. Aerospace
- 1.3. Medical
- 1.4. Industrial
-
2. Types
- 2.1. Data Cables
- 2.2. Control Cables
- 2.3. Motor Cables
- 2.4. Fibre Optic Cables
- 2.5. Bus Cables
Robotics Cables Segmentation By Geography
-
1. North America
- 1.1. United States
- 1.2. Canada
- 1.3. Mexico
-
2. South America
- 2.1. Brazil
- 2.2. Argentina
- 2.3. Rest of South America
-
3. Europe
- 3.1. United Kingdom
- 3.2. Germany
- 3.3. France
- 3.4. Italy
- 3.5. Spain
- 3.6. Russia
- 3.7. Benelux
- 3.8. Nordics
- 3.9. Rest of Europe
-
4. Middle East & Africa
- 4.1. Turkey
- 4.2. Israel
- 4.3. GCC
- 4.4. North Africa
- 4.5. South Africa
- 4.6. Rest of Middle East & Africa
-
5. Asia Pacific
- 5.1. China
- 5.2. India
- 5.3. Japan
- 5.4. South Korea
- 5.5. ASEAN
- 5.6. Oceania
- 5.7. Rest of Asia Pacific
Robotics Cables Regional Market Share
Geographic Coverage of Robotics Cables
Robotics Cables REPORT HIGHLIGHTS
| Aspects | Details |
|---|---|
| Study Period | 2020-2034 |
| Base Year | 2025 |
| Estimated Year | 2026 |
| Forecast Period | 2026-2034 |
| Historical Period | 2020-2025 |
| Growth Rate | CAGR of 7.9% from 2020-2034 |
| Segmentation |
|
Table of Contents
- 1. Introduction
- 1.1. Research Scope
- 1.2. Market Segmentation
- 1.3. Research Objective
- 1.4. Definitions and Assumptions
- 2. Executive Summary
- 2.1. Market Snapshot
- 3. Market Dynamics
- 3.1. Market Drivers
- 3.2. Market Restrains
- 3.3. Market Trends
- 3.4. Market Opportunities
- 4. Market Factor Analysis
- 4.1. Porters Five Forces
- 4.1.1. Bargaining Power of Suppliers
- 4.1.2. Bargaining Power of Buyers
- 4.1.3. Threat of New Entrants
- 4.1.4. Threat of Substitutes
- 4.1.5. Competitive Rivalry
- 4.2. PESTEL analysis
- 4.3. BCG Analysis
- 4.3.1. Stars (High Growth, High Market Share)
- 4.3.2. Cash Cows (Low Growth, High Market Share)
- 4.3.3. Question Mark (High Growth, Low Market Share)
- 4.3.4. Dogs (Low Growth, Low Market Share)
- 4.4. Ansoff Matrix Analysis
- 4.5. Supply Chain Analysis
- 4.6. Regulatory Landscape
- 4.7. Current Market Potential and Opportunity Assessment (TAM–SAM–SOM Framework)
- 4.8. MDP Analyst Note
- 4.1. Porters Five Forces
- 5. Market Analysis, Insights and Forecast 2021-2033
- 5.1. Market Analysis, Insights and Forecast - by Application
- 5.1.1. Transportation & Logistics
- 5.1.2. Aerospace
- 5.1.3. Medical
- 5.1.4. Industrial
- 5.2. Market Analysis, Insights and Forecast - by Types
- 5.2.1. Data Cables
- 5.2.2. Control Cables
- 5.2.3. Motor Cables
- 5.2.4. Fibre Optic Cables
- 5.2.5. Bus Cables
- 5.3. Market Analysis, Insights and Forecast - by Region
- 5.3.1. North America
- 5.3.2. South America
- 5.3.3. Europe
- 5.3.4. Middle East & Africa
- 5.3.5. Asia Pacific
- 5.1. Market Analysis, Insights and Forecast - by Application
- 6. Global Robotics Cables Analysis, Insights and Forecast, 2021-2033
- 6.1. Market Analysis, Insights and Forecast - by Application
- 6.1.1. Transportation & Logistics
- 6.1.2. Aerospace
- 6.1.3. Medical
- 6.1.4. Industrial
- 6.2. Market Analysis, Insights and Forecast - by Types
- 6.2.1. Data Cables
- 6.2.2. Control Cables
- 6.2.3. Motor Cables
- 6.2.4. Fibre Optic Cables
- 6.2.5. Bus Cables
- 6.1. Market Analysis, Insights and Forecast - by Application
- 7. North America Robotics Cables Analysis, Insights and Forecast, 2020-2032
- 7.1. Market Analysis, Insights and Forecast - by Application
- 7.1.1. Transportation & Logistics
- 7.1.2. Aerospace
- 7.1.3. Medical
- 7.1.4. Industrial
- 7.2. Market Analysis, Insights and Forecast - by Types
- 7.2.1. Data Cables
- 7.2.2. Control Cables
- 7.2.3. Motor Cables
- 7.2.4. Fibre Optic Cables
- 7.2.5. Bus Cables
- 7.1. Market Analysis, Insights and Forecast - by Application
- 8. South America Robotics Cables Analysis, Insights and Forecast, 2020-2032
- 8.1. Market Analysis, Insights and Forecast - by Application
- 8.1.1. Transportation & Logistics
- 8.1.2. Aerospace
- 8.1.3. Medical
- 8.1.4. Industrial
- 8.2. Market Analysis, Insights and Forecast - by Types
- 8.2.1. Data Cables
- 8.2.2. Control Cables
- 8.2.3. Motor Cables
- 8.2.4. Fibre Optic Cables
- 8.2.5. Bus Cables
- 8.1. Market Analysis, Insights and Forecast - by Application
- 9. Europe Robotics Cables Analysis, Insights and Forecast, 2020-2032
- 9.1. Market Analysis, Insights and Forecast - by Application
- 9.1.1. Transportation & Logistics
- 9.1.2. Aerospace
- 9.1.3. Medical
- 9.1.4. Industrial
- 9.2. Market Analysis, Insights and Forecast - by Types
- 9.2.1. Data Cables
- 9.2.2. Control Cables
- 9.2.3. Motor Cables
- 9.2.4. Fibre Optic Cables
- 9.2.5. Bus Cables
- 9.1. Market Analysis, Insights and Forecast - by Application
- 10. Middle East & Africa Robotics Cables Analysis, Insights and Forecast, 2020-2032
- 10.1. Market Analysis, Insights and Forecast - by Application
- 10.1.1. Transportation & Logistics
- 10.1.2. Aerospace
- 10.1.3. Medical
- 10.1.4. Industrial
- 10.2. Market Analysis, Insights and Forecast - by Types
- 10.2.1. Data Cables
- 10.2.2. Control Cables
- 10.2.3. Motor Cables
- 10.2.4. Fibre Optic Cables
- 10.2.5. Bus Cables
- 10.1. Market Analysis, Insights and Forecast - by Application
- 11. Asia Pacific Robotics Cables Analysis, Insights and Forecast, 2020-2032
- 11.1. Market Analysis, Insights and Forecast - by Application
- 11.1.1. Transportation & Logistics
- 11.1.2. Aerospace
- 11.1.3. Medical
- 11.1.4. Industrial
- 11.2. Market Analysis, Insights and Forecast - by Types
- 11.2.1. Data Cables
- 11.2.2. Control Cables
- 11.2.3. Motor Cables
- 11.2.4. Fibre Optic Cables
- 11.2.5. Bus Cables
- 11.1. Market Analysis, Insights and Forecast - by Application
- 12. Competitive Analysis
- 12.1. Company Profiles
- 12.2. Market Entropy
- 12.2.1 Company's Key Areas Served
- 12.2.2 Recent Developments
- 12.3. Company Market Share Analysis 2025
- 12.3.1 Top 5 Companies Market Share Analysis
- 12.3.2 Top 3 Companies Market Share Analysis
- 12.4. List of Potential Customers
- 13. Research Methodology
List of Figures
- Figure 1: Global Robotics Cables Revenue Breakdown (billion, %) by Region 2025 & 2033
- Figure 2: Global Robotics Cables Volume Breakdown (K, %) by Region 2025 & 2033
- Figure 3: North America Robotics Cables Revenue (billion), by Application 2025 & 2033
- Figure 4: North America Robotics Cables Volume (K), by Application 2025 & 2033
- Figure 5: North America Robotics Cables Revenue Share (%), by Application 2025 & 2033
- Figure 6: North America Robotics Cables Volume Share (%), by Application 2025 & 2033
- Figure 7: North America Robotics Cables Revenue (billion), by Types 2025 & 2033
- Figure 8: North America Robotics Cables Volume (K), by Types 2025 & 2033
- Figure 9: North America Robotics Cables Revenue Share (%), by Types 2025 & 2033
- Figure 10: North America Robotics Cables Volume Share (%), by Types 2025 & 2033
- Figure 11: North America Robotics Cables Revenue (billion), by Country 2025 & 2033
- Figure 12: North America Robotics Cables Volume (K), by Country 2025 & 2033
- Figure 13: North America Robotics Cables Revenue Share (%), by Country 2025 & 2033
- Figure 14: North America Robotics Cables Volume Share (%), by Country 2025 & 2033
- Figure 15: South America Robotics Cables Revenue (billion), by Application 2025 & 2033
- Figure 16: South America Robotics Cables Volume (K), by Application 2025 & 2033
- Figure 17: South America Robotics Cables Revenue Share (%), by Application 2025 & 2033
- Figure 18: South America Robotics Cables Volume Share (%), by Application 2025 & 2033
- Figure 19: South America Robotics Cables Revenue (billion), by Types 2025 & 2033
- Figure 20: South America Robotics Cables Volume (K), by Types 2025 & 2033
- Figure 21: South America Robotics Cables Revenue Share (%), by Types 2025 & 2033
- Figure 22: South America Robotics Cables Volume Share (%), by Types 2025 & 2033
- Figure 23: South America Robotics Cables Revenue (billion), by Country 2025 & 2033
- Figure 24: South America Robotics Cables Volume (K), by Country 2025 & 2033
- Figure 25: South America Robotics Cables Revenue Share (%), by Country 2025 & 2033
- Figure 26: South America Robotics Cables Volume Share (%), by Country 2025 & 2033
- Figure 27: Europe Robotics Cables Revenue (billion), by Application 2025 & 2033
- Figure 28: Europe Robotics Cables Volume (K), by Application 2025 & 2033
- Figure 29: Europe Robotics Cables Revenue Share (%), by Application 2025 & 2033
- Figure 30: Europe Robotics Cables Volume Share (%), by Application 2025 & 2033
- Figure 31: Europe Robotics Cables Revenue (billion), by Types 2025 & 2033
- Figure 32: Europe Robotics Cables Volume (K), by Types 2025 & 2033
- Figure 33: Europe Robotics Cables Revenue Share (%), by Types 2025 & 2033
- Figure 34: Europe Robotics Cables Volume Share (%), by Types 2025 & 2033
- Figure 35: Europe Robotics Cables Revenue (billion), by Country 2025 & 2033
- Figure 36: Europe Robotics Cables Volume (K), by Country 2025 & 2033
- Figure 37: Europe Robotics Cables Revenue Share (%), by Country 2025 & 2033
- Figure 38: Europe Robotics Cables Volume Share (%), by Country 2025 & 2033
- Figure 39: Middle East & Africa Robotics Cables Revenue (billion), by Application 2025 & 2033
- Figure 40: Middle East & Africa Robotics Cables Volume (K), by Application 2025 & 2033
- Figure 41: Middle East & Africa Robotics Cables Revenue Share (%), by Application 2025 & 2033
- Figure 42: Middle East & Africa Robotics Cables Volume Share (%), by Application 2025 & 2033
- Figure 43: Middle East & Africa Robotics Cables Revenue (billion), by Types 2025 & 2033
- Figure 44: Middle East & Africa Robotics Cables Volume (K), by Types 2025 & 2033
- Figure 45: Middle East & Africa Robotics Cables Revenue Share (%), by Types 2025 & 2033
- Figure 46: Middle East & Africa Robotics Cables Volume Share (%), by Types 2025 & 2033
- Figure 47: Middle East & Africa Robotics Cables Revenue (billion), by Country 2025 & 2033
- Figure 48: Middle East & Africa Robotics Cables Volume (K), by Country 2025 & 2033
- Figure 49: Middle East & Africa Robotics Cables Revenue Share (%), by Country 2025 & 2033
- Figure 50: Middle East & Africa Robotics Cables Volume Share (%), by Country 2025 & 2033
- Figure 51: Asia Pacific Robotics Cables Revenue (billion), by Application 2025 & 2033
- Figure 52: Asia Pacific Robotics Cables Volume (K), by Application 2025 & 2033
- Figure 53: Asia Pacific Robotics Cables Revenue Share (%), by Application 2025 & 2033
- Figure 54: Asia Pacific Robotics Cables Volume Share (%), by Application 2025 & 2033
- Figure 55: Asia Pacific Robotics Cables Revenue (billion), by Types 2025 & 2033
- Figure 56: Asia Pacific Robotics Cables Volume (K), by Types 2025 & 2033
- Figure 57: Asia Pacific Robotics Cables Revenue Share (%), by Types 2025 & 2033
- Figure 58: Asia Pacific Robotics Cables Volume Share (%), by Types 2025 & 2033
- Figure 59: Asia Pacific Robotics Cables Revenue (billion), by Country 2025 & 2033
- Figure 60: Asia Pacific Robotics Cables Volume (K), by Country 2025 & 2033
- Figure 61: Asia Pacific Robotics Cables Revenue Share (%), by Country 2025 & 2033
- Figure 62: Asia Pacific Robotics Cables Volume Share (%), by Country 2025 & 2033
List of Tables
- Table 1: Global Robotics Cables Revenue billion Forecast, by Application 2020 & 2033
- Table 2: Global Robotics Cables Volume K Forecast, by Application 2020 & 2033
- Table 3: Global Robotics Cables Revenue billion Forecast, by Types 2020 & 2033
- Table 4: Global Robotics Cables Volume K Forecast, by Types 2020 & 2033
- Table 5: Global Robotics Cables Revenue billion Forecast, by Region 2020 & 2033
- Table 6: Global Robotics Cables Volume K Forecast, by Region 2020 & 2033
- Table 7: Global Robotics Cables Revenue billion Forecast, by Application 2020 & 2033
- Table 8: Global Robotics Cables Volume K Forecast, by Application 2020 & 2033
- Table 9: Global Robotics Cables Revenue billion Forecast, by Types 2020 & 2033
- Table 10: Global Robotics Cables Volume K Forecast, by Types 2020 & 2033
- Table 11: Global Robotics Cables Revenue billion Forecast, by Country 2020 & 2033
- Table 12: Global Robotics Cables Volume K Forecast, by Country 2020 & 2033
- Table 13: United States Robotics Cables Revenue (billion) Forecast, by Application 2020 & 2033
- Table 14: United States Robotics Cables Volume (K) Forecast, by Application 2020 & 2033
- Table 15: Canada Robotics Cables Revenue (billion) Forecast, by Application 2020 & 2033
- Table 16: Canada Robotics Cables Volume (K) Forecast, by Application 2020 & 2033
- Table 17: Mexico Robotics Cables Revenue (billion) Forecast, by Application 2020 & 2033
- Table 18: Mexico Robotics Cables Volume (K) Forecast, by Application 2020 & 2033
- Table 19: Global Robotics Cables Revenue billion Forecast, by Application 2020 & 2033
- Table 20: Global Robotics Cables Volume K Forecast, by Application 2020 & 2033
- Table 21: Global Robotics Cables Revenue billion Forecast, by Types 2020 & 2033
- Table 22: Global Robotics Cables Volume K Forecast, by Types 2020 & 2033
- Table 23: Global Robotics Cables Revenue billion Forecast, by Country 2020 & 2033
- Table 24: Global Robotics Cables Volume K Forecast, by Country 2020 & 2033
- Table 25: Brazil Robotics Cables Revenue (billion) Forecast, by Application 2020 & 2033
- Table 26: Brazil Robotics Cables Volume (K) Forecast, by Application 2020 & 2033
- Table 27: Argentina Robotics Cables Revenue (billion) Forecast, by Application 2020 & 2033
- Table 28: Argentina Robotics Cables Volume (K) Forecast, by Application 2020 & 2033
- Table 29: Rest of South America Robotics Cables Revenue (billion) Forecast, by Application 2020 & 2033
- Table 30: Rest of South America Robotics Cables Volume (K) Forecast, by Application 2020 & 2033
- Table 31: Global Robotics Cables Revenue billion Forecast, by Application 2020 & 2033
- Table 32: Global Robotics Cables Volume K Forecast, by Application 2020 & 2033
- Table 33: Global Robotics Cables Revenue billion Forecast, by Types 2020 & 2033
- Table 34: Global Robotics Cables Volume K Forecast, by Types 2020 & 2033
- Table 35: Global Robotics Cables Revenue billion Forecast, by Country 2020 & 2033
- Table 36: Global Robotics Cables Volume K Forecast, by Country 2020 & 2033
- Table 37: United Kingdom Robotics Cables Revenue (billion) Forecast, by Application 2020 & 2033
- Table 38: United Kingdom Robotics Cables Volume (K) Forecast, by Application 2020 & 2033
- Table 39: Germany Robotics Cables Revenue (billion) Forecast, by Application 2020 & 2033
- Table 40: Germany Robotics Cables Volume (K) Forecast, by Application 2020 & 2033
- Table 41: France Robotics Cables Revenue (billion) Forecast, by Application 2020 & 2033
- Table 42: France Robotics Cables Volume (K) Forecast, by Application 2020 & 2033
- Table 43: Italy Robotics Cables Revenue (billion) Forecast, by Application 2020 & 2033
- Table 44: Italy Robotics Cables Volume (K) Forecast, by Application 2020 & 2033
- Table 45: Spain Robotics Cables Revenue (billion) Forecast, by Application 2020 & 2033
- Table 46: Spain Robotics Cables Volume (K) Forecast, by Application 2020 & 2033
- Table 47: Russia Robotics Cables Revenue (billion) Forecast, by Application 2020 & 2033
- Table 48: Russia Robotics Cables Volume (K) Forecast, by Application 2020 & 2033
- Table 49: Benelux Robotics Cables Revenue (billion) Forecast, by Application 2020 & 2033
- Table 50: Benelux Robotics Cables Volume (K) Forecast, by Application 2020 & 2033
- Table 51: Nordics Robotics Cables Revenue (billion) Forecast, by Application 2020 & 2033
- Table 52: Nordics Robotics Cables Volume (K) Forecast, by Application 2020 & 2033
- Table 53: Rest of Europe Robotics Cables Revenue (billion) Forecast, by Application 2020 & 2033
- Table 54: Rest of Europe Robotics Cables Volume (K) Forecast, by Application 2020 & 2033
- Table 55: Global Robotics Cables Revenue billion Forecast, by Application 2020 & 2033
- Table 56: Global Robotics Cables Volume K Forecast, by Application 2020 & 2033
- Table 57: Global Robotics Cables Revenue billion Forecast, by Types 2020 & 2033
- Table 58: Global Robotics Cables Volume K Forecast, by Types 2020 & 2033
- Table 59: Global Robotics Cables Revenue billion Forecast, by Country 2020 & 2033
- Table 60: Global Robotics Cables Volume K Forecast, by Country 2020 & 2033
- Table 61: Turkey Robotics Cables Revenue (billion) Forecast, by Application 2020 & 2033
- Table 62: Turkey Robotics Cables Volume (K) Forecast, by Application 2020 & 2033
- Table 63: Israel Robotics Cables Revenue (billion) Forecast, by Application 2020 & 2033
- Table 64: Israel Robotics Cables Volume (K) Forecast, by Application 2020 & 2033
- Table 65: GCC Robotics Cables Revenue (billion) Forecast, by Application 2020 & 2033
- Table 66: GCC Robotics Cables Volume (K) Forecast, by Application 2020 & 2033
- Table 67: North Africa Robotics Cables Revenue (billion) Forecast, by Application 2020 & 2033
- Table 68: North Africa Robotics Cables Volume (K) Forecast, by Application 2020 & 2033
- Table 69: South Africa Robotics Cables Revenue (billion) Forecast, by Application 2020 & 2033
- Table 70: South Africa Robotics Cables Volume (K) Forecast, by Application 2020 & 2033
- Table 71: Rest of Middle East & Africa Robotics Cables Revenue (billion) Forecast, by Application 2020 & 2033
- Table 72: Rest of Middle East & Africa Robotics Cables Volume (K) Forecast, by Application 2020 & 2033
- Table 73: Global Robotics Cables Revenue billion Forecast, by Application 2020 & 2033
- Table 74: Global Robotics Cables Volume K Forecast, by Application 2020 & 2033
- Table 75: Global Robotics Cables Revenue billion Forecast, by Types 2020 & 2033
- Table 76: Global Robotics Cables Volume K Forecast, by Types 2020 & 2033
- Table 77: Global Robotics Cables Revenue billion Forecast, by Country 2020 & 2033
- Table 78: Global Robotics Cables Volume K Forecast, by Country 2020 & 2033
- Table 79: China Robotics Cables Revenue (billion) Forecast, by Application 2020 & 2033
- Table 80: China Robotics Cables Volume (K) Forecast, by Application 2020 & 2033
- Table 81: India Robotics Cables Revenue (billion) Forecast, by Application 2020 & 2033
- Table 82: India Robotics Cables Volume (K) Forecast, by Application 2020 & 2033
- Table 83: Japan Robotics Cables Revenue (billion) Forecast, by Application 2020 & 2033
- Table 84: Japan Robotics Cables Volume (K) Forecast, by Application 2020 & 2033
- Table 85: South Korea Robotics Cables Revenue (billion) Forecast, by Application 2020 & 2033
- Table 86: South Korea Robotics Cables Volume (K) Forecast, by Application 2020 & 2033
- Table 87: ASEAN Robotics Cables Revenue (billion) Forecast, by Application 2020 & 2033
- Table 88: ASEAN Robotics Cables Volume (K) Forecast, by Application 2020 & 2033
- Table 89: Oceania Robotics Cables Revenue (billion) Forecast, by Application 2020 & 2033
- Table 90: Oceania Robotics Cables Volume (K) Forecast, by Application 2020 & 2033
- Table 91: Rest of Asia Pacific Robotics Cables Revenue (billion) Forecast, by Application 2020 & 2033
- Table 92: Rest of Asia Pacific Robotics Cables Volume (K) Forecast, by Application 2020 & 2033
Frequently Asked Questions
1. What is the projected Compound Annual Growth Rate (CAGR) of the Robotics Cables?
The projected CAGR is approximately 7.9%.
2. Which companies are prominent players in the Robotics Cables?
Key companies in the market include N/A.
3. What are the main segments of the Robotics Cables?
The market segments include Application, Types.
4. Can you provide details about the market size?
The market size is estimated to be USD 1.4 billion as of 2022.
5. What are some drivers contributing to market growth?
N/A
6. What are the notable trends driving market growth?
N/A
7. Are there any restraints impacting market growth?
N/A
8. Can you provide examples of recent developments in the market?
N/A
9. What pricing options are available for accessing the report?
Pricing options include single-user, multi-user, and enterprise licenses priced at USD 3950.00, USD 5925.00, and USD 7900.00 respectively.
10. Is the market size provided in terms of value or volume?
The market size is provided in terms of value, measured in billion and volume, measured in K.
11. Are there any specific market keywords associated with the report?
Yes, the market keyword associated with the report is "Robotics Cables," which aids in identifying and referencing the specific market segment covered.
12. How do I determine which pricing option suits my needs best?
The pricing options vary based on user requirements and access needs. Individual users may opt for single-user licenses, while businesses requiring broader access may choose multi-user or enterprise licenses for cost-effective access to the report.
13. Are there any additional resources or data provided in the Robotics Cables report?
While the report offers comprehensive insights, it's advisable to review the specific contents or supplementary materials provided to ascertain if additional resources or data are available.
14. How can I stay updated on further developments or reports in the Robotics Cables?
To stay informed about further developments, trends, and reports in the Robotics Cables, consider subscribing to industry newsletters, following relevant companies and organizations, or regularly checking reputable industry news sources and publications.
Methodology
Step 1 - Identification of Relevant Samples Size from Population Database


Step 2 - Approaches for Defining Global Market Size (Value, Volume* & Price*)

Note*: In applicable scenarios
Step 3 - Data Sources
Primary Research
- Web Analytics
- Survey Reports
- Research Institute
- Latest Research Reports
- Opinion Leaders
Secondary Research
- Annual Reports
- White Paper
- Latest Press Release
- Industry Association
- Paid Database
- Investor Presentations

Step 4 - Data Triangulation
Involves using different sources of information in order to increase the validity of a study
These sources are likely to be stakeholders in a program - participants, other researchers, program staff, other community members, and so on.
Then we put all data in single framework & apply various statistical tools to find out the dynamic on the market.
During the analysis stage, feedback from the stakeholder groups would be compared to determine areas of agreement as well as areas of divergence