

Key Insights
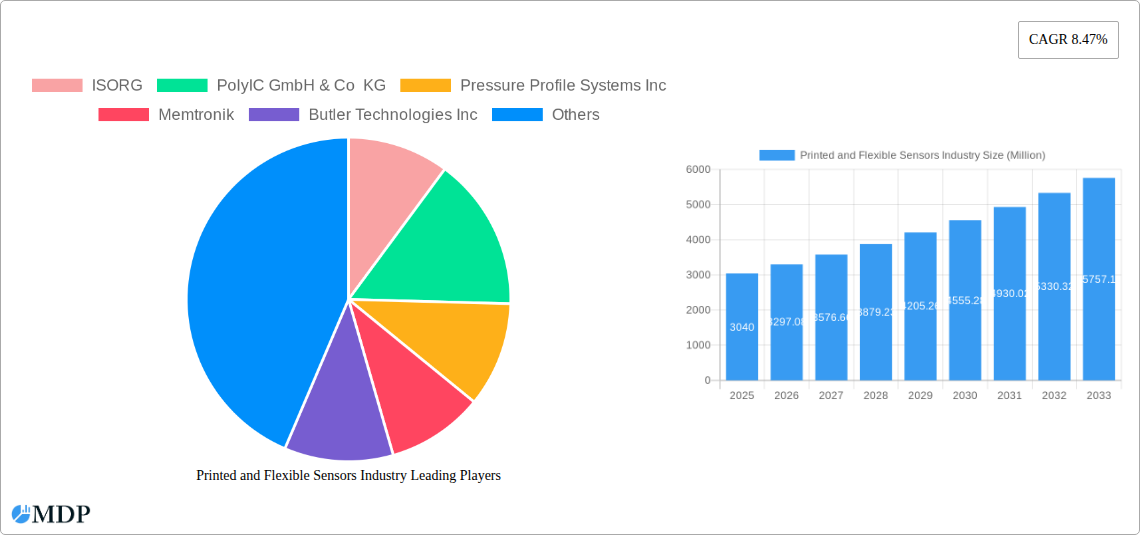
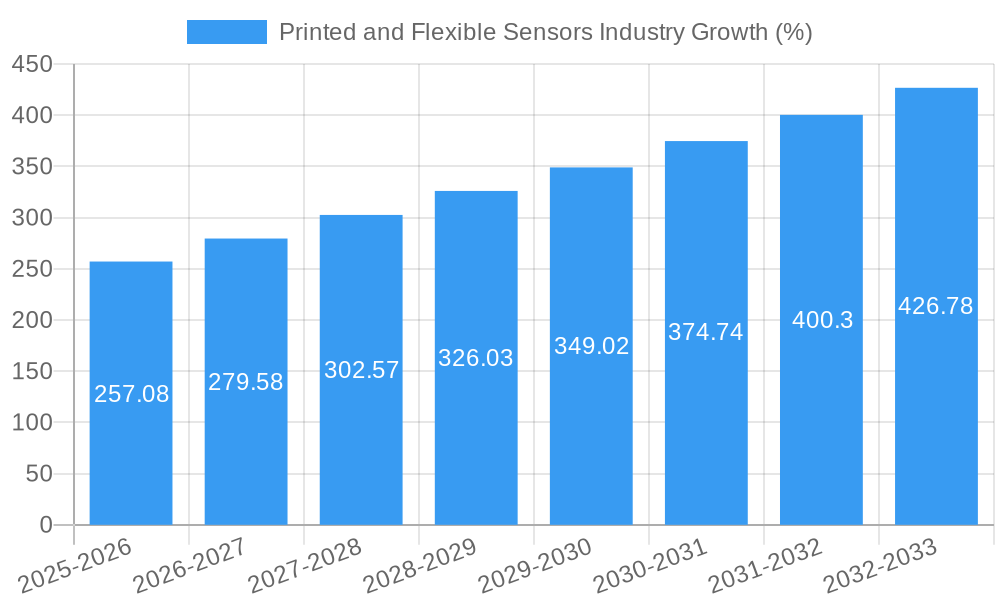
The printed and flexible sensors market is experiencing robust growth, projected to reach a market size of $3.04 billion in 2025 and exhibiting a Compound Annual Growth Rate (CAGR) of 8.47% from 2025 to 2033. This expansion is driven by several key factors. The increasing demand for miniaturized and lightweight electronics across various sectors, including consumer electronics (wearable technology, smartphones), automotive (advanced driver-assistance systems, in-cabin monitoring), and medical and healthcare (diagnostic tools, implantable sensors), is a major catalyst. Furthermore, the inherent advantages of printed and flexible sensors, such as their low cost, flexibility, and ease of integration into complex shapes and surfaces, are making them increasingly attractive alternatives to traditional rigid sensors. Technological advancements, including improved printing techniques and the development of novel sensor materials, are further fueling market growth. The diverse range of sensor types, encompassing biosensors, touch sensors, photodetectors, temperature sensors, and pressure sensors, caters to a wide spectrum of applications, enhancing market versatility. While challenges remain regarding long-term durability and scalability of manufacturing processes, ongoing research and development efforts are actively addressing these limitations.
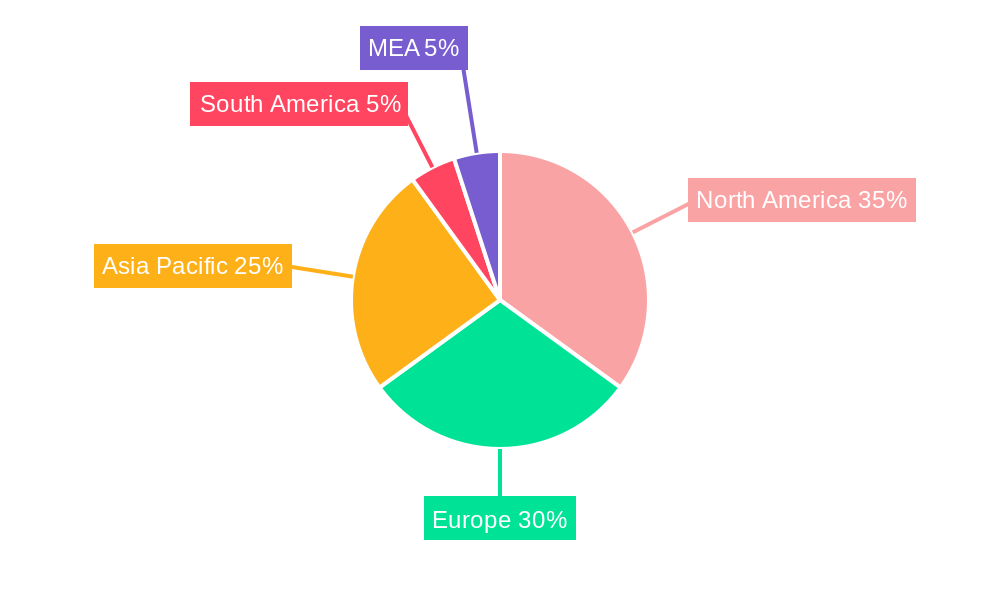
Significant regional variations in market penetration are expected. North America and Europe currently hold substantial market shares due to established technological infrastructure and strong demand from various end-user industries. However, the Asia-Pacific region is poised for rapid growth, fueled by the burgeoning electronics manufacturing sector in countries like China, Japan, and South Korea. The burgeoning medical and healthcare sector globally, coupled with the increasing adoption of flexible electronics in automotive applications, presents substantial opportunities for market expansion in the coming years. Competitive landscape analysis reveals a mix of established players and emerging companies, driving innovation and fostering competition within the market. The long-term forecast anticipates continued market expansion, driven by sustained technological advancements, diversification of applications, and increasing global demand.
Printed and Flexible Sensors Industry Market Report: 2019-2033
This comprehensive report provides an in-depth analysis of the Printed and Flexible Sensors industry, offering invaluable insights for stakeholders seeking to navigate this dynamic market. The study period covers 2019-2033, with a base year of 2025 and a forecast period spanning 2025-2033. The report incorporates data from the historical period (2019-2024) and leverages extensive market research to present a clear and actionable strategic outlook. Expect detailed breakdowns of market segments, leading players, and key industry trends, supported by compelling data and insightful analysis. The report's analysis covers a market valued at xx Million in 2025, projected to reach xx Million by 2033.
Printed and Flexible Sensors Industry Market Dynamics & Concentration
The Printed and Flexible Sensors market is characterized by a moderately concentrated landscape, with key players vying for market share through innovation and strategic acquisitions. The market concentration ratio (CR5) in 2025 is estimated at xx%, indicating a relatively competitive environment. Several factors drive innovation within this sector, including the increasing demand for miniaturized, flexible, and cost-effective sensors across diverse applications. Regulatory frameworks, particularly those related to safety and data privacy, play a significant role in shaping market growth and product development. Furthermore, the existence of substitute technologies, such as traditional rigid sensors, presents a continuous challenge to market penetration.
End-user trends, particularly the rise of wearable technology and the automotive industry's adoption of advanced driver-assistance systems (ADAS), are key drivers of market expansion. Mergers and acquisitions (M&A) activity has been notable in recent years, with xx M&A deals recorded between 2019 and 2024. These activities often involve companies seeking to expand their product portfolios, enhance technological capabilities, and access new markets.
- Market Share (2025): Top 5 players hold xx% combined market share.
- M&A Deal Count (2019-2024): xx
- Key Innovation Drivers: Miniaturization, flexibility, cost reduction, increasing demand from diverse end-users.
- Regulatory Impacts: Safety standards, data privacy regulations influence product development and market access.
Printed and Flexible Sensors Industry Industry Trends & Analysis
The Printed and Flexible Sensors market is experiencing robust growth, driven by several key factors. The Compound Annual Growth Rate (CAGR) during the forecast period (2025-2033) is projected to be xx%, exceeding the historical CAGR of xx% (2019-2024). This growth is fueled by technological advancements in materials science and printing techniques, leading to improved sensor performance, flexibility, and cost-effectiveness. Consumer preference for wearable technology, smart devices, and personalized healthcare solutions is a significant growth catalyst. Furthermore, the automotive industry's increasing integration of sensors in ADAS and vehicle safety systems is driving substantial demand. Competitive dynamics are shaped by continuous innovation, strategic partnerships, and the entry of new players into the market, creating a dynamic and competitive landscape. Market penetration continues to expand across various sectors, with the highest penetration rates observed in consumer electronics and medical applications.
Leading Markets & Segments in Printed and Flexible Sensors Industry
The global Printed and Flexible Sensors market is witnessing significant regional variations in growth. North America currently holds a dominant position, followed by Europe and Asia Pacific.
By Type:
- Pressure Sensors: This segment dominates due to its extensive applications in automotive, medical, and industrial sectors.
- Touch Sensors: High demand from the consumer electronics sector drives growth in this segment.
- Biosensors: Rapid advancements and increasing healthcare spending fuel substantial growth.
By End User:
- Consumer Electronics: The widespread adoption of smartphones, wearables, and other smart devices significantly drives market demand.
- Automotive: The increasing integration of sensors in ADAS and vehicle safety systems fuels rapid growth.
- Medical and Healthcare: Rising healthcare expenditure and the development of advanced medical devices underpin this segment's strong performance.
Key Drivers:
- North America: Strong R&D investment, advanced technological infrastructure, and a large consumer electronics market.
- Europe: Stringent environmental regulations and a focus on sustainable technologies.
- Asia Pacific: Rapid industrialization, rising disposable incomes, and a growing consumer base.
Printed and Flexible Sensors Industry Product Developments
Recent product developments in the printed and flexible sensors industry emphasize miniaturization, improved sensitivity, and enhanced durability. Technological advancements in materials science, printing techniques, and sensor integration have led to the creation of more sophisticated and versatile sensor solutions. These innovations cater to the growing demand for high-performance sensors in diverse applications, from wearable health monitors to advanced automotive systems. The market focus is on creating sensors with greater flexibility, biocompatibility, and improved integration with existing electronic systems.
Key Drivers of Printed and Flexible Sensors Industry Growth
Several factors fuel the growth of the printed and flexible sensors industry. Technological advancements in materials science and manufacturing processes allow for the creation of cost-effective, high-performance sensors. The increasing adoption of connected devices and the Internet of Things (IoT) is generating strong demand for sensors across various sectors. Government initiatives promoting the development and adoption of advanced technologies further stimulate market growth. Economic factors, such as rising disposable incomes and increased consumer spending, particularly in developing economies, contribute to market expansion.
Challenges in the Printed and Flexible Sensors Industry Market
The printed and flexible sensors market faces certain challenges. Regulatory hurdles related to sensor safety and data privacy can hinder market penetration. Supply chain disruptions, especially concerning raw materials and specialized components, can impact production and profitability. Intense competition from established players and new entrants creates pricing pressure and necessitates continuous innovation to maintain a competitive edge. These factors can collectively impact market growth and profitability.
Emerging Opportunities in Printed and Flexible Sensors Industry
The long-term growth potential of the printed and flexible sensor industry is considerable. Technological breakthroughs, such as the development of new materials and advanced printing techniques, open avenues for more advanced sensor capabilities. Strategic partnerships between sensor manufacturers and end-users can lead to the creation of innovative applications and expand market reach. Market expansion strategies targeting emerging economies and underserved sectors will offer substantial growth opportunities.
Leading Players in the Printed and Flexible Sensors Industry Sector
- ISORG
- PolyIC GmbH & Co KG
- Pressure Profile Systems Inc
- Memtronik
- Butler Technologies Inc
- E2IP Technologies
- Linepro Controls Pvt Ltd
- PST Sensors
- Tekscan Inc
- Forciot
- Quad Industries
- Brewer Science
- Nissha Co Lt
- Canatu Oy
Key Milestones in Printed and Flexible Sensors Industry Industry
- February 2023: Quad Industries showcased new developments in capacitive touch controls, medical electrode patches, and other sensor technologies at LOPEC 2023.
- March 2023: Tekscan launched the High-Speed TireScan system, enabling precise monitoring of tire pressure at high speeds.
Strategic Outlook for Printed and Flexible Sensors Industry Market
The future of the printed and flexible sensors market is bright, characterized by significant growth potential driven by continuous technological innovation and increasing demand across various sectors. Strategic partnerships, focus on niche applications, and expansion into emerging markets will be crucial for companies to capitalize on the significant growth opportunities in this dynamic industry. Further research into novel materials and manufacturing processes promises to unlock even greater sensor performance and expand the range of potential applications.
Printed and Flexible Sensors Industry Segmentation
-
1. Type
- 1.1. Biosensor
- 1.2. Touch Sensor
- 1.3. Photodetectors
- 1.4. Temperature Sensor
- 1.5. Pressure Sensor
- 1.6. Other Types
-
2. End-user Industry
- 2.1. Automotive
- 2.2. Consumer Electronics
- 2.3. Medical and Healthcare
- 2.4. Defense and Aerospace
- 2.5. Other End-user Industries
Printed and Flexible Sensors Industry Segmentation By Geography
- 1. North America
- 2. Europe
- 3. Asia
- 4. Australia and New Zealand
- 5. Latin America
- 6. Middle East and Africa
Printed and Flexible Sensors Industry REPORT HIGHLIGHTS
| Aspects | Details |
|---|---|
| Study Period | 2019-2033 |
| Base Year | 2024 |
| Estimated Year | 2025 |
| Forecast Period | 2025-2033 |
| Historical Period | 2019-2024 |
| Growth Rate | CAGR of 8.47% from 2019-2033 |
| Segmentation |
|
Table of Contents
- 1. Introduction
- 1.1. Research Scope
- 1.2. Market Segmentation
- 1.3. Research Methodology
- 1.4. Definitions and Assumptions
- 2. Executive Summary
- 2.1. Introduction
- 3. Market Dynamics
- 3.1. Introduction
- 3.2. Market Drivers
- 3.2.1 Progression in Demand for Energy-efficient
- 3.2.2 Thin
- 3.2.3 and Flexible Consumer Electronics Products; Rising Integration of Printed Sensors in Medical Wearable Devices
- 3.3. Market Restrains
- 3.3.1. Requirement of Technological Improvements for Wider Adoption
- 3.4. Market Trends
- 3.4.1. Medical and Healthcare to Witness the Growth
- 4. Market Factor Analysis
- 4.1. Porters Five Forces
- 4.2. Supply/Value Chain
- 4.3. PESTEL analysis
- 4.4. Market Entropy
- 4.5. Patent/Trademark Analysis
- 5. Global Printed and Flexible Sensors Industry Analysis, Insights and Forecast, 2019-2031
- 5.1. Market Analysis, Insights and Forecast - by Type
- 5.1.1. Biosensor
- 5.1.2. Touch Sensor
- 5.1.3. Photodetectors
- 5.1.4. Temperature Sensor
- 5.1.5. Pressure Sensor
- 5.1.6. Other Types
- 5.2. Market Analysis, Insights and Forecast - by End-user Industry
- 5.2.1. Automotive
- 5.2.2. Consumer Electronics
- 5.2.3. Medical and Healthcare
- 5.2.4. Defense and Aerospace
- 5.2.5. Other End-user Industries
- 5.3. Market Analysis, Insights and Forecast - by Region
- 5.3.1. North America
- 5.3.2. Europe
- 5.3.3. Asia
- 5.3.4. Australia and New Zealand
- 5.3.5. Latin America
- 5.3.6. Middle East and Africa
- 5.1. Market Analysis, Insights and Forecast - by Type
- 6. North America Printed and Flexible Sensors Industry Analysis, Insights and Forecast, 2019-2031
- 6.1. Market Analysis, Insights and Forecast - by Type
- 6.1.1. Biosensor
- 6.1.2. Touch Sensor
- 6.1.3. Photodetectors
- 6.1.4. Temperature Sensor
- 6.1.5. Pressure Sensor
- 6.1.6. Other Types
- 6.2. Market Analysis, Insights and Forecast - by End-user Industry
- 6.2.1. Automotive
- 6.2.2. Consumer Electronics
- 6.2.3. Medical and Healthcare
- 6.2.4. Defense and Aerospace
- 6.2.5. Other End-user Industries
- 6.1. Market Analysis, Insights and Forecast - by Type
- 7. Europe Printed and Flexible Sensors Industry Analysis, Insights and Forecast, 2019-2031
- 7.1. Market Analysis, Insights and Forecast - by Type
- 7.1.1. Biosensor
- 7.1.2. Touch Sensor
- 7.1.3. Photodetectors
- 7.1.4. Temperature Sensor
- 7.1.5. Pressure Sensor
- 7.1.6. Other Types
- 7.2. Market Analysis, Insights and Forecast - by End-user Industry
- 7.2.1. Automotive
- 7.2.2. Consumer Electronics
- 7.2.3. Medical and Healthcare
- 7.2.4. Defense and Aerospace
- 7.2.5. Other End-user Industries
- 7.1. Market Analysis, Insights and Forecast - by Type
- 8. Asia Printed and Flexible Sensors Industry Analysis, Insights and Forecast, 2019-2031
- 8.1. Market Analysis, Insights and Forecast - by Type
- 8.1.1. Biosensor
- 8.1.2. Touch Sensor
- 8.1.3. Photodetectors
- 8.1.4. Temperature Sensor
- 8.1.5. Pressure Sensor
- 8.1.6. Other Types
- 8.2. Market Analysis, Insights and Forecast - by End-user Industry
- 8.2.1. Automotive
- 8.2.2. Consumer Electronics
- 8.2.3. Medical and Healthcare
- 8.2.4. Defense and Aerospace
- 8.2.5. Other End-user Industries
- 8.1. Market Analysis, Insights and Forecast - by Type
- 9. Australia and New Zealand Printed and Flexible Sensors Industry Analysis, Insights and Forecast, 2019-2031
- 9.1. Market Analysis, Insights and Forecast - by Type
- 9.1.1. Biosensor
- 9.1.2. Touch Sensor
- 9.1.3. Photodetectors
- 9.1.4. Temperature Sensor
- 9.1.5. Pressure Sensor
- 9.1.6. Other Types
- 9.2. Market Analysis, Insights and Forecast - by End-user Industry
- 9.2.1. Automotive
- 9.2.2. Consumer Electronics
- 9.2.3. Medical and Healthcare
- 9.2.4. Defense and Aerospace
- 9.2.5. Other End-user Industries
- 9.1. Market Analysis, Insights and Forecast - by Type
- 10. Latin America Printed and Flexible Sensors Industry Analysis, Insights and Forecast, 2019-2031
- 10.1. Market Analysis, Insights and Forecast - by Type
- 10.1.1. Biosensor
- 10.1.2. Touch Sensor
- 10.1.3. Photodetectors
- 10.1.4. Temperature Sensor
- 10.1.5. Pressure Sensor
- 10.1.6. Other Types
- 10.2. Market Analysis, Insights and Forecast - by End-user Industry
- 10.2.1. Automotive
- 10.2.2. Consumer Electronics
- 10.2.3. Medical and Healthcare
- 10.2.4. Defense and Aerospace
- 10.2.5. Other End-user Industries
- 10.1. Market Analysis, Insights and Forecast - by Type
- 11. Middle East and Africa Printed and Flexible Sensors Industry Analysis, Insights and Forecast, 2019-2031
- 11.1. Market Analysis, Insights and Forecast - by Type
- 11.1.1. Biosensor
- 11.1.2. Touch Sensor
- 11.1.3. Photodetectors
- 11.1.4. Temperature Sensor
- 11.1.5. Pressure Sensor
- 11.1.6. Other Types
- 11.2. Market Analysis, Insights and Forecast - by End-user Industry
- 11.2.1. Automotive
- 11.2.2. Consumer Electronics
- 11.2.3. Medical and Healthcare
- 11.2.4. Defense and Aerospace
- 11.2.5. Other End-user Industries
- 11.1. Market Analysis, Insights and Forecast - by Type
- 12. North America Printed and Flexible Sensors Industry Analysis, Insights and Forecast, 2019-2031
- 12.1. Market Analysis, Insights and Forecast - By Country/Sub-region
- 12.1.1 United States
- 12.1.2 Canada
- 12.1.3 Mexico
- 13. Europe Printed and Flexible Sensors Industry Analysis, Insights and Forecast, 2019-2031
- 13.1. Market Analysis, Insights and Forecast - By Country/Sub-region
- 13.1.1 Germany
- 13.1.2 United Kingdom
- 13.1.3 France
- 13.1.4 Spain
- 13.1.5 Italy
- 13.1.6 Spain
- 13.1.7 Belgium
- 13.1.8 Netherland
- 13.1.9 Nordics
- 13.1.10 Rest of Europe
- 14. Asia Pacific Printed and Flexible Sensors Industry Analysis, Insights and Forecast, 2019-2031
- 14.1. Market Analysis, Insights and Forecast - By Country/Sub-region
- 14.1.1 China
- 14.1.2 Japan
- 14.1.3 India
- 14.1.4 South Korea
- 14.1.5 Southeast Asia
- 14.1.6 Australia
- 14.1.7 Indonesia
- 14.1.8 Phillipes
- 14.1.9 Singapore
- 14.1.10 Thailandc
- 14.1.11 Rest of Asia Pacific
- 15. South America Printed and Flexible Sensors Industry Analysis, Insights and Forecast, 2019-2031
- 15.1. Market Analysis, Insights and Forecast - By Country/Sub-region
- 15.1.1 Brazil
- 15.1.2 Argentina
- 15.1.3 Peru
- 15.1.4 Chile
- 15.1.5 Colombia
- 15.1.6 Ecuador
- 15.1.7 Venezuela
- 15.1.8 Rest of South America
- 16. North America Printed and Flexible Sensors Industry Analysis, Insights and Forecast, 2019-2031
- 16.1. Market Analysis, Insights and Forecast - By Country/Sub-region
- 16.1.1 United States
- 16.1.2 Canada
- 16.1.3 Mexico
- 17. MEA Printed and Flexible Sensors Industry Analysis, Insights and Forecast, 2019-2031
- 17.1. Market Analysis, Insights and Forecast - By Country/Sub-region
- 17.1.1 United Arab Emirates
- 17.1.2 Saudi Arabia
- 17.1.3 South Africa
- 17.1.4 Rest of Middle East and Africa
- 18. Competitive Analysis
- 18.1. Global Market Share Analysis 2024
- 18.2. Company Profiles
- 18.2.1 ISORG
- 18.2.1.1. Overview
- 18.2.1.2. Products
- 18.2.1.3. SWOT Analysis
- 18.2.1.4. Recent Developments
- 18.2.1.5. Financials (Based on Availability)
- 18.2.2 PolyIC GmbH & Co KG
- 18.2.2.1. Overview
- 18.2.2.2. Products
- 18.2.2.3. SWOT Analysis
- 18.2.2.4. Recent Developments
- 18.2.2.5. Financials (Based on Availability)
- 18.2.3 Pressure Profile Systems Inc
- 18.2.3.1. Overview
- 18.2.3.2. Products
- 18.2.3.3. SWOT Analysis
- 18.2.3.4. Recent Developments
- 18.2.3.5. Financials (Based on Availability)
- 18.2.4 Memtronik
- 18.2.4.1. Overview
- 18.2.4.2. Products
- 18.2.4.3. SWOT Analysis
- 18.2.4.4. Recent Developments
- 18.2.4.5. Financials (Based on Availability)
- 18.2.5 Butler Technologies Inc
- 18.2.5.1. Overview
- 18.2.5.2. Products
- 18.2.5.3. SWOT Analysis
- 18.2.5.4. Recent Developments
- 18.2.5.5. Financials (Based on Availability)
- 18.2.6 E2IP Technologies
- 18.2.6.1. Overview
- 18.2.6.2. Products
- 18.2.6.3. SWOT Analysis
- 18.2.6.4. Recent Developments
- 18.2.6.5. Financials (Based on Availability)
- 18.2.7 Linepro Controls Pvt Ltd
- 18.2.7.1. Overview
- 18.2.7.2. Products
- 18.2.7.3. SWOT Analysis
- 18.2.7.4. Recent Developments
- 18.2.7.5. Financials (Based on Availability)
- 18.2.8 PST Sensors
- 18.2.8.1. Overview
- 18.2.8.2. Products
- 18.2.8.3. SWOT Analysis
- 18.2.8.4. Recent Developments
- 18.2.8.5. Financials (Based on Availability)
- 18.2.9 Tekscan Inc
- 18.2.9.1. Overview
- 18.2.9.2. Products
- 18.2.9.3. SWOT Analysis
- 18.2.9.4. Recent Developments
- 18.2.9.5. Financials (Based on Availability)
- 18.2.10 Forciot
- 18.2.10.1. Overview
- 18.2.10.2. Products
- 18.2.10.3. SWOT Analysis
- 18.2.10.4. Recent Developments
- 18.2.10.5. Financials (Based on Availability)
- 18.2.11 Quad Industries
- 18.2.11.1. Overview
- 18.2.11.2. Products
- 18.2.11.3. SWOT Analysis
- 18.2.11.4. Recent Developments
- 18.2.11.5. Financials (Based on Availability)
- 18.2.12 Brewer Science
- 18.2.12.1. Overview
- 18.2.12.2. Products
- 18.2.12.3. SWOT Analysis
- 18.2.12.4. Recent Developments
- 18.2.12.5. Financials (Based on Availability)
- 18.2.13 Nissha Co Lt
- 18.2.13.1. Overview
- 18.2.13.2. Products
- 18.2.13.3. SWOT Analysis
- 18.2.13.4. Recent Developments
- 18.2.13.5. Financials (Based on Availability)
- 18.2.14 Canatu Oy
- 18.2.14.1. Overview
- 18.2.14.2. Products
- 18.2.14.3. SWOT Analysis
- 18.2.14.4. Recent Developments
- 18.2.14.5. Financials (Based on Availability)
- 18.2.1 ISORG
List of Figures
- Figure 1: Global Printed and Flexible Sensors Industry Revenue Breakdown (Million, %) by Region 2024 & 2032
- Figure 2: Global Printed and Flexible Sensors Industry Volume Breakdown (K Unit, %) by Region 2024 & 2032
- Figure 3: North America Printed and Flexible Sensors Industry Revenue (Million), by Country 2024 & 2032
- Figure 4: North America Printed and Flexible Sensors Industry Volume (K Unit), by Country 2024 & 2032
- Figure 5: North America Printed and Flexible Sensors Industry Revenue Share (%), by Country 2024 & 2032
- Figure 6: North America Printed and Flexible Sensors Industry Volume Share (%), by Country 2024 & 2032
- Figure 7: Europe Printed and Flexible Sensors Industry Revenue (Million), by Country 2024 & 2032
- Figure 8: Europe Printed and Flexible Sensors Industry Volume (K Unit), by Country 2024 & 2032
- Figure 9: Europe Printed and Flexible Sensors Industry Revenue Share (%), by Country 2024 & 2032
- Figure 10: Europe Printed and Flexible Sensors Industry Volume Share (%), by Country 2024 & 2032
- Figure 11: Asia Pacific Printed and Flexible Sensors Industry Revenue (Million), by Country 2024 & 2032
- Figure 12: Asia Pacific Printed and Flexible Sensors Industry Volume (K Unit), by Country 2024 & 2032
- Figure 13: Asia Pacific Printed and Flexible Sensors Industry Revenue Share (%), by Country 2024 & 2032
- Figure 14: Asia Pacific Printed and Flexible Sensors Industry Volume Share (%), by Country 2024 & 2032
- Figure 15: South America Printed and Flexible Sensors Industry Revenue (Million), by Country 2024 & 2032
- Figure 16: South America Printed and Flexible Sensors Industry Volume (K Unit), by Country 2024 & 2032
- Figure 17: South America Printed and Flexible Sensors Industry Revenue Share (%), by Country 2024 & 2032
- Figure 18: South America Printed and Flexible Sensors Industry Volume Share (%), by Country 2024 & 2032
- Figure 19: North America Printed and Flexible Sensors Industry Revenue (Million), by Country 2024 & 2032
- Figure 20: North America Printed and Flexible Sensors Industry Volume (K Unit), by Country 2024 & 2032
- Figure 21: North America Printed and Flexible Sensors Industry Revenue Share (%), by Country 2024 & 2032
- Figure 22: North America Printed and Flexible Sensors Industry Volume Share (%), by Country 2024 & 2032
- Figure 23: MEA Printed and Flexible Sensors Industry Revenue (Million), by Country 2024 & 2032
- Figure 24: MEA Printed and Flexible Sensors Industry Volume (K Unit), by Country 2024 & 2032
- Figure 25: MEA Printed and Flexible Sensors Industry Revenue Share (%), by Country 2024 & 2032
- Figure 26: MEA Printed and Flexible Sensors Industry Volume Share (%), by Country 2024 & 2032
- Figure 27: North America Printed and Flexible Sensors Industry Revenue (Million), by Type 2024 & 2032
- Figure 28: North America Printed and Flexible Sensors Industry Volume (K Unit), by Type 2024 & 2032
- Figure 29: North America Printed and Flexible Sensors Industry Revenue Share (%), by Type 2024 & 2032
- Figure 30: North America Printed and Flexible Sensors Industry Volume Share (%), by Type 2024 & 2032
- Figure 31: North America Printed and Flexible Sensors Industry Revenue (Million), by End-user Industry 2024 & 2032
- Figure 32: North America Printed and Flexible Sensors Industry Volume (K Unit), by End-user Industry 2024 & 2032
- Figure 33: North America Printed and Flexible Sensors Industry Revenue Share (%), by End-user Industry 2024 & 2032
- Figure 34: North America Printed and Flexible Sensors Industry Volume Share (%), by End-user Industry 2024 & 2032
- Figure 35: North America Printed and Flexible Sensors Industry Revenue (Million), by Country 2024 & 2032
- Figure 36: North America Printed and Flexible Sensors Industry Volume (K Unit), by Country 2024 & 2032
- Figure 37: North America Printed and Flexible Sensors Industry Revenue Share (%), by Country 2024 & 2032
- Figure 38: North America Printed and Flexible Sensors Industry Volume Share (%), by Country 2024 & 2032
- Figure 39: Europe Printed and Flexible Sensors Industry Revenue (Million), by Type 2024 & 2032
- Figure 40: Europe Printed and Flexible Sensors Industry Volume (K Unit), by Type 2024 & 2032
- Figure 41: Europe Printed and Flexible Sensors Industry Revenue Share (%), by Type 2024 & 2032
- Figure 42: Europe Printed and Flexible Sensors Industry Volume Share (%), by Type 2024 & 2032
- Figure 43: Europe Printed and Flexible Sensors Industry Revenue (Million), by End-user Industry 2024 & 2032
- Figure 44: Europe Printed and Flexible Sensors Industry Volume (K Unit), by End-user Industry 2024 & 2032
- Figure 45: Europe Printed and Flexible Sensors Industry Revenue Share (%), by End-user Industry 2024 & 2032
- Figure 46: Europe Printed and Flexible Sensors Industry Volume Share (%), by End-user Industry 2024 & 2032
- Figure 47: Europe Printed and Flexible Sensors Industry Revenue (Million), by Country 2024 & 2032
- Figure 48: Europe Printed and Flexible Sensors Industry Volume (K Unit), by Country 2024 & 2032
- Figure 49: Europe Printed and Flexible Sensors Industry Revenue Share (%), by Country 2024 & 2032
- Figure 50: Europe Printed and Flexible Sensors Industry Volume Share (%), by Country 2024 & 2032
- Figure 51: Asia Printed and Flexible Sensors Industry Revenue (Million), by Type 2024 & 2032
- Figure 52: Asia Printed and Flexible Sensors Industry Volume (K Unit), by Type 2024 & 2032
- Figure 53: Asia Printed and Flexible Sensors Industry Revenue Share (%), by Type 2024 & 2032
- Figure 54: Asia Printed and Flexible Sensors Industry Volume Share (%), by Type 2024 & 2032
- Figure 55: Asia Printed and Flexible Sensors Industry Revenue (Million), by End-user Industry 2024 & 2032
- Figure 56: Asia Printed and Flexible Sensors Industry Volume (K Unit), by End-user Industry 2024 & 2032
- Figure 57: Asia Printed and Flexible Sensors Industry Revenue Share (%), by End-user Industry 2024 & 2032
- Figure 58: Asia Printed and Flexible Sensors Industry Volume Share (%), by End-user Industry 2024 & 2032
- Figure 59: Asia Printed and Flexible Sensors Industry Revenue (Million), by Country 2024 & 2032
- Figure 60: Asia Printed and Flexible Sensors Industry Volume (K Unit), by Country 2024 & 2032
- Figure 61: Asia Printed and Flexible Sensors Industry Revenue Share (%), by Country 2024 & 2032
- Figure 62: Asia Printed and Flexible Sensors Industry Volume Share (%), by Country 2024 & 2032
- Figure 63: Australia and New Zealand Printed and Flexible Sensors Industry Revenue (Million), by Type 2024 & 2032
- Figure 64: Australia and New Zealand Printed and Flexible Sensors Industry Volume (K Unit), by Type 2024 & 2032
- Figure 65: Australia and New Zealand Printed and Flexible Sensors Industry Revenue Share (%), by Type 2024 & 2032
- Figure 66: Australia and New Zealand Printed and Flexible Sensors Industry Volume Share (%), by Type 2024 & 2032
- Figure 67: Australia and New Zealand Printed and Flexible Sensors Industry Revenue (Million), by End-user Industry 2024 & 2032
- Figure 68: Australia and New Zealand Printed and Flexible Sensors Industry Volume (K Unit), by End-user Industry 2024 & 2032
- Figure 69: Australia and New Zealand Printed and Flexible Sensors Industry Revenue Share (%), by End-user Industry 2024 & 2032
- Figure 70: Australia and New Zealand Printed and Flexible Sensors Industry Volume Share (%), by End-user Industry 2024 & 2032
- Figure 71: Australia and New Zealand Printed and Flexible Sensors Industry Revenue (Million), by Country 2024 & 2032
- Figure 72: Australia and New Zealand Printed and Flexible Sensors Industry Volume (K Unit), by Country 2024 & 2032
- Figure 73: Australia and New Zealand Printed and Flexible Sensors Industry Revenue Share (%), by Country 2024 & 2032
- Figure 74: Australia and New Zealand Printed and Flexible Sensors Industry Volume Share (%), by Country 2024 & 2032
- Figure 75: Latin America Printed and Flexible Sensors Industry Revenue (Million), by Type 2024 & 2032
- Figure 76: Latin America Printed and Flexible Sensors Industry Volume (K Unit), by Type 2024 & 2032
- Figure 77: Latin America Printed and Flexible Sensors Industry Revenue Share (%), by Type 2024 & 2032
- Figure 78: Latin America Printed and Flexible Sensors Industry Volume Share (%), by Type 2024 & 2032
- Figure 79: Latin America Printed and Flexible Sensors Industry Revenue (Million), by End-user Industry 2024 & 2032
- Figure 80: Latin America Printed and Flexible Sensors Industry Volume (K Unit), by End-user Industry 2024 & 2032
- Figure 81: Latin America Printed and Flexible Sensors Industry Revenue Share (%), by End-user Industry 2024 & 2032
- Figure 82: Latin America Printed and Flexible Sensors Industry Volume Share (%), by End-user Industry 2024 & 2032
- Figure 83: Latin America Printed and Flexible Sensors Industry Revenue (Million), by Country 2024 & 2032
- Figure 84: Latin America Printed and Flexible Sensors Industry Volume (K Unit), by Country 2024 & 2032
- Figure 85: Latin America Printed and Flexible Sensors Industry Revenue Share (%), by Country 2024 & 2032
- Figure 86: Latin America Printed and Flexible Sensors Industry Volume Share (%), by Country 2024 & 2032
- Figure 87: Middle East and Africa Printed and Flexible Sensors Industry Revenue (Million), by Type 2024 & 2032
- Figure 88: Middle East and Africa Printed and Flexible Sensors Industry Volume (K Unit), by Type 2024 & 2032
- Figure 89: Middle East and Africa Printed and Flexible Sensors Industry Revenue Share (%), by Type 2024 & 2032
- Figure 90: Middle East and Africa Printed and Flexible Sensors Industry Volume Share (%), by Type 2024 & 2032
- Figure 91: Middle East and Africa Printed and Flexible Sensors Industry Revenue (Million), by End-user Industry 2024 & 2032
- Figure 92: Middle East and Africa Printed and Flexible Sensors Industry Volume (K Unit), by End-user Industry 2024 & 2032
- Figure 93: Middle East and Africa Printed and Flexible Sensors Industry Revenue Share (%), by End-user Industry 2024 & 2032
- Figure 94: Middle East and Africa Printed and Flexible Sensors Industry Volume Share (%), by End-user Industry 2024 & 2032
- Figure 95: Middle East and Africa Printed and Flexible Sensors Industry Revenue (Million), by Country 2024 & 2032
- Figure 96: Middle East and Africa Printed and Flexible Sensors Industry Volume (K Unit), by Country 2024 & 2032
- Figure 97: Middle East and Africa Printed and Flexible Sensors Industry Revenue Share (%), by Country 2024 & 2032
- Figure 98: Middle East and Africa Printed and Flexible Sensors Industry Volume Share (%), by Country 2024 & 2032
List of Tables
- Table 1: Global Printed and Flexible Sensors Industry Revenue Million Forecast, by Region 2019 & 2032
- Table 2: Global Printed and Flexible Sensors Industry Volume K Unit Forecast, by Region 2019 & 2032
- Table 3: Global Printed and Flexible Sensors Industry Revenue Million Forecast, by Type 2019 & 2032
- Table 4: Global Printed and Flexible Sensors Industry Volume K Unit Forecast, by Type 2019 & 2032
- Table 5: Global Printed and Flexible Sensors Industry Revenue Million Forecast, by End-user Industry 2019 & 2032
- Table 6: Global Printed and Flexible Sensors Industry Volume K Unit Forecast, by End-user Industry 2019 & 2032
- Table 7: Global Printed and Flexible Sensors Industry Revenue Million Forecast, by Region 2019 & 2032
- Table 8: Global Printed and Flexible Sensors Industry Volume K Unit Forecast, by Region 2019 & 2032
- Table 9: Global Printed and Flexible Sensors Industry Revenue Million Forecast, by Country 2019 & 2032
- Table 10: Global Printed and Flexible Sensors Industry Volume K Unit Forecast, by Country 2019 & 2032
- Table 11: United States Printed and Flexible Sensors Industry Revenue (Million) Forecast, by Application 2019 & 2032
- Table 12: United States Printed and Flexible Sensors Industry Volume (K Unit) Forecast, by Application 2019 & 2032
- Table 13: Canada Printed and Flexible Sensors Industry Revenue (Million) Forecast, by Application 2019 & 2032
- Table 14: Canada Printed and Flexible Sensors Industry Volume (K Unit) Forecast, by Application 2019 & 2032
- Table 15: Mexico Printed and Flexible Sensors Industry Revenue (Million) Forecast, by Application 2019 & 2032
- Table 16: Mexico Printed and Flexible Sensors Industry Volume (K Unit) Forecast, by Application 2019 & 2032
- Table 17: Global Printed and Flexible Sensors Industry Revenue Million Forecast, by Country 2019 & 2032
- Table 18: Global Printed and Flexible Sensors Industry Volume K Unit Forecast, by Country 2019 & 2032
- Table 19: Germany Printed and Flexible Sensors Industry Revenue (Million) Forecast, by Application 2019 & 2032
- Table 20: Germany Printed and Flexible Sensors Industry Volume (K Unit) Forecast, by Application 2019 & 2032
- Table 21: United Kingdom Printed and Flexible Sensors Industry Revenue (Million) Forecast, by Application 2019 & 2032
- Table 22: United Kingdom Printed and Flexible Sensors Industry Volume (K Unit) Forecast, by Application 2019 & 2032
- Table 23: France Printed and Flexible Sensors Industry Revenue (Million) Forecast, by Application 2019 & 2032
- Table 24: France Printed and Flexible Sensors Industry Volume (K Unit) Forecast, by Application 2019 & 2032
- Table 25: Spain Printed and Flexible Sensors Industry Revenue (Million) Forecast, by Application 2019 & 2032
- Table 26: Spain Printed and Flexible Sensors Industry Volume (K Unit) Forecast, by Application 2019 & 2032
- Table 27: Italy Printed and Flexible Sensors Industry Revenue (Million) Forecast, by Application 2019 & 2032
- Table 28: Italy Printed and Flexible Sensors Industry Volume (K Unit) Forecast, by Application 2019 & 2032
- Table 29: Spain Printed and Flexible Sensors Industry Revenue (Million) Forecast, by Application 2019 & 2032
- Table 30: Spain Printed and Flexible Sensors Industry Volume (K Unit) Forecast, by Application 2019 & 2032
- Table 31: Belgium Printed and Flexible Sensors Industry Revenue (Million) Forecast, by Application 2019 & 2032
- Table 32: Belgium Printed and Flexible Sensors Industry Volume (K Unit) Forecast, by Application 2019 & 2032
- Table 33: Netherland Printed and Flexible Sensors Industry Revenue (Million) Forecast, by Application 2019 & 2032
- Table 34: Netherland Printed and Flexible Sensors Industry Volume (K Unit) Forecast, by Application 2019 & 2032
- Table 35: Nordics Printed and Flexible Sensors Industry Revenue (Million) Forecast, by Application 2019 & 2032
- Table 36: Nordics Printed and Flexible Sensors Industry Volume (K Unit) Forecast, by Application 2019 & 2032
- Table 37: Rest of Europe Printed and Flexible Sensors Industry Revenue (Million) Forecast, by Application 2019 & 2032
- Table 38: Rest of Europe Printed and Flexible Sensors Industry Volume (K Unit) Forecast, by Application 2019 & 2032
- Table 39: Global Printed and Flexible Sensors Industry Revenue Million Forecast, by Country 2019 & 2032
- Table 40: Global Printed and Flexible Sensors Industry Volume K Unit Forecast, by Country 2019 & 2032
- Table 41: China Printed and Flexible Sensors Industry Revenue (Million) Forecast, by Application 2019 & 2032
- Table 42: China Printed and Flexible Sensors Industry Volume (K Unit) Forecast, by Application 2019 & 2032
- Table 43: Japan Printed and Flexible Sensors Industry Revenue (Million) Forecast, by Application 2019 & 2032
- Table 44: Japan Printed and Flexible Sensors Industry Volume (K Unit) Forecast, by Application 2019 & 2032
- Table 45: India Printed and Flexible Sensors Industry Revenue (Million) Forecast, by Application 2019 & 2032
- Table 46: India Printed and Flexible Sensors Industry Volume (K Unit) Forecast, by Application 2019 & 2032
- Table 47: South Korea Printed and Flexible Sensors Industry Revenue (Million) Forecast, by Application 2019 & 2032
- Table 48: South Korea Printed and Flexible Sensors Industry Volume (K Unit) Forecast, by Application 2019 & 2032
- Table 49: Southeast Asia Printed and Flexible Sensors Industry Revenue (Million) Forecast, by Application 2019 & 2032
- Table 50: Southeast Asia Printed and Flexible Sensors Industry Volume (K Unit) Forecast, by Application 2019 & 2032
- Table 51: Australia Printed and Flexible Sensors Industry Revenue (Million) Forecast, by Application 2019 & 2032
- Table 52: Australia Printed and Flexible Sensors Industry Volume (K Unit) Forecast, by Application 2019 & 2032
- Table 53: Indonesia Printed and Flexible Sensors Industry Revenue (Million) Forecast, by Application 2019 & 2032
- Table 54: Indonesia Printed and Flexible Sensors Industry Volume (K Unit) Forecast, by Application 2019 & 2032
- Table 55: Phillipes Printed and Flexible Sensors Industry Revenue (Million) Forecast, by Application 2019 & 2032
- Table 56: Phillipes Printed and Flexible Sensors Industry Volume (K Unit) Forecast, by Application 2019 & 2032
- Table 57: Singapore Printed and Flexible Sensors Industry Revenue (Million) Forecast, by Application 2019 & 2032
- Table 58: Singapore Printed and Flexible Sensors Industry Volume (K Unit) Forecast, by Application 2019 & 2032
- Table 59: Thailandc Printed and Flexible Sensors Industry Revenue (Million) Forecast, by Application 2019 & 2032
- Table 60: Thailandc Printed and Flexible Sensors Industry Volume (K Unit) Forecast, by Application 2019 & 2032
- Table 61: Rest of Asia Pacific Printed and Flexible Sensors Industry Revenue (Million) Forecast, by Application 2019 & 2032
- Table 62: Rest of Asia Pacific Printed and Flexible Sensors Industry Volume (K Unit) Forecast, by Application 2019 & 2032
- Table 63: Global Printed and Flexible Sensors Industry Revenue Million Forecast, by Country 2019 & 2032
- Table 64: Global Printed and Flexible Sensors Industry Volume K Unit Forecast, by Country 2019 & 2032
- Table 65: Brazil Printed and Flexible Sensors Industry Revenue (Million) Forecast, by Application 2019 & 2032
- Table 66: Brazil Printed and Flexible Sensors Industry Volume (K Unit) Forecast, by Application 2019 & 2032
- Table 67: Argentina Printed and Flexible Sensors Industry Revenue (Million) Forecast, by Application 2019 & 2032
- Table 68: Argentina Printed and Flexible Sensors Industry Volume (K Unit) Forecast, by Application 2019 & 2032
- Table 69: Peru Printed and Flexible Sensors Industry Revenue (Million) Forecast, by Application 2019 & 2032
- Table 70: Peru Printed and Flexible Sensors Industry Volume (K Unit) Forecast, by Application 2019 & 2032
- Table 71: Chile Printed and Flexible Sensors Industry Revenue (Million) Forecast, by Application 2019 & 2032
- Table 72: Chile Printed and Flexible Sensors Industry Volume (K Unit) Forecast, by Application 2019 & 2032
- Table 73: Colombia Printed and Flexible Sensors Industry Revenue (Million) Forecast, by Application 2019 & 2032
- Table 74: Colombia Printed and Flexible Sensors Industry Volume (K Unit) Forecast, by Application 2019 & 2032
- Table 75: Ecuador Printed and Flexible Sensors Industry Revenue (Million) Forecast, by Application 2019 & 2032
- Table 76: Ecuador Printed and Flexible Sensors Industry Volume (K Unit) Forecast, by Application 2019 & 2032
- Table 77: Venezuela Printed and Flexible Sensors Industry Revenue (Million) Forecast, by Application 2019 & 2032
- Table 78: Venezuela Printed and Flexible Sensors Industry Volume (K Unit) Forecast, by Application 2019 & 2032
- Table 79: Rest of South America Printed and Flexible Sensors Industry Revenue (Million) Forecast, by Application 2019 & 2032
- Table 80: Rest of South America Printed and Flexible Sensors Industry Volume (K Unit) Forecast, by Application 2019 & 2032
- Table 81: Global Printed and Flexible Sensors Industry Revenue Million Forecast, by Country 2019 & 2032
- Table 82: Global Printed and Flexible Sensors Industry Volume K Unit Forecast, by Country 2019 & 2032
- Table 83: United States Printed and Flexible Sensors Industry Revenue (Million) Forecast, by Application 2019 & 2032
- Table 84: United States Printed and Flexible Sensors Industry Volume (K Unit) Forecast, by Application 2019 & 2032
- Table 85: Canada Printed and Flexible Sensors Industry Revenue (Million) Forecast, by Application 2019 & 2032
- Table 86: Canada Printed and Flexible Sensors Industry Volume (K Unit) Forecast, by Application 2019 & 2032
- Table 87: Mexico Printed and Flexible Sensors Industry Revenue (Million) Forecast, by Application 2019 & 2032
- Table 88: Mexico Printed and Flexible Sensors Industry Volume (K Unit) Forecast, by Application 2019 & 2032
- Table 89: Global Printed and Flexible Sensors Industry Revenue Million Forecast, by Country 2019 & 2032
- Table 90: Global Printed and Flexible Sensors Industry Volume K Unit Forecast, by Country 2019 & 2032
- Table 91: United Arab Emirates Printed and Flexible Sensors Industry Revenue (Million) Forecast, by Application 2019 & 2032
- Table 92: United Arab Emirates Printed and Flexible Sensors Industry Volume (K Unit) Forecast, by Application 2019 & 2032
- Table 93: Saudi Arabia Printed and Flexible Sensors Industry Revenue (Million) Forecast, by Application 2019 & 2032
- Table 94: Saudi Arabia Printed and Flexible Sensors Industry Volume (K Unit) Forecast, by Application 2019 & 2032
- Table 95: South Africa Printed and Flexible Sensors Industry Revenue (Million) Forecast, by Application 2019 & 2032
- Table 96: South Africa Printed and Flexible Sensors Industry Volume (K Unit) Forecast, by Application 2019 & 2032
- Table 97: Rest of Middle East and Africa Printed and Flexible Sensors Industry Revenue (Million) Forecast, by Application 2019 & 2032
- Table 98: Rest of Middle East and Africa Printed and Flexible Sensors Industry Volume (K Unit) Forecast, by Application 2019 & 2032
- Table 99: Global Printed and Flexible Sensors Industry Revenue Million Forecast, by Type 2019 & 2032
- Table 100: Global Printed and Flexible Sensors Industry Volume K Unit Forecast, by Type 2019 & 2032
- Table 101: Global Printed and Flexible Sensors Industry Revenue Million Forecast, by End-user Industry 2019 & 2032
- Table 102: Global Printed and Flexible Sensors Industry Volume K Unit Forecast, by End-user Industry 2019 & 2032
- Table 103: Global Printed and Flexible Sensors Industry Revenue Million Forecast, by Country 2019 & 2032
- Table 104: Global Printed and Flexible Sensors Industry Volume K Unit Forecast, by Country 2019 & 2032
- Table 105: Global Printed and Flexible Sensors Industry Revenue Million Forecast, by Type 2019 & 2032
- Table 106: Global Printed and Flexible Sensors Industry Volume K Unit Forecast, by Type 2019 & 2032
- Table 107: Global Printed and Flexible Sensors Industry Revenue Million Forecast, by End-user Industry 2019 & 2032
- Table 108: Global Printed and Flexible Sensors Industry Volume K Unit Forecast, by End-user Industry 2019 & 2032
- Table 109: Global Printed and Flexible Sensors Industry Revenue Million Forecast, by Country 2019 & 2032
- Table 110: Global Printed and Flexible Sensors Industry Volume K Unit Forecast, by Country 2019 & 2032
- Table 111: Global Printed and Flexible Sensors Industry Revenue Million Forecast, by Type 2019 & 2032
- Table 112: Global Printed and Flexible Sensors Industry Volume K Unit Forecast, by Type 2019 & 2032
- Table 113: Global Printed and Flexible Sensors Industry Revenue Million Forecast, by End-user Industry 2019 & 2032
- Table 114: Global Printed and Flexible Sensors Industry Volume K Unit Forecast, by End-user Industry 2019 & 2032
- Table 115: Global Printed and Flexible Sensors Industry Revenue Million Forecast, by Country 2019 & 2032
- Table 116: Global Printed and Flexible Sensors Industry Volume K Unit Forecast, by Country 2019 & 2032
- Table 117: Global Printed and Flexible Sensors Industry Revenue Million Forecast, by Type 2019 & 2032
- Table 118: Global Printed and Flexible Sensors Industry Volume K Unit Forecast, by Type 2019 & 2032
- Table 119: Global Printed and Flexible Sensors Industry Revenue Million Forecast, by End-user Industry 2019 & 2032
- Table 120: Global Printed and Flexible Sensors Industry Volume K Unit Forecast, by End-user Industry 2019 & 2032
- Table 121: Global Printed and Flexible Sensors Industry Revenue Million Forecast, by Country 2019 & 2032
- Table 122: Global Printed and Flexible Sensors Industry Volume K Unit Forecast, by Country 2019 & 2032
- Table 123: Global Printed and Flexible Sensors Industry Revenue Million Forecast, by Type 2019 & 2032
- Table 124: Global Printed and Flexible Sensors Industry Volume K Unit Forecast, by Type 2019 & 2032
- Table 125: Global Printed and Flexible Sensors Industry Revenue Million Forecast, by End-user Industry 2019 & 2032
- Table 126: Global Printed and Flexible Sensors Industry Volume K Unit Forecast, by End-user Industry 2019 & 2032
- Table 127: Global Printed and Flexible Sensors Industry Revenue Million Forecast, by Country 2019 & 2032
- Table 128: Global Printed and Flexible Sensors Industry Volume K Unit Forecast, by Country 2019 & 2032
- Table 129: Global Printed and Flexible Sensors Industry Revenue Million Forecast, by Type 2019 & 2032
- Table 130: Global Printed and Flexible Sensors Industry Volume K Unit Forecast, by Type 2019 & 2032
- Table 131: Global Printed and Flexible Sensors Industry Revenue Million Forecast, by End-user Industry 2019 & 2032
- Table 132: Global Printed and Flexible Sensors Industry Volume K Unit Forecast, by End-user Industry 2019 & 2032
- Table 133: Global Printed and Flexible Sensors Industry Revenue Million Forecast, by Country 2019 & 2032
- Table 134: Global Printed and Flexible Sensors Industry Volume K Unit Forecast, by Country 2019 & 2032
Frequently Asked Questions
1. What is the projected Compound Annual Growth Rate (CAGR) of the Printed and Flexible Sensors Industry?
The projected CAGR is approximately 8.47%.
2. Which companies are prominent players in the Printed and Flexible Sensors Industry?
Key companies in the market include ISORG, PolyIC GmbH & Co KG, Pressure Profile Systems Inc, Memtronik, Butler Technologies Inc, E2IP Technologies, Linepro Controls Pvt Ltd, PST Sensors, Tekscan Inc, Forciot, Quad Industries, Brewer Science, Nissha Co Lt, Canatu Oy.
3. What are the main segments of the Printed and Flexible Sensors Industry?
The market segments include Type, End-user Industry.
4. Can you provide details about the market size?
The market size is estimated to be USD 3.04 Million as of 2022.
5. What are some drivers contributing to market growth?
Progression in Demand for Energy-efficient. Thin. and Flexible Consumer Electronics Products; Rising Integration of Printed Sensors in Medical Wearable Devices.
6. What are the notable trends driving market growth?
Medical and Healthcare to Witness the Growth.
7. Are there any restraints impacting market growth?
Requirement of Technological Improvements for Wider Adoption.
8. Can you provide examples of recent developments in the market?
March 2023 - Tekscanofficially announced the launch of the High-Speed TireScansystem. Through this, tire makers can precisely, repeatedly, and effectively monitor dynamic contact patch pressure (DCPP) data from a tire rolling on a belt at speeds up to 165 mph (265 km/h) due to the development of this lightweight, durable device.
9. What pricing options are available for accessing the report?
Pricing options include single-user, multi-user, and enterprise licenses priced at USD 4750, USD 5250, and USD 8750 respectively.
10. Is the market size provided in terms of value or volume?
The market size is provided in terms of value, measured in Million and volume, measured in K Unit.
11. Are there any specific market keywords associated with the report?
Yes, the market keyword associated with the report is "Printed and Flexible Sensors Industry," which aids in identifying and referencing the specific market segment covered.
12. How do I determine which pricing option suits my needs best?
The pricing options vary based on user requirements and access needs. Individual users may opt for single-user licenses, while businesses requiring broader access may choose multi-user or enterprise licenses for cost-effective access to the report.
13. Are there any additional resources or data provided in the Printed and Flexible Sensors Industry report?
While the report offers comprehensive insights, it's advisable to review the specific contents or supplementary materials provided to ascertain if additional resources or data are available.
14. How can I stay updated on further developments or reports in the Printed and Flexible Sensors Industry?
To stay informed about further developments, trends, and reports in the Printed and Flexible Sensors Industry, consider subscribing to industry newsletters, following relevant companies and organizations, or regularly checking reputable industry news sources and publications.
Methodology
Step 1 - Identification of Relevant Samples Size from Population Database


Step 2 - Approaches for Defining Global Market Size (Value, Volume* & Price*)

Note*: In applicable scenarios
Step 3 - Data Sources
Primary Research
- Web Analytics
- Survey Reports
- Research Institute
- Latest Research Reports
- Opinion Leaders
Secondary Research
- Annual Reports
- White Paper
- Latest Press Release
- Industry Association
- Paid Database
- Investor Presentations

Step 4 - Data Triangulation
Involves using different sources of information in order to increase the validity of a study
These sources are likely to be stakeholders in a program - participants, other researchers, program staff, other community members, and so on.
Then we put all data in single framework & apply various statistical tools to find out the dynamic on the market.
During the analysis stage, feedback from the stakeholder groups would be compared to determine areas of agreement as well as areas of divergence
