

Key Insights
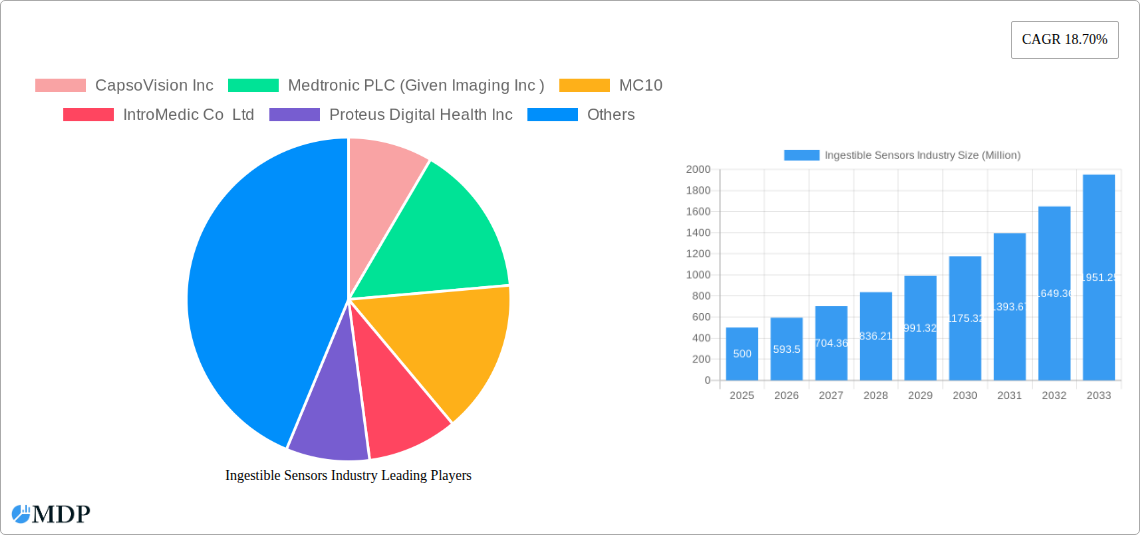
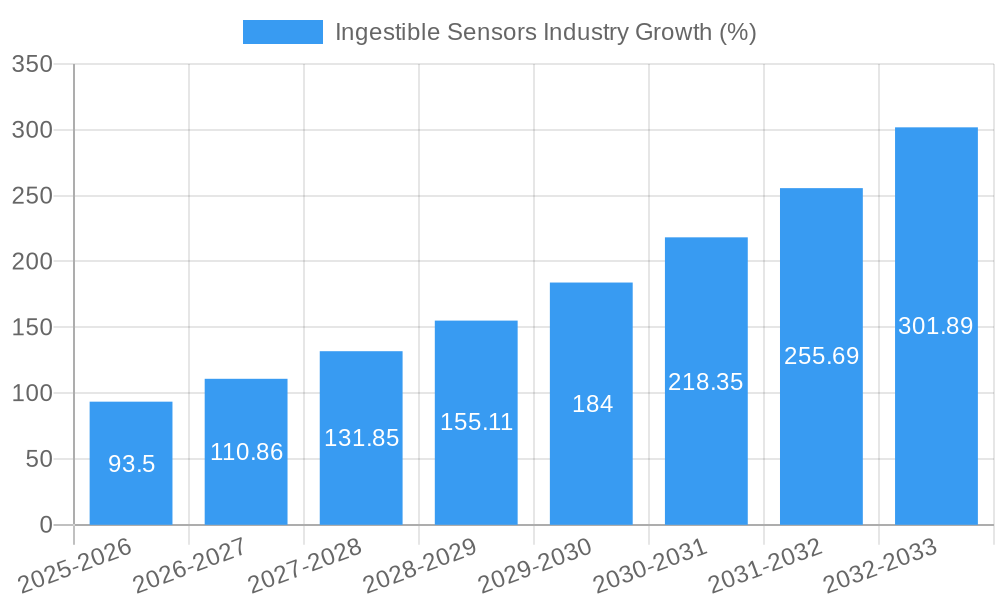
The ingestible sensors market is experiencing robust growth, projected to reach a substantial value by 2033, driven by a compound annual growth rate (CAGR) of 18.70% from 2025. This expansion is fueled by several key factors. The increasing prevalence of chronic diseases necessitates continuous patient monitoring, creating significant demand for minimally invasive, real-time health data acquisition methods. Ingestible sensors, with their ability to provide data directly from the gastrointestinal tract and other internal organs, offer a significant advantage over traditional methods. Advancements in sensor miniaturization, biocompatibility, and wireless communication technologies are further propelling market growth. The healthcare sector, particularly in the areas of gastroenterology and cardiology, is the primary driver, with applications expanding into sports and fitness monitoring, where precise physiological data enhances training and recovery strategies. However, challenges remain, including regulatory hurdles related to sensor safety and data privacy, as well as concerns regarding patient acceptance and the overall cost of these advanced technologies. Despite these restraints, the market's positive trajectory is expected to persist, driven by ongoing technological innovation and growing demand for personalized and proactive healthcare solutions.
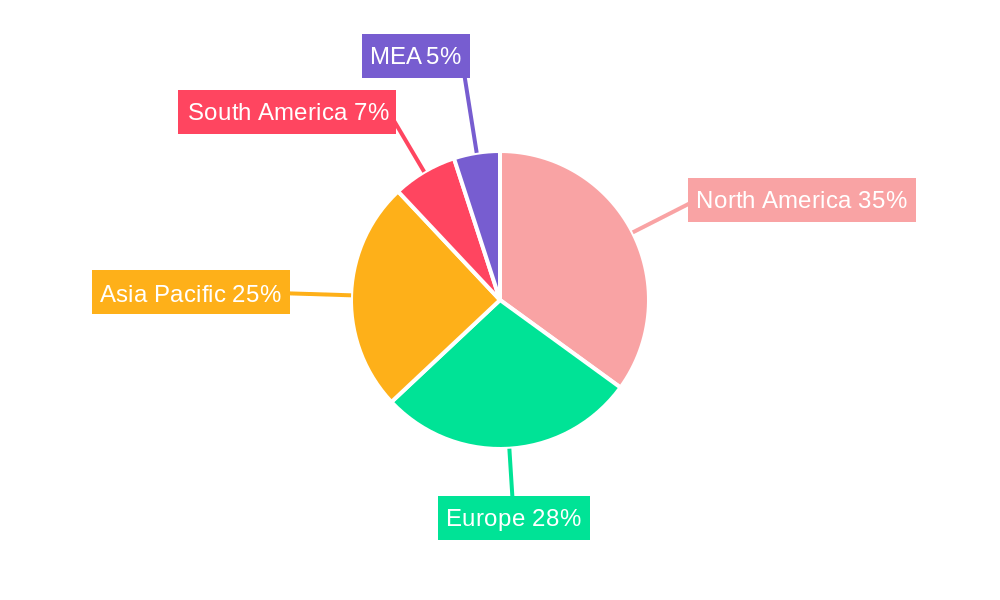
The segmentation of the ingestible sensor market reveals a diverse landscape. Temperature, pressure, and pH sensors currently dominate, given their established applications in various medical diagnostics and monitoring. Image sensors are emerging as a rapidly growing segment, offering detailed visual information, though this market segment faces higher technical complexity and associated costs. Geographically, North America and Europe currently hold significant market shares, owing to robust healthcare infrastructure and early adoption of advanced medical technologies. However, Asia-Pacific is poised for rapid expansion, driven by increasing healthcare spending and a growing awareness of advanced diagnostics in rapidly developing economies like China and India. The competitive landscape is populated by both established medical device companies and innovative start-ups, leading to continuous advancements in sensor technology and the development of innovative applications. The ongoing research and development efforts in areas like biodegradability and improved data transmission are expected to further shape the ingestible sensor market's future.
Ingestible Sensors Market Report: 2019-2033 - A Comprehensive Analysis
This comprehensive report provides a detailed analysis of the Ingestible Sensors market, offering invaluable insights for industry stakeholders, investors, and researchers. Covering the period from 2019 to 2033, with a focus on 2025, this report unveils the market dynamics, leading players, and future growth prospects of this rapidly evolving sector. The global market size is projected to reach xx Million by 2033, showcasing significant growth potential.
Ingestible Sensors Industry Market Dynamics & Concentration
The ingestible sensors market is characterized by a moderate level of concentration, with key players such as CapsoVision Inc, Medtronic PLC (Given Imaging Inc), MC10, IntroMedic Co Ltd, Proteus Digital Health Inc, Olympus Corporation, JINSHAN Science & Technology, and HQ Inc vying for market share. Market concentration is expected to increase slightly over the forecast period due to ongoing mergers and acquisitions (M&A) activity. The estimated market share for Medtronic PLC in 2025 is xx%, while CapsoVision Inc holds approximately xx%. The number of M&A deals in the sector during the historical period (2019-2024) averaged approximately xx per year, indicating a robust level of consolidation. Innovation is a key driver, with companies continuously developing more advanced sensors with improved functionalities. Stringent regulatory frameworks govern the development and approval of ingestible sensors, impacting the market's growth trajectory. The increasing demand for minimally invasive diagnostic and therapeutic procedures fuels the adoption of ingestible sensors, while advancements in materials science and miniaturization technologies are further driving market expansion. Substitute technologies exist, but their limitations often favor ingestible sensors, especially in remote monitoring applications. End-user trends reflect a growing preference for personalized and convenient healthcare solutions, supporting the growth of this market segment.
Ingestible Sensors Industry Industry Trends & Analysis
The ingestible sensors market is experiencing robust growth, driven by several key factors. Technological advancements, particularly in miniaturization and wireless communication, are enabling the development of more sophisticated and versatile sensors. The rising prevalence of chronic diseases and the growing demand for remote patient monitoring (RPM) are significantly boosting market expansion. The Compound Annual Growth Rate (CAGR) from 2025 to 2033 is projected to be xx%, indicating a high growth trajectory. Market penetration remains relatively low in several regions, presenting substantial untapped potential for future growth. Consumer preferences are shifting towards non-invasive, convenient, and personalized healthcare solutions, making ingestible sensors highly attractive. Competitive dynamics are intensifying as existing players expand their product portfolios and new entrants emerge, particularly focusing on innovation and niche applications. The increasing integration of ingestible sensors with wearable technology and digital health platforms also presents a key growth opportunity. The market is witnessing an evolution towards more sophisticated sensors capable of capturing multiple physiological parameters simultaneously and providing real-time data analysis. This trend is likely to continue, driving demand for advanced sensor technologies and related services.
Leading Markets & Segments in Ingestible Sensors Industry
The Healthcare/Medical industry vertical dominates the ingestible sensors market, accounting for xx% of the total market revenue in 2025. Within sensor types, the demand for pH sensors and image sensors has experienced accelerated growth, driven by their applications in gastrointestinal diagnosis and monitoring.
Key Drivers for Healthcare/Medical Dominance:
- Stringent regulatory frameworks supporting the adoption of advanced medical technologies.
- Rising prevalence of chronic diseases requiring continuous monitoring and management.
- Growing adoption of telehealth and remote patient monitoring solutions.
Dominant Regions/Countries:
North America and Europe currently hold the largest market share, driven by robust healthcare infrastructure, high adoption rates of advanced medical technologies, and favorable regulatory environments. However, developing economies in Asia-Pacific are exhibiting rapid growth, fueled by expanding healthcare infrastructure and increasing awareness of ingestible sensor technologies.
By Sensor Type:
- Temperature Sensor: Driven by applications in monitoring body temperature during various medical procedures and conditions.
- Pressure Sensor: Used extensively in measuring intra-gastric pressure for various applications.
- pH Sensor: Widely used for gastrointestinal health diagnostics, leading to significant market growth.
- Image Sensor: Facilitates capturing images of the gastrointestinal tract, driving innovation and demand.
By Industry Vertical:
- Healthcare/Medical: The largest segment driven by diagnostic and therapeutic applications.
- Sport & Fitness: Growing segment utilizing sensors to monitor athletes’ performance and health.
- Other Industry Verticals: This segment includes niche applications in environmental monitoring and industrial process control, representing a smaller market segment but with significant growth potential.
Ingestible Sensors Industry Product Developments
Recent years have witnessed remarkable advancements in ingestible sensor technology, focusing on miniaturization, improved biocompatibility, and enhanced data transmission capabilities. The integration of advanced materials and microelectronics has resulted in smaller, more durable, and more efficient sensors. Innovations in wireless communication technologies allow for real-time data transmission and remote monitoring, transforming the possibilities for various healthcare applications. These advancements are making ingestible sensors more accessible and user-friendly, thereby enhancing their market fit and widening their adoption across various healthcare and fitness segments. The trend towards disposable and single-use sensors is also gaining traction.
Key Drivers of Ingestible Sensors Industry Growth
Several key factors are propelling the growth of the ingestible sensors market. Firstly, technological advancements in miniaturization, power management, and wireless communication are enabling the development of smaller, more efficient, and user-friendly sensors. Secondly, the rising prevalence of chronic diseases necessitates effective monitoring and treatment strategies, driving demand for these sensors. Thirdly, supportive government regulations and initiatives are promoting the adoption of advanced diagnostic and therapeutic tools, including ingestible sensors. Finally, increasing consumer awareness of personalized healthcare and convenient monitoring solutions is driving market expansion.
Challenges in the Ingestible Sensors Industry Market
The ingestible sensors industry faces several challenges. Strict regulatory approvals processes can delay product launches and increase development costs. Supply chain disruptions can impact the availability of components and affect production timelines. Intense competition from established and emerging players necessitates continuous innovation and differentiation to maintain a competitive edge. The high cost of development and manufacturing can limit market accessibility, particularly in developing countries. Furthermore, potential safety concerns and user acceptance remain significant barriers. These factors are expected to collectively reduce market growth by approximately xx Million over the forecast period.
Emerging Opportunities in Ingestible Sensors Industry
Several emerging opportunities are shaping the future of the ingestible sensors market. Technological breakthroughs in areas such as bio-integrated sensors, advanced materials, and AI-driven data analytics are opening new avenues for innovation. Strategic partnerships between sensor manufacturers, healthcare providers, and technology companies are creating synergistic opportunities for market expansion. The exploration of new applications in various sectors beyond healthcare, such as environmental monitoring and industrial process control, presents significant long-term growth potential. Expansion into untapped markets, particularly in developing countries with significant unmet healthcare needs, holds substantial promise.
Leading Players in the Ingestible Sensors Industry Sector
- CapsoVision Inc
- Medtronic PLC (Given Imaging Inc)
- MC10
- IntroMedic Co Ltd
- Proteus Digital Health Inc
- Olympus Corporation
- JINSHAN Science & Technology
- HQ Inc
Key Milestones in Ingestible Sensors Industry Industry
- 2020: FDA approval of a novel ingestible sensor for gastrointestinal monitoring.
- 2021: Strategic partnership between a leading sensor manufacturer and a major pharmaceutical company for collaborative R&D.
- 2022: Launch of a new generation of ingestible sensors with enhanced functionality and improved biocompatibility.
- 2023: Acquisition of a smaller ingestible sensor company by a larger multinational corporation.
- 2024: Publication of significant clinical trial results demonstrating the efficacy of a new ingestible sensor technology.
Strategic Outlook for Ingestible Sensors Industry Market
The ingestible sensors market is poised for significant growth over the next decade, driven by technological advancements, rising healthcare demands, and favorable regulatory environments. Strategic partnerships, collaborations, and M&A activities will play a crucial role in shaping market dynamics. Companies focusing on innovation, product diversification, and market expansion will be well-positioned to capture significant market share. The integration of ingestible sensors with other digital health technologies will further enhance their capabilities and expand their applications, leading to increased market penetration and substantial long-term growth. The market is anticipated to continue its growth trajectory, driven by the factors outlined above.
Ingestible Sensors Industry Segmentation
-
1. Sensor Type
- 1.1. Temperature Sensor
- 1.2. Pressure Sensor
- 1.3. pH Sensor
- 1.4. Image Sensor
-
2. Industry Vertical
- 2.1. Healthcare/Medical
- 2.2. Sport & Fitness
- 2.3. Other Industry Verticals
Ingestible Sensors Industry Segmentation By Geography
- 1. North America
- 2. Europe
- 3. Asia Pacific
- 4. Latin America
- 5. Middle East
Ingestible Sensors Industry REPORT HIGHLIGHTS
| Aspects | Details |
|---|---|
| Study Period | 2019-2033 |
| Base Year | 2024 |
| Estimated Year | 2025 |
| Forecast Period | 2025-2033 |
| Historical Period | 2019-2024 |
| Growth Rate | CAGR of 18.70% from 2019-2033 |
| Segmentation |
|
Table of Contents
- 1. Introduction
- 1.1. Research Scope
- 1.2. Market Segmentation
- 1.3. Research Methodology
- 1.4. Definitions and Assumptions
- 2. Executive Summary
- 2.1. Introduction
- 3. Market Dynamics
- 3.1. Introduction
- 3.2. Market Drivers
- 3.2.1. ; Cost Effectiveness and Availability of Reimbursements; Increasing Demand for Medical Adherence Monitoring; Technological Advancements and Increasing Investments
- 3.3. Market Restrains
- 3.3.1. ; Technical and Clinical Concerns; High Technology Cost
- 3.4. Market Trends
- 3.4.1. Healthcare/Medical Sector to hold a Significant Market Share.
- 4. Market Factor Analysis
- 4.1. Porters Five Forces
- 4.2. Supply/Value Chain
- 4.3. PESTEL analysis
- 4.4. Market Entropy
- 4.5. Patent/Trademark Analysis
- 5. Global Ingestible Sensors Industry Analysis, Insights and Forecast, 2019-2031
- 5.1. Market Analysis, Insights and Forecast - by Sensor Type
- 5.1.1. Temperature Sensor
- 5.1.2. Pressure Sensor
- 5.1.3. pH Sensor
- 5.1.4. Image Sensor
- 5.2. Market Analysis, Insights and Forecast - by Industry Vertical
- 5.2.1. Healthcare/Medical
- 5.2.2. Sport & Fitness
- 5.2.3. Other Industry Verticals
- 5.3. Market Analysis, Insights and Forecast - by Region
- 5.3.1. North America
- 5.3.2. Europe
- 5.3.3. Asia Pacific
- 5.3.4. Latin America
- 5.3.5. Middle East
- 5.1. Market Analysis, Insights and Forecast - by Sensor Type
- 6. North America Ingestible Sensors Industry Analysis, Insights and Forecast, 2019-2031
- 6.1. Market Analysis, Insights and Forecast - by Sensor Type
- 6.1.1. Temperature Sensor
- 6.1.2. Pressure Sensor
- 6.1.3. pH Sensor
- 6.1.4. Image Sensor
- 6.2. Market Analysis, Insights and Forecast - by Industry Vertical
- 6.2.1. Healthcare/Medical
- 6.2.2. Sport & Fitness
- 6.2.3. Other Industry Verticals
- 6.1. Market Analysis, Insights and Forecast - by Sensor Type
- 7. Europe Ingestible Sensors Industry Analysis, Insights and Forecast, 2019-2031
- 7.1. Market Analysis, Insights and Forecast - by Sensor Type
- 7.1.1. Temperature Sensor
- 7.1.2. Pressure Sensor
- 7.1.3. pH Sensor
- 7.1.4. Image Sensor
- 7.2. Market Analysis, Insights and Forecast - by Industry Vertical
- 7.2.1. Healthcare/Medical
- 7.2.2. Sport & Fitness
- 7.2.3. Other Industry Verticals
- 7.1. Market Analysis, Insights and Forecast - by Sensor Type
- 8. Asia Pacific Ingestible Sensors Industry Analysis, Insights and Forecast, 2019-2031
- 8.1. Market Analysis, Insights and Forecast - by Sensor Type
- 8.1.1. Temperature Sensor
- 8.1.2. Pressure Sensor
- 8.1.3. pH Sensor
- 8.1.4. Image Sensor
- 8.2. Market Analysis, Insights and Forecast - by Industry Vertical
- 8.2.1. Healthcare/Medical
- 8.2.2. Sport & Fitness
- 8.2.3. Other Industry Verticals
- 8.1. Market Analysis, Insights and Forecast - by Sensor Type
- 9. Latin America Ingestible Sensors Industry Analysis, Insights and Forecast, 2019-2031
- 9.1. Market Analysis, Insights and Forecast - by Sensor Type
- 9.1.1. Temperature Sensor
- 9.1.2. Pressure Sensor
- 9.1.3. pH Sensor
- 9.1.4. Image Sensor
- 9.2. Market Analysis, Insights and Forecast - by Industry Vertical
- 9.2.1. Healthcare/Medical
- 9.2.2. Sport & Fitness
- 9.2.3. Other Industry Verticals
- 9.1. Market Analysis, Insights and Forecast - by Sensor Type
- 10. Middle East Ingestible Sensors Industry Analysis, Insights and Forecast, 2019-2031
- 10.1. Market Analysis, Insights and Forecast - by Sensor Type
- 10.1.1. Temperature Sensor
- 10.1.2. Pressure Sensor
- 10.1.3. pH Sensor
- 10.1.4. Image Sensor
- 10.2. Market Analysis, Insights and Forecast - by Industry Vertical
- 10.2.1. Healthcare/Medical
- 10.2.2. Sport & Fitness
- 10.2.3. Other Industry Verticals
- 10.1. Market Analysis, Insights and Forecast - by Sensor Type
- 11. North America Ingestible Sensors Industry Analysis, Insights and Forecast, 2019-2031
- 11.1. Market Analysis, Insights and Forecast - By Country/Sub-region
- 11.1.1 United States
- 11.1.2 Canada
- 11.1.3 Mexico
- 12. Europe Ingestible Sensors Industry Analysis, Insights and Forecast, 2019-2031
- 12.1. Market Analysis, Insights and Forecast - By Country/Sub-region
- 12.1.1 Germany
- 12.1.2 United Kingdom
- 12.1.3 France
- 12.1.4 Spain
- 12.1.5 Italy
- 12.1.6 Spain
- 12.1.7 Belgium
- 12.1.8 Netherland
- 12.1.9 Nordics
- 12.1.10 Rest of Europe
- 13. Asia Pacific Ingestible Sensors Industry Analysis, Insights and Forecast, 2019-2031
- 13.1. Market Analysis, Insights and Forecast - By Country/Sub-region
- 13.1.1 China
- 13.1.2 Japan
- 13.1.3 India
- 13.1.4 South Korea
- 13.1.5 Southeast Asia
- 13.1.6 Australia
- 13.1.7 Indonesia
- 13.1.8 Phillipes
- 13.1.9 Singapore
- 13.1.10 Thailandc
- 13.1.11 Rest of Asia Pacific
- 14. South America Ingestible Sensors Industry Analysis, Insights and Forecast, 2019-2031
- 14.1. Market Analysis, Insights and Forecast - By Country/Sub-region
- 14.1.1 Brazil
- 14.1.2 Argentina
- 14.1.3 Peru
- 14.1.4 Chile
- 14.1.5 Colombia
- 14.1.6 Ecuador
- 14.1.7 Venezuela
- 14.1.8 Rest of South America
- 15. North America Ingestible Sensors Industry Analysis, Insights and Forecast, 2019-2031
- 15.1. Market Analysis, Insights and Forecast - By Country/Sub-region
- 15.1.1 United States
- 15.1.2 Canada
- 15.1.3 Mexico
- 16. MEA Ingestible Sensors Industry Analysis, Insights and Forecast, 2019-2031
- 16.1. Market Analysis, Insights and Forecast - By Country/Sub-region
- 16.1.1 United Arab Emirates
- 16.1.2 Saudi Arabia
- 16.1.3 South Africa
- 16.1.4 Rest of Middle East and Africa
- 17. Competitive Analysis
- 17.1. Global Market Share Analysis 2024
- 17.2. Company Profiles
- 17.2.1 CapsoVision Inc
- 17.2.1.1. Overview
- 17.2.1.2. Products
- 17.2.1.3. SWOT Analysis
- 17.2.1.4. Recent Developments
- 17.2.1.5. Financials (Based on Availability)
- 17.2.2 Medtronic PLC (Given Imaging Inc )
- 17.2.2.1. Overview
- 17.2.2.2. Products
- 17.2.2.3. SWOT Analysis
- 17.2.2.4. Recent Developments
- 17.2.2.5. Financials (Based on Availability)
- 17.2.3 MC10
- 17.2.3.1. Overview
- 17.2.3.2. Products
- 17.2.3.3. SWOT Analysis
- 17.2.3.4. Recent Developments
- 17.2.3.5. Financials (Based on Availability)
- 17.2.4 IntroMedic Co Ltd
- 17.2.4.1. Overview
- 17.2.4.2. Products
- 17.2.4.3. SWOT Analysis
- 17.2.4.4. Recent Developments
- 17.2.4.5. Financials (Based on Availability)
- 17.2.5 Proteus Digital Health Inc
- 17.2.5.1. Overview
- 17.2.5.2. Products
- 17.2.5.3. SWOT Analysis
- 17.2.5.4. Recent Developments
- 17.2.5.5. Financials (Based on Availability)
- 17.2.6 Olympus Corporation
- 17.2.6.1. Overview
- 17.2.6.2. Products
- 17.2.6.3. SWOT Analysis
- 17.2.6.4. Recent Developments
- 17.2.6.5. Financials (Based on Availability)
- 17.2.7 JINSHAN Science & Technology
- 17.2.7.1. Overview
- 17.2.7.2. Products
- 17.2.7.3. SWOT Analysis
- 17.2.7.4. Recent Developments
- 17.2.7.5. Financials (Based on Availability)
- 17.2.8 HQ Inc
- 17.2.8.1. Overview
- 17.2.8.2. Products
- 17.2.8.3. SWOT Analysis
- 17.2.8.4. Recent Developments
- 17.2.8.5. Financials (Based on Availability)
- 17.2.1 CapsoVision Inc
List of Figures
- Figure 1: Global Ingestible Sensors Industry Revenue Breakdown (Million, %) by Region 2024 & 2032
- Figure 2: Global Ingestible Sensors Industry Volume Breakdown (K Unit, %) by Region 2024 & 2032
- Figure 3: North America Ingestible Sensors Industry Revenue (Million), by Country 2024 & 2032
- Figure 4: North America Ingestible Sensors Industry Volume (K Unit), by Country 2024 & 2032
- Figure 5: North America Ingestible Sensors Industry Revenue Share (%), by Country 2024 & 2032
- Figure 6: North America Ingestible Sensors Industry Volume Share (%), by Country 2024 & 2032
- Figure 7: Europe Ingestible Sensors Industry Revenue (Million), by Country 2024 & 2032
- Figure 8: Europe Ingestible Sensors Industry Volume (K Unit), by Country 2024 & 2032
- Figure 9: Europe Ingestible Sensors Industry Revenue Share (%), by Country 2024 & 2032
- Figure 10: Europe Ingestible Sensors Industry Volume Share (%), by Country 2024 & 2032
- Figure 11: Asia Pacific Ingestible Sensors Industry Revenue (Million), by Country 2024 & 2032
- Figure 12: Asia Pacific Ingestible Sensors Industry Volume (K Unit), by Country 2024 & 2032
- Figure 13: Asia Pacific Ingestible Sensors Industry Revenue Share (%), by Country 2024 & 2032
- Figure 14: Asia Pacific Ingestible Sensors Industry Volume Share (%), by Country 2024 & 2032
- Figure 15: South America Ingestible Sensors Industry Revenue (Million), by Country 2024 & 2032
- Figure 16: South America Ingestible Sensors Industry Volume (K Unit), by Country 2024 & 2032
- Figure 17: South America Ingestible Sensors Industry Revenue Share (%), by Country 2024 & 2032
- Figure 18: South America Ingestible Sensors Industry Volume Share (%), by Country 2024 & 2032
- Figure 19: North America Ingestible Sensors Industry Revenue (Million), by Country 2024 & 2032
- Figure 20: North America Ingestible Sensors Industry Volume (K Unit), by Country 2024 & 2032
- Figure 21: North America Ingestible Sensors Industry Revenue Share (%), by Country 2024 & 2032
- Figure 22: North America Ingestible Sensors Industry Volume Share (%), by Country 2024 & 2032
- Figure 23: MEA Ingestible Sensors Industry Revenue (Million), by Country 2024 & 2032
- Figure 24: MEA Ingestible Sensors Industry Volume (K Unit), by Country 2024 & 2032
- Figure 25: MEA Ingestible Sensors Industry Revenue Share (%), by Country 2024 & 2032
- Figure 26: MEA Ingestible Sensors Industry Volume Share (%), by Country 2024 & 2032
- Figure 27: North America Ingestible Sensors Industry Revenue (Million), by Sensor Type 2024 & 2032
- Figure 28: North America Ingestible Sensors Industry Volume (K Unit), by Sensor Type 2024 & 2032
- Figure 29: North America Ingestible Sensors Industry Revenue Share (%), by Sensor Type 2024 & 2032
- Figure 30: North America Ingestible Sensors Industry Volume Share (%), by Sensor Type 2024 & 2032
- Figure 31: North America Ingestible Sensors Industry Revenue (Million), by Industry Vertical 2024 & 2032
- Figure 32: North America Ingestible Sensors Industry Volume (K Unit), by Industry Vertical 2024 & 2032
- Figure 33: North America Ingestible Sensors Industry Revenue Share (%), by Industry Vertical 2024 & 2032
- Figure 34: North America Ingestible Sensors Industry Volume Share (%), by Industry Vertical 2024 & 2032
- Figure 35: North America Ingestible Sensors Industry Revenue (Million), by Country 2024 & 2032
- Figure 36: North America Ingestible Sensors Industry Volume (K Unit), by Country 2024 & 2032
- Figure 37: North America Ingestible Sensors Industry Revenue Share (%), by Country 2024 & 2032
- Figure 38: North America Ingestible Sensors Industry Volume Share (%), by Country 2024 & 2032
- Figure 39: Europe Ingestible Sensors Industry Revenue (Million), by Sensor Type 2024 & 2032
- Figure 40: Europe Ingestible Sensors Industry Volume (K Unit), by Sensor Type 2024 & 2032
- Figure 41: Europe Ingestible Sensors Industry Revenue Share (%), by Sensor Type 2024 & 2032
- Figure 42: Europe Ingestible Sensors Industry Volume Share (%), by Sensor Type 2024 & 2032
- Figure 43: Europe Ingestible Sensors Industry Revenue (Million), by Industry Vertical 2024 & 2032
- Figure 44: Europe Ingestible Sensors Industry Volume (K Unit), by Industry Vertical 2024 & 2032
- Figure 45: Europe Ingestible Sensors Industry Revenue Share (%), by Industry Vertical 2024 & 2032
- Figure 46: Europe Ingestible Sensors Industry Volume Share (%), by Industry Vertical 2024 & 2032
- Figure 47: Europe Ingestible Sensors Industry Revenue (Million), by Country 2024 & 2032
- Figure 48: Europe Ingestible Sensors Industry Volume (K Unit), by Country 2024 & 2032
- Figure 49: Europe Ingestible Sensors Industry Revenue Share (%), by Country 2024 & 2032
- Figure 50: Europe Ingestible Sensors Industry Volume Share (%), by Country 2024 & 2032
- Figure 51: Asia Pacific Ingestible Sensors Industry Revenue (Million), by Sensor Type 2024 & 2032
- Figure 52: Asia Pacific Ingestible Sensors Industry Volume (K Unit), by Sensor Type 2024 & 2032
- Figure 53: Asia Pacific Ingestible Sensors Industry Revenue Share (%), by Sensor Type 2024 & 2032
- Figure 54: Asia Pacific Ingestible Sensors Industry Volume Share (%), by Sensor Type 2024 & 2032
- Figure 55: Asia Pacific Ingestible Sensors Industry Revenue (Million), by Industry Vertical 2024 & 2032
- Figure 56: Asia Pacific Ingestible Sensors Industry Volume (K Unit), by Industry Vertical 2024 & 2032
- Figure 57: Asia Pacific Ingestible Sensors Industry Revenue Share (%), by Industry Vertical 2024 & 2032
- Figure 58: Asia Pacific Ingestible Sensors Industry Volume Share (%), by Industry Vertical 2024 & 2032
- Figure 59: Asia Pacific Ingestible Sensors Industry Revenue (Million), by Country 2024 & 2032
- Figure 60: Asia Pacific Ingestible Sensors Industry Volume (K Unit), by Country 2024 & 2032
- Figure 61: Asia Pacific Ingestible Sensors Industry Revenue Share (%), by Country 2024 & 2032
- Figure 62: Asia Pacific Ingestible Sensors Industry Volume Share (%), by Country 2024 & 2032
- Figure 63: Latin America Ingestible Sensors Industry Revenue (Million), by Sensor Type 2024 & 2032
- Figure 64: Latin America Ingestible Sensors Industry Volume (K Unit), by Sensor Type 2024 & 2032
- Figure 65: Latin America Ingestible Sensors Industry Revenue Share (%), by Sensor Type 2024 & 2032
- Figure 66: Latin America Ingestible Sensors Industry Volume Share (%), by Sensor Type 2024 & 2032
- Figure 67: Latin America Ingestible Sensors Industry Revenue (Million), by Industry Vertical 2024 & 2032
- Figure 68: Latin America Ingestible Sensors Industry Volume (K Unit), by Industry Vertical 2024 & 2032
- Figure 69: Latin America Ingestible Sensors Industry Revenue Share (%), by Industry Vertical 2024 & 2032
- Figure 70: Latin America Ingestible Sensors Industry Volume Share (%), by Industry Vertical 2024 & 2032
- Figure 71: Latin America Ingestible Sensors Industry Revenue (Million), by Country 2024 & 2032
- Figure 72: Latin America Ingestible Sensors Industry Volume (K Unit), by Country 2024 & 2032
- Figure 73: Latin America Ingestible Sensors Industry Revenue Share (%), by Country 2024 & 2032
- Figure 74: Latin America Ingestible Sensors Industry Volume Share (%), by Country 2024 & 2032
- Figure 75: Middle East Ingestible Sensors Industry Revenue (Million), by Sensor Type 2024 & 2032
- Figure 76: Middle East Ingestible Sensors Industry Volume (K Unit), by Sensor Type 2024 & 2032
- Figure 77: Middle East Ingestible Sensors Industry Revenue Share (%), by Sensor Type 2024 & 2032
- Figure 78: Middle East Ingestible Sensors Industry Volume Share (%), by Sensor Type 2024 & 2032
- Figure 79: Middle East Ingestible Sensors Industry Revenue (Million), by Industry Vertical 2024 & 2032
- Figure 80: Middle East Ingestible Sensors Industry Volume (K Unit), by Industry Vertical 2024 & 2032
- Figure 81: Middle East Ingestible Sensors Industry Revenue Share (%), by Industry Vertical 2024 & 2032
- Figure 82: Middle East Ingestible Sensors Industry Volume Share (%), by Industry Vertical 2024 & 2032
- Figure 83: Middle East Ingestible Sensors Industry Revenue (Million), by Country 2024 & 2032
- Figure 84: Middle East Ingestible Sensors Industry Volume (K Unit), by Country 2024 & 2032
- Figure 85: Middle East Ingestible Sensors Industry Revenue Share (%), by Country 2024 & 2032
- Figure 86: Middle East Ingestible Sensors Industry Volume Share (%), by Country 2024 & 2032
List of Tables
- Table 1: Global Ingestible Sensors Industry Revenue Million Forecast, by Region 2019 & 2032
- Table 2: Global Ingestible Sensors Industry Volume K Unit Forecast, by Region 2019 & 2032
- Table 3: Global Ingestible Sensors Industry Revenue Million Forecast, by Sensor Type 2019 & 2032
- Table 4: Global Ingestible Sensors Industry Volume K Unit Forecast, by Sensor Type 2019 & 2032
- Table 5: Global Ingestible Sensors Industry Revenue Million Forecast, by Industry Vertical 2019 & 2032
- Table 6: Global Ingestible Sensors Industry Volume K Unit Forecast, by Industry Vertical 2019 & 2032
- Table 7: Global Ingestible Sensors Industry Revenue Million Forecast, by Region 2019 & 2032
- Table 8: Global Ingestible Sensors Industry Volume K Unit Forecast, by Region 2019 & 2032
- Table 9: Global Ingestible Sensors Industry Revenue Million Forecast, by Country 2019 & 2032
- Table 10: Global Ingestible Sensors Industry Volume K Unit Forecast, by Country 2019 & 2032
- Table 11: United States Ingestible Sensors Industry Revenue (Million) Forecast, by Application 2019 & 2032
- Table 12: United States Ingestible Sensors Industry Volume (K Unit) Forecast, by Application 2019 & 2032
- Table 13: Canada Ingestible Sensors Industry Revenue (Million) Forecast, by Application 2019 & 2032
- Table 14: Canada Ingestible Sensors Industry Volume (K Unit) Forecast, by Application 2019 & 2032
- Table 15: Mexico Ingestible Sensors Industry Revenue (Million) Forecast, by Application 2019 & 2032
- Table 16: Mexico Ingestible Sensors Industry Volume (K Unit) Forecast, by Application 2019 & 2032
- Table 17: Global Ingestible Sensors Industry Revenue Million Forecast, by Country 2019 & 2032
- Table 18: Global Ingestible Sensors Industry Volume K Unit Forecast, by Country 2019 & 2032
- Table 19: Germany Ingestible Sensors Industry Revenue (Million) Forecast, by Application 2019 & 2032
- Table 20: Germany Ingestible Sensors Industry Volume (K Unit) Forecast, by Application 2019 & 2032
- Table 21: United Kingdom Ingestible Sensors Industry Revenue (Million) Forecast, by Application 2019 & 2032
- Table 22: United Kingdom Ingestible Sensors Industry Volume (K Unit) Forecast, by Application 2019 & 2032
- Table 23: France Ingestible Sensors Industry Revenue (Million) Forecast, by Application 2019 & 2032
- Table 24: France Ingestible Sensors Industry Volume (K Unit) Forecast, by Application 2019 & 2032
- Table 25: Spain Ingestible Sensors Industry Revenue (Million) Forecast, by Application 2019 & 2032
- Table 26: Spain Ingestible Sensors Industry Volume (K Unit) Forecast, by Application 2019 & 2032
- Table 27: Italy Ingestible Sensors Industry Revenue (Million) Forecast, by Application 2019 & 2032
- Table 28: Italy Ingestible Sensors Industry Volume (K Unit) Forecast, by Application 2019 & 2032
- Table 29: Spain Ingestible Sensors Industry Revenue (Million) Forecast, by Application 2019 & 2032
- Table 30: Spain Ingestible Sensors Industry Volume (K Unit) Forecast, by Application 2019 & 2032
- Table 31: Belgium Ingestible Sensors Industry Revenue (Million) Forecast, by Application 2019 & 2032
- Table 32: Belgium Ingestible Sensors Industry Volume (K Unit) Forecast, by Application 2019 & 2032
- Table 33: Netherland Ingestible Sensors Industry Revenue (Million) Forecast, by Application 2019 & 2032
- Table 34: Netherland Ingestible Sensors Industry Volume (K Unit) Forecast, by Application 2019 & 2032
- Table 35: Nordics Ingestible Sensors Industry Revenue (Million) Forecast, by Application 2019 & 2032
- Table 36: Nordics Ingestible Sensors Industry Volume (K Unit) Forecast, by Application 2019 & 2032
- Table 37: Rest of Europe Ingestible Sensors Industry Revenue (Million) Forecast, by Application 2019 & 2032
- Table 38: Rest of Europe Ingestible Sensors Industry Volume (K Unit) Forecast, by Application 2019 & 2032
- Table 39: Global Ingestible Sensors Industry Revenue Million Forecast, by Country 2019 & 2032
- Table 40: Global Ingestible Sensors Industry Volume K Unit Forecast, by Country 2019 & 2032
- Table 41: China Ingestible Sensors Industry Revenue (Million) Forecast, by Application 2019 & 2032
- Table 42: China Ingestible Sensors Industry Volume (K Unit) Forecast, by Application 2019 & 2032
- Table 43: Japan Ingestible Sensors Industry Revenue (Million) Forecast, by Application 2019 & 2032
- Table 44: Japan Ingestible Sensors Industry Volume (K Unit) Forecast, by Application 2019 & 2032
- Table 45: India Ingestible Sensors Industry Revenue (Million) Forecast, by Application 2019 & 2032
- Table 46: India Ingestible Sensors Industry Volume (K Unit) Forecast, by Application 2019 & 2032
- Table 47: South Korea Ingestible Sensors Industry Revenue (Million) Forecast, by Application 2019 & 2032
- Table 48: South Korea Ingestible Sensors Industry Volume (K Unit) Forecast, by Application 2019 & 2032
- Table 49: Southeast Asia Ingestible Sensors Industry Revenue (Million) Forecast, by Application 2019 & 2032
- Table 50: Southeast Asia Ingestible Sensors Industry Volume (K Unit) Forecast, by Application 2019 & 2032
- Table 51: Australia Ingestible Sensors Industry Revenue (Million) Forecast, by Application 2019 & 2032
- Table 52: Australia Ingestible Sensors Industry Volume (K Unit) Forecast, by Application 2019 & 2032
- Table 53: Indonesia Ingestible Sensors Industry Revenue (Million) Forecast, by Application 2019 & 2032
- Table 54: Indonesia Ingestible Sensors Industry Volume (K Unit) Forecast, by Application 2019 & 2032
- Table 55: Phillipes Ingestible Sensors Industry Revenue (Million) Forecast, by Application 2019 & 2032
- Table 56: Phillipes Ingestible Sensors Industry Volume (K Unit) Forecast, by Application 2019 & 2032
- Table 57: Singapore Ingestible Sensors Industry Revenue (Million) Forecast, by Application 2019 & 2032
- Table 58: Singapore Ingestible Sensors Industry Volume (K Unit) Forecast, by Application 2019 & 2032
- Table 59: Thailandc Ingestible Sensors Industry Revenue (Million) Forecast, by Application 2019 & 2032
- Table 60: Thailandc Ingestible Sensors Industry Volume (K Unit) Forecast, by Application 2019 & 2032
- Table 61: Rest of Asia Pacific Ingestible Sensors Industry Revenue (Million) Forecast, by Application 2019 & 2032
- Table 62: Rest of Asia Pacific Ingestible Sensors Industry Volume (K Unit) Forecast, by Application 2019 & 2032
- Table 63: Global Ingestible Sensors Industry Revenue Million Forecast, by Country 2019 & 2032
- Table 64: Global Ingestible Sensors Industry Volume K Unit Forecast, by Country 2019 & 2032
- Table 65: Brazil Ingestible Sensors Industry Revenue (Million) Forecast, by Application 2019 & 2032
- Table 66: Brazil Ingestible Sensors Industry Volume (K Unit) Forecast, by Application 2019 & 2032
- Table 67: Argentina Ingestible Sensors Industry Revenue (Million) Forecast, by Application 2019 & 2032
- Table 68: Argentina Ingestible Sensors Industry Volume (K Unit) Forecast, by Application 2019 & 2032
- Table 69: Peru Ingestible Sensors Industry Revenue (Million) Forecast, by Application 2019 & 2032
- Table 70: Peru Ingestible Sensors Industry Volume (K Unit) Forecast, by Application 2019 & 2032
- Table 71: Chile Ingestible Sensors Industry Revenue (Million) Forecast, by Application 2019 & 2032
- Table 72: Chile Ingestible Sensors Industry Volume (K Unit) Forecast, by Application 2019 & 2032
- Table 73: Colombia Ingestible Sensors Industry Revenue (Million) Forecast, by Application 2019 & 2032
- Table 74: Colombia Ingestible Sensors Industry Volume (K Unit) Forecast, by Application 2019 & 2032
- Table 75: Ecuador Ingestible Sensors Industry Revenue (Million) Forecast, by Application 2019 & 2032
- Table 76: Ecuador Ingestible Sensors Industry Volume (K Unit) Forecast, by Application 2019 & 2032
- Table 77: Venezuela Ingestible Sensors Industry Revenue (Million) Forecast, by Application 2019 & 2032
- Table 78: Venezuela Ingestible Sensors Industry Volume (K Unit) Forecast, by Application 2019 & 2032
- Table 79: Rest of South America Ingestible Sensors Industry Revenue (Million) Forecast, by Application 2019 & 2032
- Table 80: Rest of South America Ingestible Sensors Industry Volume (K Unit) Forecast, by Application 2019 & 2032
- Table 81: Global Ingestible Sensors Industry Revenue Million Forecast, by Country 2019 & 2032
- Table 82: Global Ingestible Sensors Industry Volume K Unit Forecast, by Country 2019 & 2032
- Table 83: United States Ingestible Sensors Industry Revenue (Million) Forecast, by Application 2019 & 2032
- Table 84: United States Ingestible Sensors Industry Volume (K Unit) Forecast, by Application 2019 & 2032
- Table 85: Canada Ingestible Sensors Industry Revenue (Million) Forecast, by Application 2019 & 2032
- Table 86: Canada Ingestible Sensors Industry Volume (K Unit) Forecast, by Application 2019 & 2032
- Table 87: Mexico Ingestible Sensors Industry Revenue (Million) Forecast, by Application 2019 & 2032
- Table 88: Mexico Ingestible Sensors Industry Volume (K Unit) Forecast, by Application 2019 & 2032
- Table 89: Global Ingestible Sensors Industry Revenue Million Forecast, by Country 2019 & 2032
- Table 90: Global Ingestible Sensors Industry Volume K Unit Forecast, by Country 2019 & 2032
- Table 91: United Arab Emirates Ingestible Sensors Industry Revenue (Million) Forecast, by Application 2019 & 2032
- Table 92: United Arab Emirates Ingestible Sensors Industry Volume (K Unit) Forecast, by Application 2019 & 2032
- Table 93: Saudi Arabia Ingestible Sensors Industry Revenue (Million) Forecast, by Application 2019 & 2032
- Table 94: Saudi Arabia Ingestible Sensors Industry Volume (K Unit) Forecast, by Application 2019 & 2032
- Table 95: South Africa Ingestible Sensors Industry Revenue (Million) Forecast, by Application 2019 & 2032
- Table 96: South Africa Ingestible Sensors Industry Volume (K Unit) Forecast, by Application 2019 & 2032
- Table 97: Rest of Middle East and Africa Ingestible Sensors Industry Revenue (Million) Forecast, by Application 2019 & 2032
- Table 98: Rest of Middle East and Africa Ingestible Sensors Industry Volume (K Unit) Forecast, by Application 2019 & 2032
- Table 99: Global Ingestible Sensors Industry Revenue Million Forecast, by Sensor Type 2019 & 2032
- Table 100: Global Ingestible Sensors Industry Volume K Unit Forecast, by Sensor Type 2019 & 2032
- Table 101: Global Ingestible Sensors Industry Revenue Million Forecast, by Industry Vertical 2019 & 2032
- Table 102: Global Ingestible Sensors Industry Volume K Unit Forecast, by Industry Vertical 2019 & 2032
- Table 103: Global Ingestible Sensors Industry Revenue Million Forecast, by Country 2019 & 2032
- Table 104: Global Ingestible Sensors Industry Volume K Unit Forecast, by Country 2019 & 2032
- Table 105: Global Ingestible Sensors Industry Revenue Million Forecast, by Sensor Type 2019 & 2032
- Table 106: Global Ingestible Sensors Industry Volume K Unit Forecast, by Sensor Type 2019 & 2032
- Table 107: Global Ingestible Sensors Industry Revenue Million Forecast, by Industry Vertical 2019 & 2032
- Table 108: Global Ingestible Sensors Industry Volume K Unit Forecast, by Industry Vertical 2019 & 2032
- Table 109: Global Ingestible Sensors Industry Revenue Million Forecast, by Country 2019 & 2032
- Table 110: Global Ingestible Sensors Industry Volume K Unit Forecast, by Country 2019 & 2032
- Table 111: Global Ingestible Sensors Industry Revenue Million Forecast, by Sensor Type 2019 & 2032
- Table 112: Global Ingestible Sensors Industry Volume K Unit Forecast, by Sensor Type 2019 & 2032
- Table 113: Global Ingestible Sensors Industry Revenue Million Forecast, by Industry Vertical 2019 & 2032
- Table 114: Global Ingestible Sensors Industry Volume K Unit Forecast, by Industry Vertical 2019 & 2032
- Table 115: Global Ingestible Sensors Industry Revenue Million Forecast, by Country 2019 & 2032
- Table 116: Global Ingestible Sensors Industry Volume K Unit Forecast, by Country 2019 & 2032
- Table 117: Global Ingestible Sensors Industry Revenue Million Forecast, by Sensor Type 2019 & 2032
- Table 118: Global Ingestible Sensors Industry Volume K Unit Forecast, by Sensor Type 2019 & 2032
- Table 119: Global Ingestible Sensors Industry Revenue Million Forecast, by Industry Vertical 2019 & 2032
- Table 120: Global Ingestible Sensors Industry Volume K Unit Forecast, by Industry Vertical 2019 & 2032
- Table 121: Global Ingestible Sensors Industry Revenue Million Forecast, by Country 2019 & 2032
- Table 122: Global Ingestible Sensors Industry Volume K Unit Forecast, by Country 2019 & 2032
- Table 123: Global Ingestible Sensors Industry Revenue Million Forecast, by Sensor Type 2019 & 2032
- Table 124: Global Ingestible Sensors Industry Volume K Unit Forecast, by Sensor Type 2019 & 2032
- Table 125: Global Ingestible Sensors Industry Revenue Million Forecast, by Industry Vertical 2019 & 2032
- Table 126: Global Ingestible Sensors Industry Volume K Unit Forecast, by Industry Vertical 2019 & 2032
- Table 127: Global Ingestible Sensors Industry Revenue Million Forecast, by Country 2019 & 2032
- Table 128: Global Ingestible Sensors Industry Volume K Unit Forecast, by Country 2019 & 2032
Frequently Asked Questions
1. What is the projected Compound Annual Growth Rate (CAGR) of the Ingestible Sensors Industry?
The projected CAGR is approximately 18.70%.
2. Which companies are prominent players in the Ingestible Sensors Industry?
Key companies in the market include CapsoVision Inc, Medtronic PLC (Given Imaging Inc ), MC10, IntroMedic Co Ltd, Proteus Digital Health Inc, Olympus Corporation, JINSHAN Science & Technology, HQ Inc.
3. What are the main segments of the Ingestible Sensors Industry?
The market segments include Sensor Type, Industry Vertical.
4. Can you provide details about the market size?
The market size is estimated to be USD XX Million as of 2022.
5. What are some drivers contributing to market growth?
; Cost Effectiveness and Availability of Reimbursements; Increasing Demand for Medical Adherence Monitoring; Technological Advancements and Increasing Investments.
6. What are the notable trends driving market growth?
Healthcare/Medical Sector to hold a Significant Market Share..
7. Are there any restraints impacting market growth?
; Technical and Clinical Concerns; High Technology Cost.
8. Can you provide examples of recent developments in the market?
N/A
9. What pricing options are available for accessing the report?
Pricing options include single-user, multi-user, and enterprise licenses priced at USD 4750, USD 5250, and USD 8750 respectively.
10. Is the market size provided in terms of value or volume?
The market size is provided in terms of value, measured in Million and volume, measured in K Unit.
11. Are there any specific market keywords associated with the report?
Yes, the market keyword associated with the report is "Ingestible Sensors Industry," which aids in identifying and referencing the specific market segment covered.
12. How do I determine which pricing option suits my needs best?
The pricing options vary based on user requirements and access needs. Individual users may opt for single-user licenses, while businesses requiring broader access may choose multi-user or enterprise licenses for cost-effective access to the report.
13. Are there any additional resources or data provided in the Ingestible Sensors Industry report?
While the report offers comprehensive insights, it's advisable to review the specific contents or supplementary materials provided to ascertain if additional resources or data are available.
14. How can I stay updated on further developments or reports in the Ingestible Sensors Industry?
To stay informed about further developments, trends, and reports in the Ingestible Sensors Industry, consider subscribing to industry newsletters, following relevant companies and organizations, or regularly checking reputable industry news sources and publications.
Methodology
Step 1 - Identification of Relevant Samples Size from Population Database


Step 2 - Approaches for Defining Global Market Size (Value, Volume* & Price*)

Note*: In applicable scenarios
Step 3 - Data Sources
Primary Research
- Web Analytics
- Survey Reports
- Research Institute
- Latest Research Reports
- Opinion Leaders
Secondary Research
- Annual Reports
- White Paper
- Latest Press Release
- Industry Association
- Paid Database
- Investor Presentations

Step 4 - Data Triangulation
Involves using different sources of information in order to increase the validity of a study
These sources are likely to be stakeholders in a program - participants, other researchers, program staff, other community members, and so on.
Then we put all data in single framework & apply various statistical tools to find out the dynamic on the market.
During the analysis stage, feedback from the stakeholder groups would be compared to determine areas of agreement as well as areas of divergence
