

Key Insights
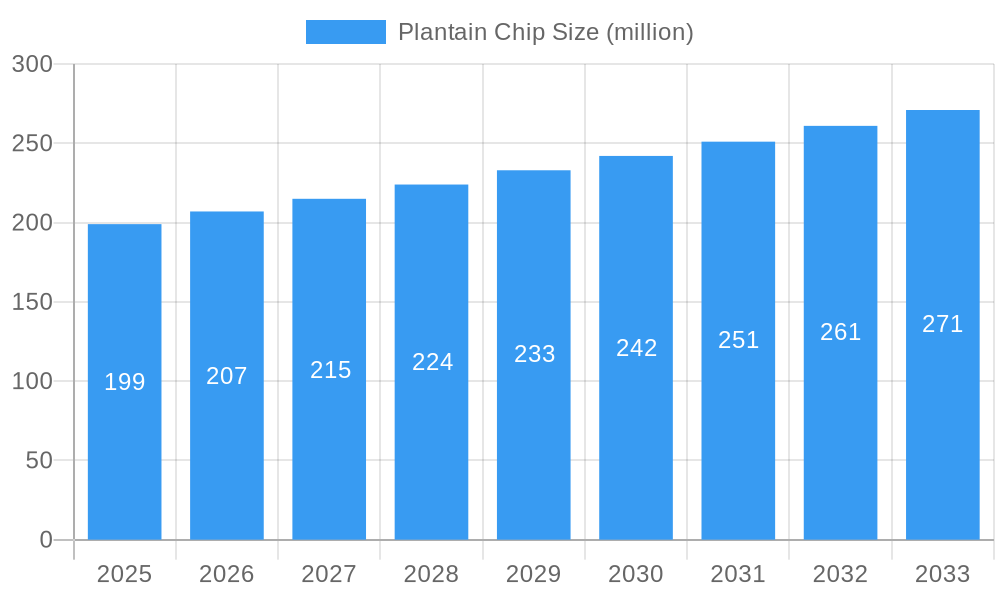
The global plantain chip market, currently valued at $199 million in 2025, is projected to experience steady growth, driven by several key factors. Increasing consumer demand for healthier and convenient snack options fuels this expansion. Plantain chips, naturally gluten-free and a good source of fiber and potassium, align perfectly with these preferences. The rising popularity of ethnic foods and global cuisines within developed markets further contributes to market expansion. Furthermore, the growing availability of plantain chips in diverse formats (e.g., organic, flavored, seasoned) caters to evolving consumer tastes and preferences, stimulating market growth. Innovation in production techniques, focusing on improved texture and shelf life, further enhances market appeal. While pricing fluctuations in raw plantains and competition from other snack food categories pose some challenges, the overall outlook remains positive.
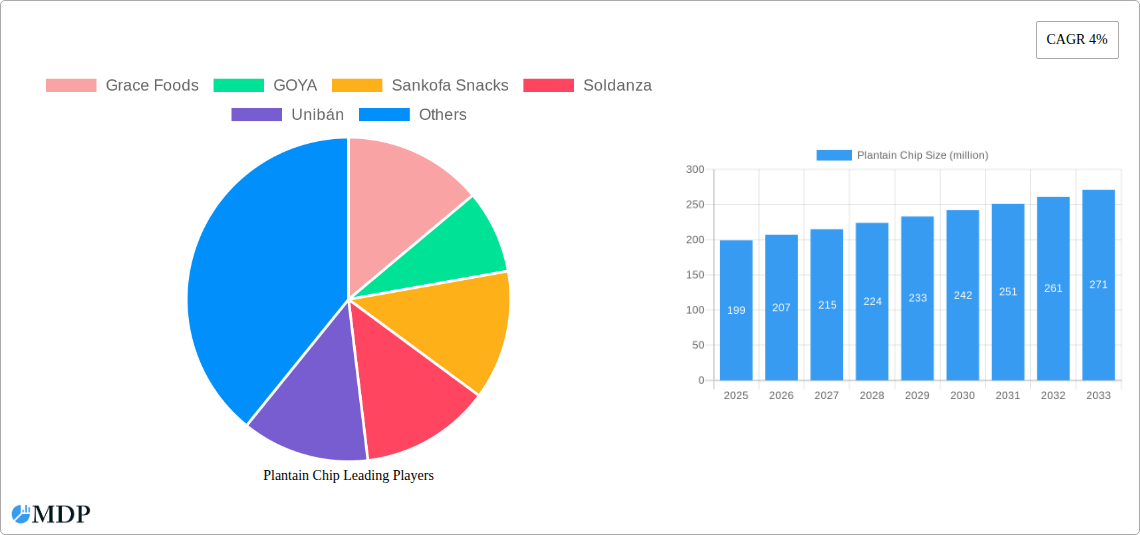
Plantain Chip Market Size (In Million)
The market's compound annual growth rate (CAGR) of 4% indicates a consistent, albeit moderate, growth trajectory over the forecast period (2025-2033). Major players like Grace Foods, GOYA, and others are strategically investing in product diversification, branding, and distribution to maintain their market share. The increasing penetration of plantain chips into various retail channels, including online platforms and specialized ethnic grocery stores, enhances market access and reach. Geographical expansion into untapped markets, particularly in regions with significant plantain production and a growing middle class, offers significant future growth opportunities. However, challenges like maintaining consistent product quality, managing supply chain efficiency, and addressing concerns about sustainability in plantain farming require careful attention for long-term market success.
Plantain Chip Company Market Share
Plantain Chip Market Report: A Comprehensive Analysis (2019-2033)
This comprehensive report provides an in-depth analysis of the global plantain chip market, projecting a market value exceeding $XX million by 2033. The study covers the period 2019-2033, with a base year of 2025 and a forecast period of 2025-2033. This report is essential for industry stakeholders, investors, and businesses seeking to understand the market dynamics, opportunities, and challenges within this rapidly growing snack food segment. We leverage data from the historical period (2019-2024) and provide insights crucial for strategic decision-making.
Plantain Chip Market Dynamics & Concentration
The global plantain chip market exhibits a moderately concentrated structure, with key players like Grace Foods, GOYA, and Sankofa Snacks holding significant market share. However, the market is also witnessing the emergence of smaller, niche players focusing on unique flavors and organic options. Innovation in processing techniques, packaging, and flavor profiles is a key driver. Regulatory frameworks concerning food safety and labeling vary across regions, impacting market dynamics. Plantain chips face competition from other healthy snack options, such as fruit chips and vegetable crisps. Recent years have seen a modest number of M&A activities (XX deals between 2019-2024), mainly involving smaller players consolidating to enhance their market position. The estimated market share for top 3 players in 2025 is approximately XX%.
- Market Concentration: Moderately concentrated, with top 3 players holding approximately XX% market share in 2025.
- Innovation Drivers: New flavors, organic options, and improved processing technologies.
- Regulatory Landscape: Varying food safety and labeling regulations across different regions.
- Product Substitutes: Fruit chips, vegetable crisps, and other healthy snack alternatives.
- M&A Activity: XX deals observed between 2019 and 2024.
Plantain Chip Industry Trends & Analysis
The plantain chip market is experiencing robust growth, driven by rising consumer demand for healthy and convenient snacks. The Compound Annual Growth Rate (CAGR) is projected to be XX% during the forecast period (2025-2033). Increased consumer awareness of the nutritional benefits of plantains, such as their high fiber and potassium content, is a significant factor. Technological advancements in processing and packaging are improving product quality and shelf life. The market penetration of plantain chips is steadily increasing, particularly in developed and emerging markets. Competitive dynamics are intense, with companies focusing on product differentiation, branding, and distribution strategies to gain a market edge.
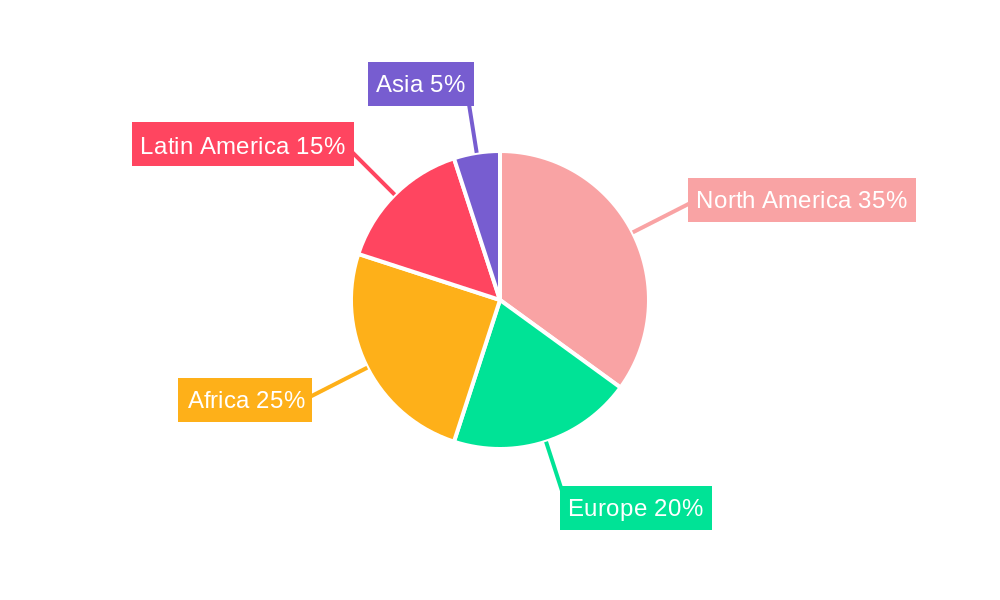
Leading Markets & Segments in Plantain Chip
The North American market currently holds the largest share of the global plantain chip market, driven by high consumer demand and strong distribution networks. Key drivers in this region include strong consumer disposable incomes, established retail infrastructure, and a rising preference for healthier snack options. The strong presence of major brands like GOYA and Grace Foods also contributes to market dominance.
- Key Drivers in North America:
- High consumer disposable income.
- Robust retail infrastructure.
- Growing preference for healthier snack options.
- Established presence of major brands.
- Dominance Analysis: North America's dominance stems from a confluence of strong consumer demand, well-established distribution channels, and the presence of large, established players.
Plantain Chip Product Developments
Recent product innovations focus on enhancing flavor profiles, introducing organic options, and developing more sustainable packaging solutions. Companies are exploring new applications for plantain chips, including their use as ingredients in other food products. Competitive advantages are driven by unique flavor combinations, certifications (organic, gluten-free), and innovative packaging designed to maintain freshness and appeal to environmentally conscious consumers. Technological trends include the use of advanced processing techniques to improve texture and shelf life.
Key Drivers of Plantain Chip Growth
Several factors contribute to the growth of the plantain chip market. Rising consumer preference for healthy and convenient snacking options is a significant driver. Increasing disposable incomes, particularly in developing economies, are fueling market expansion. Moreover, technological advancements in processing and packaging technologies are enhancing product quality and shelf life, further bolstering market growth. Government initiatives promoting healthy eating habits also contribute positively.
Challenges in the Plantain Chip Market
The plantain chip market faces challenges, including fluctuating raw material prices, which can impact production costs. Maintaining consistent product quality can be challenging due to variations in plantain quality. Intense competition among established and emerging brands requires continuous innovation and marketing efforts. The market also faces regulatory hurdles in certain regions concerning food safety and labeling, adding complexity to operations.
Emerging Opportunities in Plantain Chip
The plantain chip market presents substantial long-term growth opportunities. Expanding into new markets, especially in Asia and Africa, holds significant potential. The development of novel flavors, functional ingredients (e.g., added probiotics), and sustainable packaging solutions creates avenues for product differentiation. Strategic partnerships with retailers and food service providers can unlock significant market access opportunities.
Leading Players in the Plantain Chip Sector
- Grace Foods
- GOYA
- Sankofa Snacks
- Soldanza
- Unibán
- TropicMax
- Sunmo
- CHIKA'S
- Ara Food Corporation
- Pacifico Snacks
- Arca Continental
- Olu Olu
- Chifles Chips
- Prime Planet
Key Milestones in Plantain Chip Industry
- 2020: Increased adoption of sustainable packaging solutions by major players.
- 2022: Launch of several new organic plantain chip brands.
- 2023: Significant investment in plantain processing technology by key market participants.
- 2024: Introduction of novel flavors and functional ingredients (e.g., added protein) in plantain chips.
Strategic Outlook for Plantain Chip Market
The plantain chip market is poised for continued growth driven by increasing consumer demand for healthy snacks, innovation in product offerings, and expansion into new markets. Companies focusing on sustainable practices, product differentiation, and strategic partnerships will be well-positioned to capitalize on the market's future potential. Investing in research and development to create new and innovative products will play a key role in maintaining a competitive edge.
Plantain Chip Segmentation
-
1. Application
- 1.1. Online Sale
- 1.2. Offline Sale
-
2. Type
- 2.1. Sweetened
- 2.2. Unsweetened
Plantain Chip Segmentation By Geography
-
1. North America
- 1.1. United States
- 1.2. Canada
- 1.3. Mexico
-
2. South America
- 2.1. Brazil
- 2.2. Argentina
- 2.3. Rest of South America
-
3. Europe
- 3.1. United Kingdom
- 3.2. Germany
- 3.3. France
- 3.4. Italy
- 3.5. Spain
- 3.6. Russia
- 3.7. Benelux
- 3.8. Nordics
- 3.9. Rest of Europe
-
4. Middle East & Africa
- 4.1. Turkey
- 4.2. Israel
- 4.3. GCC
- 4.4. North Africa
- 4.5. South Africa
- 4.6. Rest of Middle East & Africa
-
5. Asia Pacific
- 5.1. China
- 5.2. India
- 5.3. Japan
- 5.4. South Korea
- 5.5. ASEAN
- 5.6. Oceania
- 5.7. Rest of Asia Pacific
Plantain Chip Regional Market Share
Geographic Coverage of Plantain Chip
Plantain Chip REPORT HIGHLIGHTS
| Aspects | Details |
|---|---|
| Study Period | 2020-2034 |
| Base Year | 2025 |
| Estimated Year | 2026 |
| Forecast Period | 2026-2034 |
| Historical Period | 2020-2025 |
| Growth Rate | CAGR of 4% from 2020-2034 |
| Segmentation |
|
Table of Contents
- 1. Introduction
- 1.1. Research Scope
- 1.2. Market Segmentation
- 1.3. Research Objective
- 1.4. Definitions and Assumptions
- 2. Executive Summary
- 2.1. Market Snapshot
- 3. Market Dynamics
- 3.1. Market Drivers
- 3.2. Market Restrains
- 3.3. Market Trends
- 3.4. Market Opportunities
- 4. Market Factor Analysis
- 4.1. Porters Five Forces
- 4.1.1. Bargaining Power of Suppliers
- 4.1.2. Bargaining Power of Buyers
- 4.1.3. Threat of New Entrants
- 4.1.4. Threat of Substitutes
- 4.1.5. Competitive Rivalry
- 4.2. PESTEL analysis
- 4.3. BCG Analysis
- 4.3.1. Stars (High Growth, High Market Share)
- 4.3.2. Cash Cows (Low Growth, High Market Share)
- 4.3.3. Question Mark (High Growth, Low Market Share)
- 4.3.4. Dogs (Low Growth, Low Market Share)
- 4.4. Ansoff Matrix Analysis
- 4.5. Supply Chain Analysis
- 4.6. Regulatory Landscape
- 4.7. Current Market Potential and Opportunity Assessment (TAM–SAM–SOM Framework)
- 4.8. MDP Analyst Note
- 4.1. Porters Five Forces
- 5. Market Analysis, Insights and Forecast 2021-2033
- 5.1. Market Analysis, Insights and Forecast - by Application
- 5.1.1. Online Sale
- 5.1.2. Offline Sale
- 5.2. Market Analysis, Insights and Forecast - by Type
- 5.2.1. Sweetened
- 5.2.2. Unsweetened
- 5.3. Market Analysis, Insights and Forecast - by Region
- 5.3.1. North America
- 5.3.2. South America
- 5.3.3. Europe
- 5.3.4. Middle East & Africa
- 5.3.5. Asia Pacific
- 5.1. Market Analysis, Insights and Forecast - by Application
- 6. Global Plantain Chip Analysis, Insights and Forecast, 2021-2033
- 6.1. Market Analysis, Insights and Forecast - by Application
- 6.1.1. Online Sale
- 6.1.2. Offline Sale
- 6.2. Market Analysis, Insights and Forecast - by Type
- 6.2.1. Sweetened
- 6.2.2. Unsweetened
- 6.1. Market Analysis, Insights and Forecast - by Application
- 7. North America Plantain Chip Analysis, Insights and Forecast, 2020-2032
- 7.1. Market Analysis, Insights and Forecast - by Application
- 7.1.1. Online Sale
- 7.1.2. Offline Sale
- 7.2. Market Analysis, Insights and Forecast - by Type
- 7.2.1. Sweetened
- 7.2.2. Unsweetened
- 7.1. Market Analysis, Insights and Forecast - by Application
- 8. South America Plantain Chip Analysis, Insights and Forecast, 2020-2032
- 8.1. Market Analysis, Insights and Forecast - by Application
- 8.1.1. Online Sale
- 8.1.2. Offline Sale
- 8.2. Market Analysis, Insights and Forecast - by Type
- 8.2.1. Sweetened
- 8.2.2. Unsweetened
- 8.1. Market Analysis, Insights and Forecast - by Application
- 9. Europe Plantain Chip Analysis, Insights and Forecast, 2020-2032
- 9.1. Market Analysis, Insights and Forecast - by Application
- 9.1.1. Online Sale
- 9.1.2. Offline Sale
- 9.2. Market Analysis, Insights and Forecast - by Type
- 9.2.1. Sweetened
- 9.2.2. Unsweetened
- 9.1. Market Analysis, Insights and Forecast - by Application
- 10. Middle East & Africa Plantain Chip Analysis, Insights and Forecast, 2020-2032
- 10.1. Market Analysis, Insights and Forecast - by Application
- 10.1.1. Online Sale
- 10.1.2. Offline Sale
- 10.2. Market Analysis, Insights and Forecast - by Type
- 10.2.1. Sweetened
- 10.2.2. Unsweetened
- 10.1. Market Analysis, Insights and Forecast - by Application
- 11. Asia Pacific Plantain Chip Analysis, Insights and Forecast, 2020-2032
- 11.1. Market Analysis, Insights and Forecast - by Application
- 11.1.1. Online Sale
- 11.1.2. Offline Sale
- 11.2. Market Analysis, Insights and Forecast - by Type
- 11.2.1. Sweetened
- 11.2.2. Unsweetened
- 11.1. Market Analysis, Insights and Forecast - by Application
- 12. Competitive Analysis
- 12.1. Company Profiles
- 12.1.1 Grace Foods
- 12.1.1.1. Company Overview
- 12.1.1.2. Products
- 12.1.1.3. Company Financials
- 12.1.1.4. SWOT Analysis
- 12.1.2 GOYA
- 12.1.2.1. Company Overview
- 12.1.2.2. Products
- 12.1.2.3. Company Financials
- 12.1.2.4. SWOT Analysis
- 12.1.3 Sankofa Snacks
- 12.1.3.1. Company Overview
- 12.1.3.2. Products
- 12.1.3.3. Company Financials
- 12.1.3.4. SWOT Analysis
- 12.1.4 Soldanza
- 12.1.4.1. Company Overview
- 12.1.4.2. Products
- 12.1.4.3. Company Financials
- 12.1.4.4. SWOT Analysis
- 12.1.5 Unibán
- 12.1.5.1. Company Overview
- 12.1.5.2. Products
- 12.1.5.3. Company Financials
- 12.1.5.4. SWOT Analysis
- 12.1.6 TropicMax
- 12.1.6.1. Company Overview
- 12.1.6.2. Products
- 12.1.6.3. Company Financials
- 12.1.6.4. SWOT Analysis
- 12.1.7 Sunmo
- 12.1.7.1. Company Overview
- 12.1.7.2. Products
- 12.1.7.3. Company Financials
- 12.1.7.4. SWOT Analysis
- 12.1.8 CHIKA'S
- 12.1.8.1. Company Overview
- 12.1.8.2. Products
- 12.1.8.3. Company Financials
- 12.1.8.4. SWOT Analysis
- 12.1.9 Ara Food Corporation
- 12.1.9.1. Company Overview
- 12.1.9.2. Products
- 12.1.9.3. Company Financials
- 12.1.9.4. SWOT Analysis
- 12.1.10 Pacifico Snacks
- 12.1.10.1. Company Overview
- 12.1.10.2. Products
- 12.1.10.3. Company Financials
- 12.1.10.4. SWOT Analysis
- 12.1.11 Arca Continental
- 12.1.11.1. Company Overview
- 12.1.11.2. Products
- 12.1.11.3. Company Financials
- 12.1.11.4. SWOT Analysis
- 12.1.12 Olu Olu
- 12.1.12.1. Company Overview
- 12.1.12.2. Products
- 12.1.12.3. Company Financials
- 12.1.12.4. SWOT Analysis
- 12.1.13 Chifles Chips
- 12.1.13.1. Company Overview
- 12.1.13.2. Products
- 12.1.13.3. Company Financials
- 12.1.13.4. SWOT Analysis
- 12.1.14 Prime Planet
- 12.1.14.1. Company Overview
- 12.1.14.2. Products
- 12.1.14.3. Company Financials
- 12.1.14.4. SWOT Analysis
- 12.1.1 Grace Foods
- 12.2. Market Entropy
- 12.2.1 Company's Key Areas Served
- 12.2.2 Recent Developments
- 12.3. Company Market Share Analysis 2025
- 12.3.1 Top 5 Companies Market Share Analysis
- 12.3.2 Top 3 Companies Market Share Analysis
- 12.4. List of Potential Customers
- 13. Research Methodology
List of Figures
- Figure 1: Global Plantain Chip Revenue Breakdown (million, %) by Region 2025 & 2033
- Figure 2: North America Plantain Chip Revenue (million), by Application 2025 & 2033
- Figure 3: North America Plantain Chip Revenue Share (%), by Application 2025 & 2033
- Figure 4: North America Plantain Chip Revenue (million), by Type 2025 & 2033
- Figure 5: North America Plantain Chip Revenue Share (%), by Type 2025 & 2033
- Figure 6: North America Plantain Chip Revenue (million), by Country 2025 & 2033
- Figure 7: North America Plantain Chip Revenue Share (%), by Country 2025 & 2033
- Figure 8: South America Plantain Chip Revenue (million), by Application 2025 & 2033
- Figure 9: South America Plantain Chip Revenue Share (%), by Application 2025 & 2033
- Figure 10: South America Plantain Chip Revenue (million), by Type 2025 & 2033
- Figure 11: South America Plantain Chip Revenue Share (%), by Type 2025 & 2033
- Figure 12: South America Plantain Chip Revenue (million), by Country 2025 & 2033
- Figure 13: South America Plantain Chip Revenue Share (%), by Country 2025 & 2033
- Figure 14: Europe Plantain Chip Revenue (million), by Application 2025 & 2033
- Figure 15: Europe Plantain Chip Revenue Share (%), by Application 2025 & 2033
- Figure 16: Europe Plantain Chip Revenue (million), by Type 2025 & 2033
- Figure 17: Europe Plantain Chip Revenue Share (%), by Type 2025 & 2033
- Figure 18: Europe Plantain Chip Revenue (million), by Country 2025 & 2033
- Figure 19: Europe Plantain Chip Revenue Share (%), by Country 2025 & 2033
- Figure 20: Middle East & Africa Plantain Chip Revenue (million), by Application 2025 & 2033
- Figure 21: Middle East & Africa Plantain Chip Revenue Share (%), by Application 2025 & 2033
- Figure 22: Middle East & Africa Plantain Chip Revenue (million), by Type 2025 & 2033
- Figure 23: Middle East & Africa Plantain Chip Revenue Share (%), by Type 2025 & 2033
- Figure 24: Middle East & Africa Plantain Chip Revenue (million), by Country 2025 & 2033
- Figure 25: Middle East & Africa Plantain Chip Revenue Share (%), by Country 2025 & 2033
- Figure 26: Asia Pacific Plantain Chip Revenue (million), by Application 2025 & 2033
- Figure 27: Asia Pacific Plantain Chip Revenue Share (%), by Application 2025 & 2033
- Figure 28: Asia Pacific Plantain Chip Revenue (million), by Type 2025 & 2033
- Figure 29: Asia Pacific Plantain Chip Revenue Share (%), by Type 2025 & 2033
- Figure 30: Asia Pacific Plantain Chip Revenue (million), by Country 2025 & 2033
- Figure 31: Asia Pacific Plantain Chip Revenue Share (%), by Country 2025 & 2033
List of Tables
- Table 1: Global Plantain Chip Revenue million Forecast, by Application 2020 & 2033
- Table 2: Global Plantain Chip Revenue million Forecast, by Type 2020 & 2033
- Table 3: Global Plantain Chip Revenue million Forecast, by Region 2020 & 2033
- Table 4: Global Plantain Chip Revenue million Forecast, by Application 2020 & 2033
- Table 5: Global Plantain Chip Revenue million Forecast, by Type 2020 & 2033
- Table 6: Global Plantain Chip Revenue million Forecast, by Country 2020 & 2033
- Table 7: United States Plantain Chip Revenue (million) Forecast, by Application 2020 & 2033
- Table 8: Canada Plantain Chip Revenue (million) Forecast, by Application 2020 & 2033
- Table 9: Mexico Plantain Chip Revenue (million) Forecast, by Application 2020 & 2033
- Table 10: Global Plantain Chip Revenue million Forecast, by Application 2020 & 2033
- Table 11: Global Plantain Chip Revenue million Forecast, by Type 2020 & 2033
- Table 12: Global Plantain Chip Revenue million Forecast, by Country 2020 & 2033
- Table 13: Brazil Plantain Chip Revenue (million) Forecast, by Application 2020 & 2033
- Table 14: Argentina Plantain Chip Revenue (million) Forecast, by Application 2020 & 2033
- Table 15: Rest of South America Plantain Chip Revenue (million) Forecast, by Application 2020 & 2033
- Table 16: Global Plantain Chip Revenue million Forecast, by Application 2020 & 2033
- Table 17: Global Plantain Chip Revenue million Forecast, by Type 2020 & 2033
- Table 18: Global Plantain Chip Revenue million Forecast, by Country 2020 & 2033
- Table 19: United Kingdom Plantain Chip Revenue (million) Forecast, by Application 2020 & 2033
- Table 20: Germany Plantain Chip Revenue (million) Forecast, by Application 2020 & 2033
- Table 21: France Plantain Chip Revenue (million) Forecast, by Application 2020 & 2033
- Table 22: Italy Plantain Chip Revenue (million) Forecast, by Application 2020 & 2033
- Table 23: Spain Plantain Chip Revenue (million) Forecast, by Application 2020 & 2033
- Table 24: Russia Plantain Chip Revenue (million) Forecast, by Application 2020 & 2033
- Table 25: Benelux Plantain Chip Revenue (million) Forecast, by Application 2020 & 2033
- Table 26: Nordics Plantain Chip Revenue (million) Forecast, by Application 2020 & 2033
- Table 27: Rest of Europe Plantain Chip Revenue (million) Forecast, by Application 2020 & 2033
- Table 28: Global Plantain Chip Revenue million Forecast, by Application 2020 & 2033
- Table 29: Global Plantain Chip Revenue million Forecast, by Type 2020 & 2033
- Table 30: Global Plantain Chip Revenue million Forecast, by Country 2020 & 2033
- Table 31: Turkey Plantain Chip Revenue (million) Forecast, by Application 2020 & 2033
- Table 32: Israel Plantain Chip Revenue (million) Forecast, by Application 2020 & 2033
- Table 33: GCC Plantain Chip Revenue (million) Forecast, by Application 2020 & 2033
- Table 34: North Africa Plantain Chip Revenue (million) Forecast, by Application 2020 & 2033
- Table 35: South Africa Plantain Chip Revenue (million) Forecast, by Application 2020 & 2033
- Table 36: Rest of Middle East & Africa Plantain Chip Revenue (million) Forecast, by Application 2020 & 2033
- Table 37: Global Plantain Chip Revenue million Forecast, by Application 2020 & 2033
- Table 38: Global Plantain Chip Revenue million Forecast, by Type 2020 & 2033
- Table 39: Global Plantain Chip Revenue million Forecast, by Country 2020 & 2033
- Table 40: China Plantain Chip Revenue (million) Forecast, by Application 2020 & 2033
- Table 41: India Plantain Chip Revenue (million) Forecast, by Application 2020 & 2033
- Table 42: Japan Plantain Chip Revenue (million) Forecast, by Application 2020 & 2033
- Table 43: South Korea Plantain Chip Revenue (million) Forecast, by Application 2020 & 2033
- Table 44: ASEAN Plantain Chip Revenue (million) Forecast, by Application 2020 & 2033
- Table 45: Oceania Plantain Chip Revenue (million) Forecast, by Application 2020 & 2033
- Table 46: Rest of Asia Pacific Plantain Chip Revenue (million) Forecast, by Application 2020 & 2033
Frequently Asked Questions
1. What is the projected Compound Annual Growth Rate (CAGR) of the Plantain Chip?
The projected CAGR is approximately 4%.
2. Which companies are prominent players in the Plantain Chip?
Key companies in the market include Grace Foods, GOYA, Sankofa Snacks, Soldanza, Unibán, TropicMax, Sunmo, CHIKA'S, Ara Food Corporation, Pacifico Snacks, Arca Continental, Olu Olu, Chifles Chips, Prime Planet.
3. What are the main segments of the Plantain Chip?
The market segments include Application, Type.
4. Can you provide details about the market size?
The market size is estimated to be USD 199 million as of 2022.
5. What are some drivers contributing to market growth?
N/A
6. What are the notable trends driving market growth?
N/A
7. Are there any restraints impacting market growth?
N/A
8. Can you provide examples of recent developments in the market?
N/A
9. What pricing options are available for accessing the report?
Pricing options include single-user, multi-user, and enterprise licenses priced at USD 2900.00, USD 4350.00, and USD 5800.00 respectively.
10. Is the market size provided in terms of value or volume?
The market size is provided in terms of value, measured in million.
11. Are there any specific market keywords associated with the report?
Yes, the market keyword associated with the report is "Plantain Chip," which aids in identifying and referencing the specific market segment covered.
12. How do I determine which pricing option suits my needs best?
The pricing options vary based on user requirements and access needs. Individual users may opt for single-user licenses, while businesses requiring broader access may choose multi-user or enterprise licenses for cost-effective access to the report.
13. Are there any additional resources or data provided in the Plantain Chip report?
While the report offers comprehensive insights, it's advisable to review the specific contents or supplementary materials provided to ascertain if additional resources or data are available.
14. How can I stay updated on further developments or reports in the Plantain Chip?
To stay informed about further developments, trends, and reports in the Plantain Chip, consider subscribing to industry newsletters, following relevant companies and organizations, or regularly checking reputable industry news sources and publications.
Methodology
Step 1 - Identification of Relevant Samples Size from Population Database


Step 2 - Approaches for Defining Global Market Size (Value, Volume* & Price*)

Note*: In applicable scenarios
Step 3 - Data Sources
Primary Research
- Web Analytics
- Survey Reports
- Research Institute
- Latest Research Reports
- Opinion Leaders
Secondary Research
- Annual Reports
- White Paper
- Latest Press Release
- Industry Association
- Paid Database
- Investor Presentations

Step 4 - Data Triangulation
Involves using different sources of information in order to increase the validity of a study
These sources are likely to be stakeholders in a program - participants, other researchers, program staff, other community members, and so on.
Then we put all data in single framework & apply various statistical tools to find out the dynamic on the market.
During the analysis stage, feedback from the stakeholder groups would be compared to determine areas of agreement as well as areas of divergence