

Key Insights
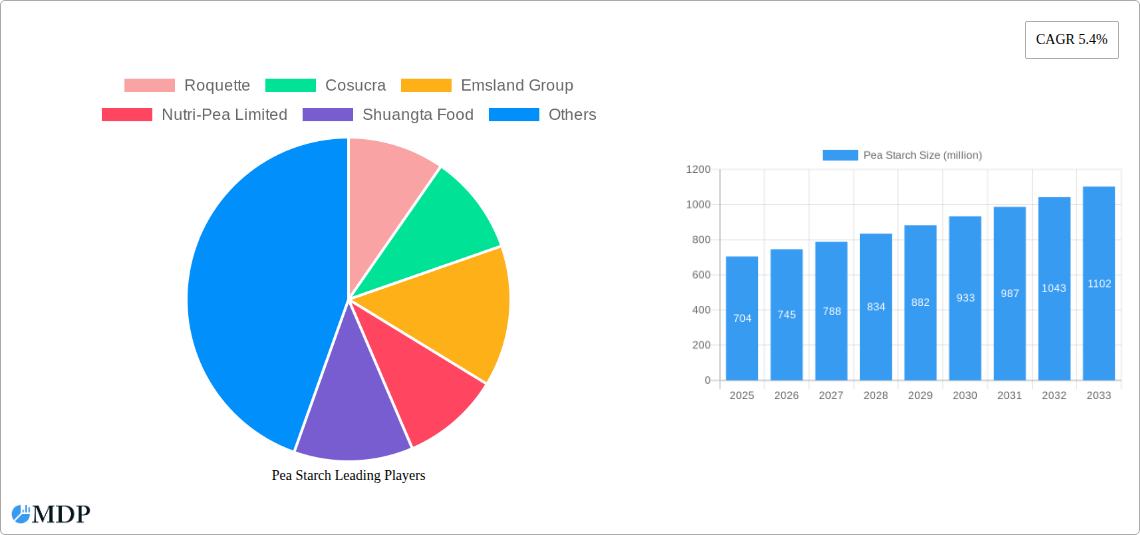
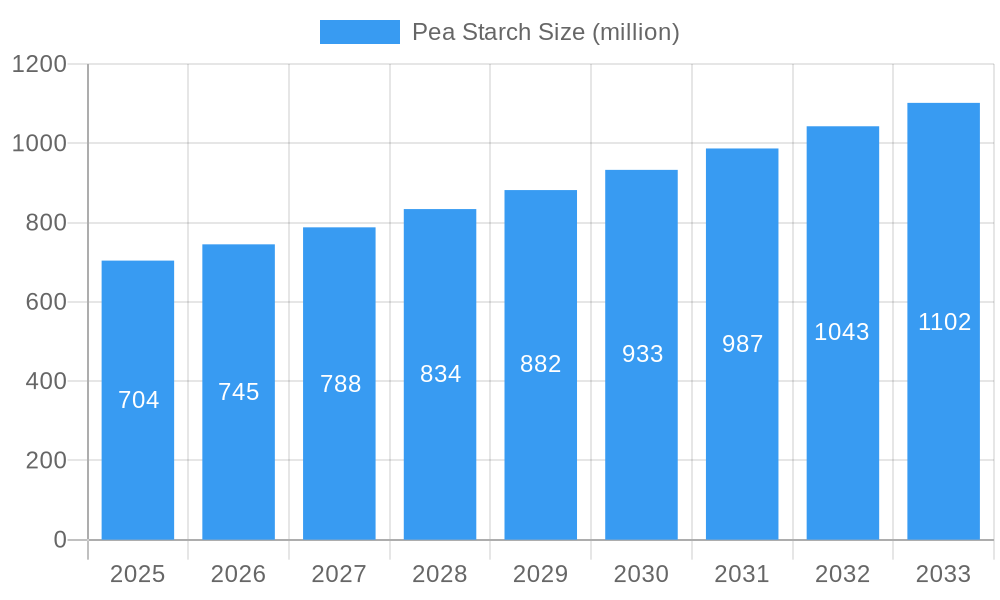
The global pea starch market, valued at $704 million in 2025, is projected to experience robust growth, driven by increasing consumer demand for plant-based and gluten-free food products. This surge in demand is fueled by growing health consciousness and the rising prevalence of dietary restrictions. Pea starch, a versatile ingredient with excellent functional properties, is increasingly favored by food manufacturers as a substitute for traditional starches in various applications, including bakery products, sauces, and confectionery. The market's expansion is also supported by technological advancements in pea starch production, leading to improved quality and efficiency. Key players like Roquette, Cosucra, and Emsland Group are actively investing in research and development to enhance pea starch functionalities and expand their product portfolios, thereby further fueling market growth. While potential supply chain constraints and price volatility related to pea production could pose challenges, the overall market outlook remains positive, with a projected Compound Annual Growth Rate (CAGR) of 5.4% from 2025 to 2033.
Pea Starch Market Size (In Million)
The competitive landscape is characterized by a mix of large multinational companies and regional players. Larger companies benefit from economies of scale and established distribution networks, while smaller, regional players may focus on niche applications or specialized pea starch varieties. Future growth will likely be driven by innovation in pea starch applications, particularly in areas such as meat alternatives, pet food, and pharmaceuticals. The market will also see continued geographic expansion, particularly in Asia-Pacific and Latin America, where rising incomes and changing dietary preferences are creating new opportunities. Sustained focus on sustainable sourcing and production methods will become increasingly important for maintaining market competitiveness and addressing environmental concerns.
Pea Starch Company Market Share
Pea Starch Market Report: A Comprehensive Analysis (2019-2033)
This comprehensive report provides a detailed analysis of the global pea starch market, offering invaluable insights for industry stakeholders, investors, and strategic decision-makers. The study period covers 2019-2033, with a focus on the estimated year 2025 and a forecast period of 2025-2033. The report leverages extensive market research, incorporating data from the historical period (2019-2024) to provide a robust and reliable prediction of future market trends. Expect to uncover key growth drivers, challenges, and emerging opportunities within the multi-million dollar pea starch industry. This report is designed for immediate use and requires no further modification.
Pea Starch Market Dynamics & Concentration
The global pea starch market, valued at xx million in 2025, is experiencing significant growth driven by increasing consumer demand for plant-based alternatives and the rising popularity of pea protein in various food and non-food applications. Market concentration is moderate, with several key players holding substantial market shares. Roquette, Cosucra, and Emsland Group are prominent players, collectively accounting for an estimated xx% of the market share in 2025. Smaller players like Nutri-Pea Limited, Shuangta Food, Yantai Oriental Protein Tech, Shandong Jianyuan Foods, Shandong Huatai Food, and Shandong Jindu Talin Foods contribute to the remaining market share.
- Market Concentration: Moderate, with top 3 players holding xx% market share in 2025.
- Innovation Drivers: Growing demand for clean-label ingredients, functional food applications, and sustainable alternatives to traditional starches.
- Regulatory Frameworks: Stringent food safety regulations and labeling requirements influence market dynamics.
- Product Substitutes: Corn starch, potato starch, and tapioca starch remain competitive substitutes. However, pea starch is gaining traction due to its functional and nutritional properties.
- End-User Trends: Increasing adoption of pea starch in food, feed, and industrial applications fuels market growth.
- M&A Activities: The number of M&A deals in the pea starch sector has been relatively stable in recent years, with xx deals recorded between 2019 and 2024.
Pea Starch Industry Trends & Analysis
The pea starch market is projected to witness a CAGR of xx% during the forecast period (2025-2033), driven by several key factors. The growing consumer awareness of health and sustainability is a major catalyst. Pea starch, being a plant-based and gluten-free ingredient, aligns perfectly with this trend. Technological advancements in pea starch extraction and processing are further enhancing its functionality and cost-effectiveness, leading to increased market penetration in various segments. The competitive landscape is characterized by both large multinational corporations and smaller specialized companies, resulting in a dynamic and innovative market. Consumer preferences are shifting towards clean-label and natural ingredients, creating a significant opportunity for pea starch.
Leading Markets & Segments in Pea Starch
While the global market shows strong growth potential, specific regions and segments exhibit higher dominance. Currently, Europe holds the largest market share, driven by robust demand from the food and beverage industry and the presence of established pea starch producers like Roquette and Cosucra. North America also presents a significant market with high growth potential due to increasing consumer demand for plant-based products and supportive regulatory environments. Asia-Pacific is expected to experience the fastest growth rate in the coming years, fueled by rising disposable incomes, expanding food processing industries, and increasing awareness of health and nutrition.
- Key Drivers in Europe: Strong existing food industry infrastructure, established supply chains, and high consumer demand for plant-based products.
- Key Drivers in North America: High consumer preference for health and functional foods, supportive regulatory frameworks, and growing investment in plant-based food technology.
- Key Drivers in Asia-Pacific: Rising disposable incomes, expanding food processing industry, and increased awareness about health and nutrition benefits.
Pea Starch Product Developments
Recent advancements in pea starch processing have resulted in improved functionalities, such as enhanced viscosity, clarity, and freeze-thaw stability. These advancements have opened up new applications in various industries, including food, feed, and pharmaceuticals. Companies are focusing on developing tailored pea starch solutions that meet specific requirements of different industries. The development of modified pea starch with improved properties adds to its versatility and competitiveness against traditional starches.
Key Drivers of Pea Starch Growth
Several factors fuel the growth of the pea starch market. These include the increasing demand for plant-based alternatives to traditional starches, driven by consumer preference for healthier and sustainable food options. Technological advancements in pea starch processing enhance its functional properties and cost-effectiveness, making it more attractive to diverse industries. Favorable government policies promoting sustainable agriculture and plant-based food production further contribute to market growth.
Challenges in the Pea Starch Market
Despite the promising outlook, the pea starch market faces challenges. Fluctuations in raw material prices (peas) and potential supply chain disruptions can impact profitability. The relatively high cost of pea starch compared to some traditional starches can limit its widespread adoption in certain applications. Competition from other plant-based starches and traditional alternatives also puts pressure on market share.
Emerging Opportunities in Pea Starch
The long-term growth of the pea starch market is propelled by several opportunities. Technological advancements continue to improve the functionalities and applications of pea starch. Strategic partnerships between pea starch producers and food manufacturers facilitate wider market penetration. Expanding into new geographical markets with high growth potential and exploring niche applications in diverse industries represent key avenues for future expansion.
Leading Players in the Pea Starch Sector
- Roquette
- Cosucra
- Emsland Group
- Nutri-Pea Limited
- Shuangta Food
- Yantai Oriental Protein Tech
- Shandong Jianyuan Foods
- Shandong Huatai Food
- Shandong Jindu Talin Foods
Key Milestones in Pea Starch Industry
- 2020: Several key players invested heavily in expanding their pea starch production facilities.
- 2022: New product launches with enhanced functionality.
- 2023: Significant research and development investments in improving pea starch extraction methods.
- 2024: Several strategic partnerships formed to expand market reach.
Strategic Outlook for Pea Starch Market
The pea starch market presents significant growth potential, driven by increasing consumer demand for plant-based and sustainable ingredients. Strategic investments in research and development, expanding production capacities, and exploring new market applications will be crucial for success. Companies focused on innovation and strategic partnerships are poised to capture significant market share in the years to come.
Pea Starch Segmentation
-
1. Application
- 1.1. Asian Pastas
- 1.2. Snack
- 1.3. Meats Processing
- 1.4. Industrial Applications
- 1.5. Others
-
2. Type
- 2.1. Food Grade
- 2.2. Industry Grade
Pea Starch Segmentation By Geography
-
1. North America
- 1.1. United States
- 1.2. Canada
- 1.3. Mexico
-
2. South America
- 2.1. Brazil
- 2.2. Argentina
- 2.3. Rest of South America
-
3. Europe
- 3.1. United Kingdom
- 3.2. Germany
- 3.3. France
- 3.4. Italy
- 3.5. Spain
- 3.6. Russia
- 3.7. Benelux
- 3.8. Nordics
- 3.9. Rest of Europe
-
4. Middle East & Africa
- 4.1. Turkey
- 4.2. Israel
- 4.3. GCC
- 4.4. North Africa
- 4.5. South Africa
- 4.6. Rest of Middle East & Africa
-
5. Asia Pacific
- 5.1. China
- 5.2. India
- 5.3. Japan
- 5.4. South Korea
- 5.5. ASEAN
- 5.6. Oceania
- 5.7. Rest of Asia Pacific
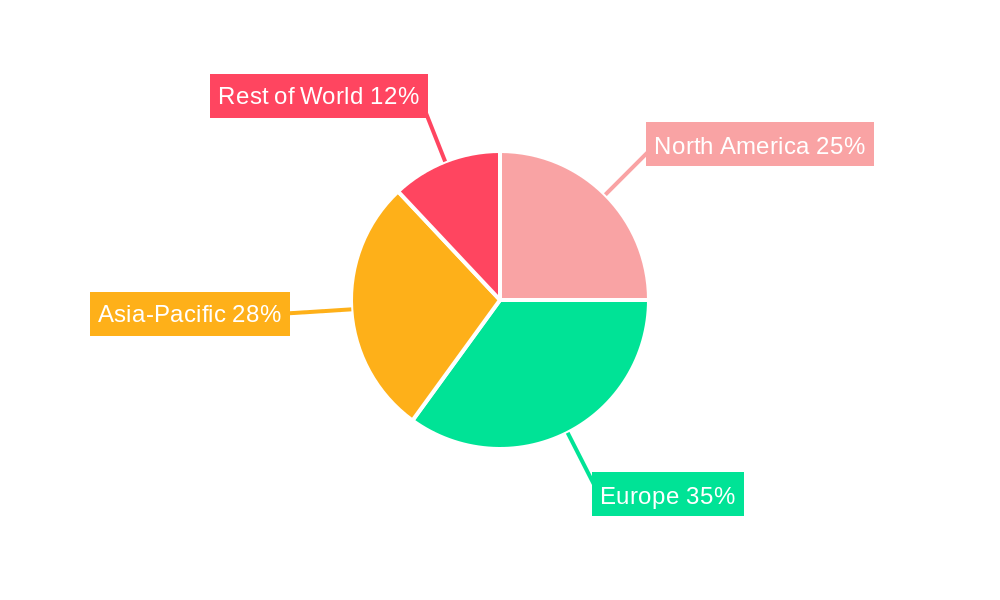
Pea Starch Regional Market Share
Geographic Coverage of Pea Starch
Pea Starch REPORT HIGHLIGHTS
| Aspects | Details |
|---|---|
| Study Period | 2020-2034 |
| Base Year | 2025 |
| Estimated Year | 2026 |
| Forecast Period | 2026-2034 |
| Historical Period | 2020-2025 |
| Growth Rate | CAGR of 9.54% from 2020-2034 |
| Segmentation |
|
Table of Contents
- 1. Introduction
- 1.1. Research Scope
- 1.2. Market Segmentation
- 1.3. Research Objective
- 1.4. Definitions and Assumptions
- 2. Executive Summary
- 2.1. Market Snapshot
- 3. Market Dynamics
- 3.1. Market Drivers
- 3.2. Market Restrains
- 3.3. Market Trends
- 3.4. Market Opportunities
- 4. Market Factor Analysis
- 4.1. Porters Five Forces
- 4.1.1. Bargaining Power of Suppliers
- 4.1.2. Bargaining Power of Buyers
- 4.1.3. Threat of New Entrants
- 4.1.4. Threat of Substitutes
- 4.1.5. Competitive Rivalry
- 4.2. PESTEL analysis
- 4.3. BCG Analysis
- 4.3.1. Stars (High Growth, High Market Share)
- 4.3.2. Cash Cows (Low Growth, High Market Share)
- 4.3.3. Question Mark (High Growth, Low Market Share)
- 4.3.4. Dogs (Low Growth, Low Market Share)
- 4.4. Ansoff Matrix Analysis
- 4.5. Supply Chain Analysis
- 4.6. Regulatory Landscape
- 4.7. Current Market Potential and Opportunity Assessment (TAM–SAM–SOM Framework)
- 4.8. MDP Analyst Note
- 4.1. Porters Five Forces
- 5. Market Analysis, Insights and Forecast 2021-2033
- 5.1. Market Analysis, Insights and Forecast - by Application
- 5.1.1. Asian Pastas
- 5.1.2. Snack
- 5.1.3. Meats Processing
- 5.1.4. Industrial Applications
- 5.1.5. Others
- 5.2. Market Analysis, Insights and Forecast - by Type
- 5.2.1. Food Grade
- 5.2.2. Industry Grade
- 5.3. Market Analysis, Insights and Forecast - by Region
- 5.3.1. North America
- 5.3.2. South America
- 5.3.3. Europe
- 5.3.4. Middle East & Africa
- 5.3.5. Asia Pacific
- 5.1. Market Analysis, Insights and Forecast - by Application
- 6. Global Pea Starch Analysis, Insights and Forecast, 2021-2033
- 6.1. Market Analysis, Insights and Forecast - by Application
- 6.1.1. Asian Pastas
- 6.1.2. Snack
- 6.1.3. Meats Processing
- 6.1.4. Industrial Applications
- 6.1.5. Others
- 6.2. Market Analysis, Insights and Forecast - by Type
- 6.2.1. Food Grade
- 6.2.2. Industry Grade
- 6.1. Market Analysis, Insights and Forecast - by Application
- 7. North America Pea Starch Analysis, Insights and Forecast, 2020-2032
- 7.1. Market Analysis, Insights and Forecast - by Application
- 7.1.1. Asian Pastas
- 7.1.2. Snack
- 7.1.3. Meats Processing
- 7.1.4. Industrial Applications
- 7.1.5. Others
- 7.2. Market Analysis, Insights and Forecast - by Type
- 7.2.1. Food Grade
- 7.2.2. Industry Grade
- 7.1. Market Analysis, Insights and Forecast - by Application
- 8. South America Pea Starch Analysis, Insights and Forecast, 2020-2032
- 8.1. Market Analysis, Insights and Forecast - by Application
- 8.1.1. Asian Pastas
- 8.1.2. Snack
- 8.1.3. Meats Processing
- 8.1.4. Industrial Applications
- 8.1.5. Others
- 8.2. Market Analysis, Insights and Forecast - by Type
- 8.2.1. Food Grade
- 8.2.2. Industry Grade
- 8.1. Market Analysis, Insights and Forecast - by Application
- 9. Europe Pea Starch Analysis, Insights and Forecast, 2020-2032
- 9.1. Market Analysis, Insights and Forecast - by Application
- 9.1.1. Asian Pastas
- 9.1.2. Snack
- 9.1.3. Meats Processing
- 9.1.4. Industrial Applications
- 9.1.5. Others
- 9.2. Market Analysis, Insights and Forecast - by Type
- 9.2.1. Food Grade
- 9.2.2. Industry Grade
- 9.1. Market Analysis, Insights and Forecast - by Application
- 10. Middle East & Africa Pea Starch Analysis, Insights and Forecast, 2020-2032
- 10.1. Market Analysis, Insights and Forecast - by Application
- 10.1.1. Asian Pastas
- 10.1.2. Snack
- 10.1.3. Meats Processing
- 10.1.4. Industrial Applications
- 10.1.5. Others
- 10.2. Market Analysis, Insights and Forecast - by Type
- 10.2.1. Food Grade
- 10.2.2. Industry Grade
- 10.1. Market Analysis, Insights and Forecast - by Application
- 11. Asia Pacific Pea Starch Analysis, Insights and Forecast, 2020-2032
- 11.1. Market Analysis, Insights and Forecast - by Application
- 11.1.1. Asian Pastas
- 11.1.2. Snack
- 11.1.3. Meats Processing
- 11.1.4. Industrial Applications
- 11.1.5. Others
- 11.2. Market Analysis, Insights and Forecast - by Type
- 11.2.1. Food Grade
- 11.2.2. Industry Grade
- 11.1. Market Analysis, Insights and Forecast - by Application
- 12. Competitive Analysis
- 12.1. Company Profiles
- 12.1.1 Roquette
- 12.1.1.1. Company Overview
- 12.1.1.2. Products
- 12.1.1.3. Company Financials
- 12.1.1.4. SWOT Analysis
- 12.1.2 Cosucra
- 12.1.2.1. Company Overview
- 12.1.2.2. Products
- 12.1.2.3. Company Financials
- 12.1.2.4. SWOT Analysis
- 12.1.3 Emsland Group
- 12.1.3.1. Company Overview
- 12.1.3.2. Products
- 12.1.3.3. Company Financials
- 12.1.3.4. SWOT Analysis
- 12.1.4 Nutri-Pea Limited
- 12.1.4.1. Company Overview
- 12.1.4.2. Products
- 12.1.4.3. Company Financials
- 12.1.4.4. SWOT Analysis
- 12.1.5 Shuangta Food
- 12.1.5.1. Company Overview
- 12.1.5.2. Products
- 12.1.5.3. Company Financials
- 12.1.5.4. SWOT Analysis
- 12.1.6 Yantai Oriental Protein Tech
- 12.1.6.1. Company Overview
- 12.1.6.2. Products
- 12.1.6.3. Company Financials
- 12.1.6.4. SWOT Analysis
- 12.1.7 Shandong Jianyuan Foods
- 12.1.7.1. Company Overview
- 12.1.7.2. Products
- 12.1.7.3. Company Financials
- 12.1.7.4. SWOT Analysis
- 12.1.8 Shandong Huatai Food
- 12.1.8.1. Company Overview
- 12.1.8.2. Products
- 12.1.8.3. Company Financials
- 12.1.8.4. SWOT Analysis
- 12.1.9 Shandong Jindu Talin Foods
- 12.1.9.1. Company Overview
- 12.1.9.2. Products
- 12.1.9.3. Company Financials
- 12.1.9.4. SWOT Analysis
- 12.1.1 Roquette
- 12.2. Market Entropy
- 12.2.1 Company's Key Areas Served
- 12.2.2 Recent Developments
- 12.3. Company Market Share Analysis 2025
- 12.3.1 Top 5 Companies Market Share Analysis
- 12.3.2 Top 3 Companies Market Share Analysis
- 12.4. List of Potential Customers
- 13. Research Methodology
List of Figures
- Figure 1: Global Pea Starch Revenue Breakdown (undefined, %) by Region 2025 & 2033
- Figure 2: North America Pea Starch Revenue (undefined), by Application 2025 & 2033
- Figure 3: North America Pea Starch Revenue Share (%), by Application 2025 & 2033
- Figure 4: North America Pea Starch Revenue (undefined), by Type 2025 & 2033
- Figure 5: North America Pea Starch Revenue Share (%), by Type 2025 & 2033
- Figure 6: North America Pea Starch Revenue (undefined), by Country 2025 & 2033
- Figure 7: North America Pea Starch Revenue Share (%), by Country 2025 & 2033
- Figure 8: South America Pea Starch Revenue (undefined), by Application 2025 & 2033
- Figure 9: South America Pea Starch Revenue Share (%), by Application 2025 & 2033
- Figure 10: South America Pea Starch Revenue (undefined), by Type 2025 & 2033
- Figure 11: South America Pea Starch Revenue Share (%), by Type 2025 & 2033
- Figure 12: South America Pea Starch Revenue (undefined), by Country 2025 & 2033
- Figure 13: South America Pea Starch Revenue Share (%), by Country 2025 & 2033
- Figure 14: Europe Pea Starch Revenue (undefined), by Application 2025 & 2033
- Figure 15: Europe Pea Starch Revenue Share (%), by Application 2025 & 2033
- Figure 16: Europe Pea Starch Revenue (undefined), by Type 2025 & 2033
- Figure 17: Europe Pea Starch Revenue Share (%), by Type 2025 & 2033
- Figure 18: Europe Pea Starch Revenue (undefined), by Country 2025 & 2033
- Figure 19: Europe Pea Starch Revenue Share (%), by Country 2025 & 2033
- Figure 20: Middle East & Africa Pea Starch Revenue (undefined), by Application 2025 & 2033
- Figure 21: Middle East & Africa Pea Starch Revenue Share (%), by Application 2025 & 2033
- Figure 22: Middle East & Africa Pea Starch Revenue (undefined), by Type 2025 & 2033
- Figure 23: Middle East & Africa Pea Starch Revenue Share (%), by Type 2025 & 2033
- Figure 24: Middle East & Africa Pea Starch Revenue (undefined), by Country 2025 & 2033
- Figure 25: Middle East & Africa Pea Starch Revenue Share (%), by Country 2025 & 2033
- Figure 26: Asia Pacific Pea Starch Revenue (undefined), by Application 2025 & 2033
- Figure 27: Asia Pacific Pea Starch Revenue Share (%), by Application 2025 & 2033
- Figure 28: Asia Pacific Pea Starch Revenue (undefined), by Type 2025 & 2033
- Figure 29: Asia Pacific Pea Starch Revenue Share (%), by Type 2025 & 2033
- Figure 30: Asia Pacific Pea Starch Revenue (undefined), by Country 2025 & 2033
- Figure 31: Asia Pacific Pea Starch Revenue Share (%), by Country 2025 & 2033
List of Tables
- Table 1: Global Pea Starch Revenue undefined Forecast, by Application 2020 & 2033
- Table 2: Global Pea Starch Revenue undefined Forecast, by Type 2020 & 2033
- Table 3: Global Pea Starch Revenue undefined Forecast, by Region 2020 & 2033
- Table 4: Global Pea Starch Revenue undefined Forecast, by Application 2020 & 2033
- Table 5: Global Pea Starch Revenue undefined Forecast, by Type 2020 & 2033
- Table 6: Global Pea Starch Revenue undefined Forecast, by Country 2020 & 2033
- Table 7: United States Pea Starch Revenue (undefined) Forecast, by Application 2020 & 2033
- Table 8: Canada Pea Starch Revenue (undefined) Forecast, by Application 2020 & 2033
- Table 9: Mexico Pea Starch Revenue (undefined) Forecast, by Application 2020 & 2033
- Table 10: Global Pea Starch Revenue undefined Forecast, by Application 2020 & 2033
- Table 11: Global Pea Starch Revenue undefined Forecast, by Type 2020 & 2033
- Table 12: Global Pea Starch Revenue undefined Forecast, by Country 2020 & 2033
- Table 13: Brazil Pea Starch Revenue (undefined) Forecast, by Application 2020 & 2033
- Table 14: Argentina Pea Starch Revenue (undefined) Forecast, by Application 2020 & 2033
- Table 15: Rest of South America Pea Starch Revenue (undefined) Forecast, by Application 2020 & 2033
- Table 16: Global Pea Starch Revenue undefined Forecast, by Application 2020 & 2033
- Table 17: Global Pea Starch Revenue undefined Forecast, by Type 2020 & 2033
- Table 18: Global Pea Starch Revenue undefined Forecast, by Country 2020 & 2033
- Table 19: United Kingdom Pea Starch Revenue (undefined) Forecast, by Application 2020 & 2033
- Table 20: Germany Pea Starch Revenue (undefined) Forecast, by Application 2020 & 2033
- Table 21: France Pea Starch Revenue (undefined) Forecast, by Application 2020 & 2033
- Table 22: Italy Pea Starch Revenue (undefined) Forecast, by Application 2020 & 2033
- Table 23: Spain Pea Starch Revenue (undefined) Forecast, by Application 2020 & 2033
- Table 24: Russia Pea Starch Revenue (undefined) Forecast, by Application 2020 & 2033
- Table 25: Benelux Pea Starch Revenue (undefined) Forecast, by Application 2020 & 2033
- Table 26: Nordics Pea Starch Revenue (undefined) Forecast, by Application 2020 & 2033
- Table 27: Rest of Europe Pea Starch Revenue (undefined) Forecast, by Application 2020 & 2033
- Table 28: Global Pea Starch Revenue undefined Forecast, by Application 2020 & 2033
- Table 29: Global Pea Starch Revenue undefined Forecast, by Type 2020 & 2033
- Table 30: Global Pea Starch Revenue undefined Forecast, by Country 2020 & 2033
- Table 31: Turkey Pea Starch Revenue (undefined) Forecast, by Application 2020 & 2033
- Table 32: Israel Pea Starch Revenue (undefined) Forecast, by Application 2020 & 2033
- Table 33: GCC Pea Starch Revenue (undefined) Forecast, by Application 2020 & 2033
- Table 34: North Africa Pea Starch Revenue (undefined) Forecast, by Application 2020 & 2033
- Table 35: South Africa Pea Starch Revenue (undefined) Forecast, by Application 2020 & 2033
- Table 36: Rest of Middle East & Africa Pea Starch Revenue (undefined) Forecast, by Application 2020 & 2033
- Table 37: Global Pea Starch Revenue undefined Forecast, by Application 2020 & 2033
- Table 38: Global Pea Starch Revenue undefined Forecast, by Type 2020 & 2033
- Table 39: Global Pea Starch Revenue undefined Forecast, by Country 2020 & 2033
- Table 40: China Pea Starch Revenue (undefined) Forecast, by Application 2020 & 2033
- Table 41: India Pea Starch Revenue (undefined) Forecast, by Application 2020 & 2033
- Table 42: Japan Pea Starch Revenue (undefined) Forecast, by Application 2020 & 2033
- Table 43: South Korea Pea Starch Revenue (undefined) Forecast, by Application 2020 & 2033
- Table 44: ASEAN Pea Starch Revenue (undefined) Forecast, by Application 2020 & 2033
- Table 45: Oceania Pea Starch Revenue (undefined) Forecast, by Application 2020 & 2033
- Table 46: Rest of Asia Pacific Pea Starch Revenue (undefined) Forecast, by Application 2020 & 2033
Frequently Asked Questions
1. What is the projected Compound Annual Growth Rate (CAGR) of the Pea Starch?
The projected CAGR is approximately 9.54%.
2. Which companies are prominent players in the Pea Starch?
Key companies in the market include Roquette, Cosucra, Emsland Group, Nutri-Pea Limited, Shuangta Food, Yantai Oriental Protein Tech, Shandong Jianyuan Foods, Shandong Huatai Food, Shandong Jindu Talin Foods.
3. What are the main segments of the Pea Starch?
The market segments include Application, Type.
4. Can you provide details about the market size?
The market size is estimated to be USD XXX N/A as of 2022.
5. What are some drivers contributing to market growth?
N/A
6. What are the notable trends driving market growth?
N/A
7. Are there any restraints impacting market growth?
N/A
8. Can you provide examples of recent developments in the market?
N/A
9. What pricing options are available for accessing the report?
Pricing options include single-user, multi-user, and enterprise licenses priced at USD 4250.00, USD 6375.00, and USD 8500.00 respectively.
10. Is the market size provided in terms of value or volume?
The market size is provided in terms of value, measured in N/A.
11. Are there any specific market keywords associated with the report?
Yes, the market keyword associated with the report is "Pea Starch," which aids in identifying and referencing the specific market segment covered.
12. How do I determine which pricing option suits my needs best?
The pricing options vary based on user requirements and access needs. Individual users may opt for single-user licenses, while businesses requiring broader access may choose multi-user or enterprise licenses for cost-effective access to the report.
13. Are there any additional resources or data provided in the Pea Starch report?
While the report offers comprehensive insights, it's advisable to review the specific contents or supplementary materials provided to ascertain if additional resources or data are available.
14. How can I stay updated on further developments or reports in the Pea Starch?
To stay informed about further developments, trends, and reports in the Pea Starch, consider subscribing to industry newsletters, following relevant companies and organizations, or regularly checking reputable industry news sources and publications.
Methodology
Step 1 - Identification of Relevant Samples Size from Population Database


Step 2 - Approaches for Defining Global Market Size (Value, Volume* & Price*)

Note*: In applicable scenarios
Step 3 - Data Sources
Primary Research
- Web Analytics
- Survey Reports
- Research Institute
- Latest Research Reports
- Opinion Leaders
Secondary Research
- Annual Reports
- White Paper
- Latest Press Release
- Industry Association
- Paid Database
- Investor Presentations

Step 4 - Data Triangulation
Involves using different sources of information in order to increase the validity of a study
These sources are likely to be stakeholders in a program - participants, other researchers, program staff, other community members, and so on.
Then we put all data in single framework & apply various statistical tools to find out the dynamic on the market.
During the analysis stage, feedback from the stakeholder groups would be compared to determine areas of agreement as well as areas of divergence