

Key Insights
The global pea protein market, valued at $3.3 billion in the base year 2025, is poised for significant expansion. Projections indicate a Compound Annual Growth Rate (CAGR) of 11.84%, driving substantial market development. This growth trajectory is underpinned by escalating consumer preference for plant-based protein alternatives, propelled by heightened health consciousness and a growing emphasis on sustainability. Increased awareness of the environmental footprint associated with animal agriculture further bolsters the adoption of pea protein as an eco-friendly substitute. The inherent versatility of pea protein, enabling its seamless integration into a broad spectrum of food and beverage applications—including meat alternatives, protein supplements, dairy-free products, and baked goods—is a key driver of market penetration. Moreover, ongoing advancements in pea protein extraction and processing technologies are enhancing its functional properties and overall quality, contributing to its market ascendancy. Leading industry participants are actively investing in research and development and expanding manufacturing capabilities to address the surging global demand.
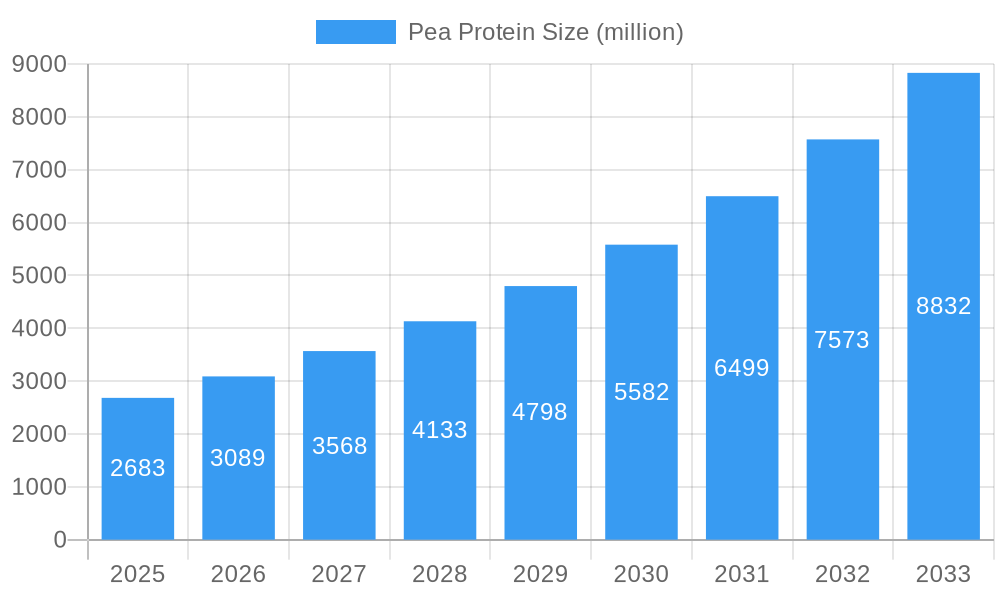
Pea Protein Market Size (In Billion)
The competitive landscape within the pea protein sector is expected to become more dynamic with the entry of new players, attracted by its considerable growth potential. Nevertheless, certain challenges persist. Volatility in the pricing of raw materials, specifically peas, can affect profitability. Maintaining consistent product quality and addressing specific taste and texture considerations in certain applications remain critical areas for ongoing innovation. Variations in regional consumer preferences and diverse regulatory frameworks introduce complexities for companies aiming for international market expansion. Notwithstanding these obstacles, the long-term outlook for the pea protein market is exceptionally robust, fueled by the synergistic forces of sustained consumer demand, technological innovation, and escalating industry investments. The market is anticipated to witness considerable growth across various regions as awareness of plant-based dietary options gains momentum worldwide.
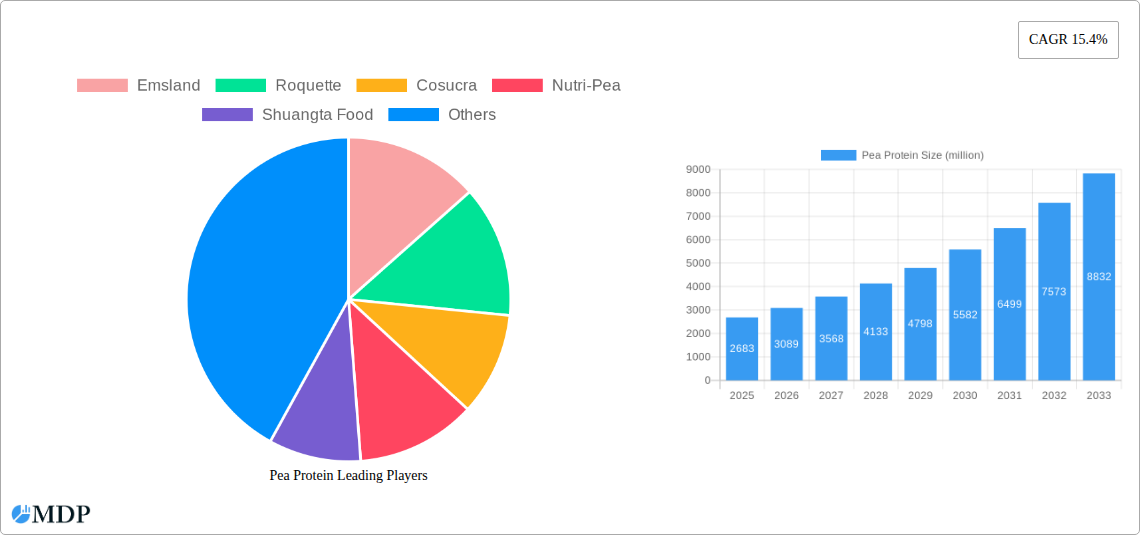
Pea Protein Company Market Share
Pea Protein Market Report: A Comprehensive Analysis (2019-2033)
This comprehensive report delivers an in-depth analysis of the global pea protein market, projecting a market value exceeding $XX billion by 2033. The study period covers 2019-2033, with a base year of 2025 and a forecast period of 2025-2033. This report is essential for industry stakeholders, investors, and anyone seeking to understand the dynamics and future of this rapidly growing market. We analyze key players like Emsland, Roquette, Cosucra, Nutri-Pea, Shuangta Food, Yantai Oriental Protein Tech, Shandong Jianyuan Foods, and Shandong Huatai Food, providing actionable insights for strategic decision-making.
Pea Protein Market Dynamics & Concentration
The global pea protein market exhibits a moderately concentrated structure, with a few dominant players capturing a significant market share. Emsland, Roquette, and Cosucra collectively hold an estimated xx% market share in 2025. Innovation in processing techniques, such as improved extraction methods to enhance protein content and functionality, is a key driver. Stringent regulatory frameworks concerning food safety and labeling influence market growth. Plant-based protein alternatives, such as soy and brown rice protein, pose competitive pressures. Growing consumer demand for plant-based diets and functional foods is a major end-user trend. The historical period (2019-2024) witnessed xx M&A deals, indicating consolidation within the industry.
- Market Concentration: High concentration in the production of pea protein isolates and concentrates.
- Innovation Drivers: Development of new extraction methods, improved functionality, and novel applications.
- Regulatory Landscape: Stringent food safety regulations and labeling requirements.
- Product Substitutes: Soy protein, brown rice protein, and other plant-based alternatives.
- End-User Trends: Growing demand for plant-based foods, health & wellness products, and sustainable protein sources.
- M&A Activity: xx M&A deals during the historical period (2019-2024), indicating a trend towards market consolidation.
Pea Protein Industry Trends & Analysis
The pea protein market is experiencing robust growth, driven by several factors. The market is estimated to register a CAGR of xx% during the forecast period (2025-2033). Technological advancements in extraction and processing have improved pea protein functionality, making it suitable for a wider range of applications. Consumer preference shifts towards plant-based diets and concerns about sustainability and ethical sourcing are strong market drivers. Competitive dynamics are characterized by innovation in product offerings, expansion into new geographical markets, and strategic partnerships. Market penetration in food and beverage applications is already high; however, significant opportunities exist in the personal care and animal feed industries.
Leading Markets & Segments in Pea Protein
The North American and European regions currently dominate the global pea protein market, fueled by strong consumer demand for plant-based protein sources and well-established food processing industries. Within these regions, countries with advanced food processing infrastructure and supportive government policies fostering sustainable agriculture are leading the market.
- Key Drivers in North America & Europe:
- Strong consumer demand for plant-based foods.
- Well-established food processing and distribution networks.
- Supportive government policies promoting sustainable agriculture.
- High level of research and development in food technology.
The detailed analysis shows a clear dominance of the food and beverage segment, primarily driven by the increasing demand for plant-based meat alternatives, protein bars, and nutritional supplements. The animal feed segment displays significant growth potential.
Pea Protein Product Developments
Recent innovations focus on improving the functionality of pea protein, including enhancing its solubility, emulsification properties, and texture. These advancements have expanded pea protein applications in various products, from meat alternatives to beverages and baked goods. Companies are developing pea protein isolates with improved nutritional profiles and functional properties to address market demands for high-quality and versatile plant-based ingredients. This increases competitiveness, particularly in the rapidly growing plant-based meat substitute market segment.
Key Drivers of Pea Protein Growth
Several factors are accelerating the growth of the pea protein market. Technological advances in extraction and processing are making it more cost-effective and improving its functional properties. The rising global population and the increasing demand for plant-based protein sources create a strong market pull. Favorable government regulations and policies promoting sustainable agriculture are stimulating the market's expansion. Furthermore, growing awareness of the health benefits of plant-based diets is driving its acceptance among health-conscious consumers.
Challenges in the Pea Protein Market
The pea protein market faces certain challenges. Fluctuations in raw material prices and supply chain disruptions can impact production costs and market stability. Meeting the high demand for sustainable and ethical sourcing practices presents a challenge for some producers. Intense competition from other plant-based proteins requires continuous innovation and strategic market positioning.
Emerging Opportunities in Pea Protein
The long-term growth potential of the pea protein market is immense. Technological breakthroughs in improving protein functionality and discovering new applications will open new market segments. Strategic partnerships between food processors and pea protein producers can enhance market penetration. Expanding into new geographical markets, particularly in developing countries, offers significant growth opportunities.
Key Milestones in Pea Protein Industry
- 2020: Increased investment in pea protein research and development by several key players.
- 2021: Launch of several new pea-protein-based food products by major food manufacturers.
- 2022: Several significant M&A activities in the pea protein industry consolidating the market.
- 2023: Growing consumer awareness of pea protein benefits.
- 2024: Increased regulatory attention on sustainability and ethical sourcing in pea protein production.
Strategic Outlook for Pea Protein Market
The pea protein market is poised for continued strong growth, driven by increasing consumer demand for plant-based protein and ongoing innovation in product development. Strategic partnerships, investments in research and development, and expansion into new markets will be crucial for success in this dynamic sector. Companies that can effectively address the challenges of sustainable sourcing and supply chain management while innovating and meeting consumer demand will be best positioned for long-term growth.
Pea Protein Segmentation
-
1. Application
- 1.1. Sports Nutrition Food
- 1.2. Energy Drinks
- 1.3. Health Food
- 1.4. Pet Food
-
2. Type
- 2.1. Low Purity Pea Protein Isolate (75%-80%)
- 2.2. Medium Purity Pea Protein Isolate (80%-85%)
- 2.3. High Purity Pea Protein Isolate (>85%)
Pea Protein Segmentation By Geography
-
1. North America
- 1.1. United States
- 1.2. Canada
- 1.3. Mexico
-
2. South America
- 2.1. Brazil
- 2.2. Argentina
- 2.3. Rest of South America
-
3. Europe
- 3.1. United Kingdom
- 3.2. Germany
- 3.3. France
- 3.4. Italy
- 3.5. Spain
- 3.6. Russia
- 3.7. Benelux
- 3.8. Nordics
- 3.9. Rest of Europe
-
4. Middle East & Africa
- 4.1. Turkey
- 4.2. Israel
- 4.3. GCC
- 4.4. North Africa
- 4.5. South Africa
- 4.6. Rest of Middle East & Africa
-
5. Asia Pacific
- 5.1. China
- 5.2. India
- 5.3. Japan
- 5.4. South Korea
- 5.5. ASEAN
- 5.6. Oceania
- 5.7. Rest of Asia Pacific
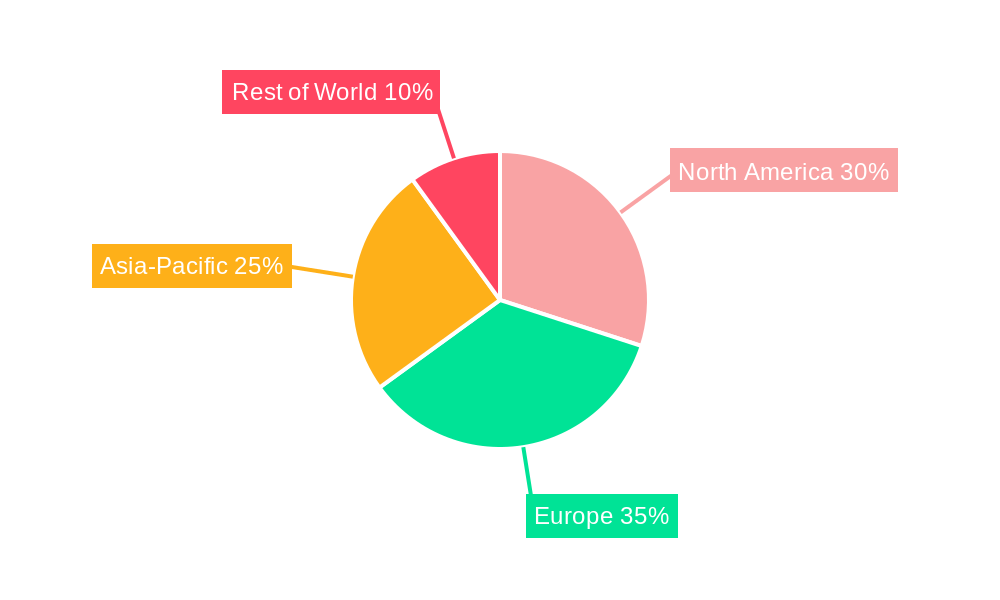
Pea Protein Regional Market Share
Geographic Coverage of Pea Protein
Pea Protein REPORT HIGHLIGHTS
| Aspects | Details |
|---|---|
| Study Period | 2020-2034 |
| Base Year | 2025 |
| Estimated Year | 2026 |
| Forecast Period | 2026-2034 |
| Historical Period | 2020-2025 |
| Growth Rate | CAGR of 11.84% from 2020-2034 |
| Segmentation |
|
Table of Contents
- 1. Introduction
- 1.1. Research Scope
- 1.2. Market Segmentation
- 1.3. Research Objective
- 1.4. Definitions and Assumptions
- 2. Executive Summary
- 2.1. Market Snapshot
- 3. Market Dynamics
- 3.1. Market Drivers
- 3.2. Market Restrains
- 3.3. Market Trends
- 3.4. Market Opportunities
- 4. Market Factor Analysis
- 4.1. Porters Five Forces
- 4.1.1. Bargaining Power of Suppliers
- 4.1.2. Bargaining Power of Buyers
- 4.1.3. Threat of New Entrants
- 4.1.4. Threat of Substitutes
- 4.1.5. Competitive Rivalry
- 4.2. PESTEL analysis
- 4.3. BCG Analysis
- 4.3.1. Stars (High Growth, High Market Share)
- 4.3.2. Cash Cows (Low Growth, High Market Share)
- 4.3.3. Question Mark (High Growth, Low Market Share)
- 4.3.4. Dogs (Low Growth, Low Market Share)
- 4.4. Ansoff Matrix Analysis
- 4.5. Supply Chain Analysis
- 4.6. Regulatory Landscape
- 4.7. Current Market Potential and Opportunity Assessment (TAM–SAM–SOM Framework)
- 4.8. MDP Analyst Note
- 4.1. Porters Five Forces
- 5. Market Analysis, Insights and Forecast 2021-2033
- 5.1. Market Analysis, Insights and Forecast - by Application
- 5.1.1. Sports Nutrition Food
- 5.1.2. Energy Drinks
- 5.1.3. Health Food
- 5.1.4. Pet Food
- 5.2. Market Analysis, Insights and Forecast - by Type
- 5.2.1. Low Purity Pea Protein Isolate (75%-80%)
- 5.2.2. Medium Purity Pea Protein Isolate (80%-85%)
- 5.2.3. High Purity Pea Protein Isolate (>85%)
- 5.3. Market Analysis, Insights and Forecast - by Region
- 5.3.1. North America
- 5.3.2. South America
- 5.3.3. Europe
- 5.3.4. Middle East & Africa
- 5.3.5. Asia Pacific
- 5.1. Market Analysis, Insights and Forecast - by Application
- 6. Global Pea Protein Analysis, Insights and Forecast, 2021-2033
- 6.1. Market Analysis, Insights and Forecast - by Application
- 6.1.1. Sports Nutrition Food
- 6.1.2. Energy Drinks
- 6.1.3. Health Food
- 6.1.4. Pet Food
- 6.2. Market Analysis, Insights and Forecast - by Type
- 6.2.1. Low Purity Pea Protein Isolate (75%-80%)
- 6.2.2. Medium Purity Pea Protein Isolate (80%-85%)
- 6.2.3. High Purity Pea Protein Isolate (>85%)
- 6.1. Market Analysis, Insights and Forecast - by Application
- 7. North America Pea Protein Analysis, Insights and Forecast, 2020-2032
- 7.1. Market Analysis, Insights and Forecast - by Application
- 7.1.1. Sports Nutrition Food
- 7.1.2. Energy Drinks
- 7.1.3. Health Food
- 7.1.4. Pet Food
- 7.2. Market Analysis, Insights and Forecast - by Type
- 7.2.1. Low Purity Pea Protein Isolate (75%-80%)
- 7.2.2. Medium Purity Pea Protein Isolate (80%-85%)
- 7.2.3. High Purity Pea Protein Isolate (>85%)
- 7.1. Market Analysis, Insights and Forecast - by Application
- 8. South America Pea Protein Analysis, Insights and Forecast, 2020-2032
- 8.1. Market Analysis, Insights and Forecast - by Application
- 8.1.1. Sports Nutrition Food
- 8.1.2. Energy Drinks
- 8.1.3. Health Food
- 8.1.4. Pet Food
- 8.2. Market Analysis, Insights and Forecast - by Type
- 8.2.1. Low Purity Pea Protein Isolate (75%-80%)
- 8.2.2. Medium Purity Pea Protein Isolate (80%-85%)
- 8.2.3. High Purity Pea Protein Isolate (>85%)
- 8.1. Market Analysis, Insights and Forecast - by Application
- 9. Europe Pea Protein Analysis, Insights and Forecast, 2020-2032
- 9.1. Market Analysis, Insights and Forecast - by Application
- 9.1.1. Sports Nutrition Food
- 9.1.2. Energy Drinks
- 9.1.3. Health Food
- 9.1.4. Pet Food
- 9.2. Market Analysis, Insights and Forecast - by Type
- 9.2.1. Low Purity Pea Protein Isolate (75%-80%)
- 9.2.2. Medium Purity Pea Protein Isolate (80%-85%)
- 9.2.3. High Purity Pea Protein Isolate (>85%)
- 9.1. Market Analysis, Insights and Forecast - by Application
- 10. Middle East & Africa Pea Protein Analysis, Insights and Forecast, 2020-2032
- 10.1. Market Analysis, Insights and Forecast - by Application
- 10.1.1. Sports Nutrition Food
- 10.1.2. Energy Drinks
- 10.1.3. Health Food
- 10.1.4. Pet Food
- 10.2. Market Analysis, Insights and Forecast - by Type
- 10.2.1. Low Purity Pea Protein Isolate (75%-80%)
- 10.2.2. Medium Purity Pea Protein Isolate (80%-85%)
- 10.2.3. High Purity Pea Protein Isolate (>85%)
- 10.1. Market Analysis, Insights and Forecast - by Application
- 11. Asia Pacific Pea Protein Analysis, Insights and Forecast, 2020-2032
- 11.1. Market Analysis, Insights and Forecast - by Application
- 11.1.1. Sports Nutrition Food
- 11.1.2. Energy Drinks
- 11.1.3. Health Food
- 11.1.4. Pet Food
- 11.2. Market Analysis, Insights and Forecast - by Type
- 11.2.1. Low Purity Pea Protein Isolate (75%-80%)
- 11.2.2. Medium Purity Pea Protein Isolate (80%-85%)
- 11.2.3. High Purity Pea Protein Isolate (>85%)
- 11.1. Market Analysis, Insights and Forecast - by Application
- 12. Competitive Analysis
- 12.1. Company Profiles
- 12.1.1 Emsland
- 12.1.1.1. Company Overview
- 12.1.1.2. Products
- 12.1.1.3. Company Financials
- 12.1.1.4. SWOT Analysis
- 12.1.2 Roquette
- 12.1.2.1. Company Overview
- 12.1.2.2. Products
- 12.1.2.3. Company Financials
- 12.1.2.4. SWOT Analysis
- 12.1.3 Cosucra
- 12.1.3.1. Company Overview
- 12.1.3.2. Products
- 12.1.3.3. Company Financials
- 12.1.3.4. SWOT Analysis
- 12.1.4 Nutri-Pea
- 12.1.4.1. Company Overview
- 12.1.4.2. Products
- 12.1.4.3. Company Financials
- 12.1.4.4. SWOT Analysis
- 12.1.5 Shuangta Food
- 12.1.5.1. Company Overview
- 12.1.5.2. Products
- 12.1.5.3. Company Financials
- 12.1.5.4. SWOT Analysis
- 12.1.6 Yantai Oriental Protein Tech
- 12.1.6.1. Company Overview
- 12.1.6.2. Products
- 12.1.6.3. Company Financials
- 12.1.6.4. SWOT Analysis
- 12.1.7 Shandong Jianyuan Foods
- 12.1.7.1. Company Overview
- 12.1.7.2. Products
- 12.1.7.3. Company Financials
- 12.1.7.4. SWOT Analysis
- 12.1.8 Shandong Huatai Food
- 12.1.8.1. Company Overview
- 12.1.8.2. Products
- 12.1.8.3. Company Financials
- 12.1.8.4. SWOT Analysis
- 12.1.1 Emsland
- 12.2. Market Entropy
- 12.2.1 Company's Key Areas Served
- 12.2.2 Recent Developments
- 12.3. Company Market Share Analysis 2025
- 12.3.1 Top 5 Companies Market Share Analysis
- 12.3.2 Top 3 Companies Market Share Analysis
- 12.4. List of Potential Customers
- 13. Research Methodology
List of Figures
- Figure 1: Global Pea Protein Revenue Breakdown (billion, %) by Region 2025 & 2033
- Figure 2: North America Pea Protein Revenue (billion), by Application 2025 & 2033
- Figure 3: North America Pea Protein Revenue Share (%), by Application 2025 & 2033
- Figure 4: North America Pea Protein Revenue (billion), by Type 2025 & 2033
- Figure 5: North America Pea Protein Revenue Share (%), by Type 2025 & 2033
- Figure 6: North America Pea Protein Revenue (billion), by Country 2025 & 2033
- Figure 7: North America Pea Protein Revenue Share (%), by Country 2025 & 2033
- Figure 8: South America Pea Protein Revenue (billion), by Application 2025 & 2033
- Figure 9: South America Pea Protein Revenue Share (%), by Application 2025 & 2033
- Figure 10: South America Pea Protein Revenue (billion), by Type 2025 & 2033
- Figure 11: South America Pea Protein Revenue Share (%), by Type 2025 & 2033
- Figure 12: South America Pea Protein Revenue (billion), by Country 2025 & 2033
- Figure 13: South America Pea Protein Revenue Share (%), by Country 2025 & 2033
- Figure 14: Europe Pea Protein Revenue (billion), by Application 2025 & 2033
- Figure 15: Europe Pea Protein Revenue Share (%), by Application 2025 & 2033
- Figure 16: Europe Pea Protein Revenue (billion), by Type 2025 & 2033
- Figure 17: Europe Pea Protein Revenue Share (%), by Type 2025 & 2033
- Figure 18: Europe Pea Protein Revenue (billion), by Country 2025 & 2033
- Figure 19: Europe Pea Protein Revenue Share (%), by Country 2025 & 2033
- Figure 20: Middle East & Africa Pea Protein Revenue (billion), by Application 2025 & 2033
- Figure 21: Middle East & Africa Pea Protein Revenue Share (%), by Application 2025 & 2033
- Figure 22: Middle East & Africa Pea Protein Revenue (billion), by Type 2025 & 2033
- Figure 23: Middle East & Africa Pea Protein Revenue Share (%), by Type 2025 & 2033
- Figure 24: Middle East & Africa Pea Protein Revenue (billion), by Country 2025 & 2033
- Figure 25: Middle East & Africa Pea Protein Revenue Share (%), by Country 2025 & 2033
- Figure 26: Asia Pacific Pea Protein Revenue (billion), by Application 2025 & 2033
- Figure 27: Asia Pacific Pea Protein Revenue Share (%), by Application 2025 & 2033
- Figure 28: Asia Pacific Pea Protein Revenue (billion), by Type 2025 & 2033
- Figure 29: Asia Pacific Pea Protein Revenue Share (%), by Type 2025 & 2033
- Figure 30: Asia Pacific Pea Protein Revenue (billion), by Country 2025 & 2033
- Figure 31: Asia Pacific Pea Protein Revenue Share (%), by Country 2025 & 2033
List of Tables
- Table 1: Global Pea Protein Revenue billion Forecast, by Application 2020 & 2033
- Table 2: Global Pea Protein Revenue billion Forecast, by Type 2020 & 2033
- Table 3: Global Pea Protein Revenue billion Forecast, by Region 2020 & 2033
- Table 4: Global Pea Protein Revenue billion Forecast, by Application 2020 & 2033
- Table 5: Global Pea Protein Revenue billion Forecast, by Type 2020 & 2033
- Table 6: Global Pea Protein Revenue billion Forecast, by Country 2020 & 2033
- Table 7: United States Pea Protein Revenue (billion) Forecast, by Application 2020 & 2033
- Table 8: Canada Pea Protein Revenue (billion) Forecast, by Application 2020 & 2033
- Table 9: Mexico Pea Protein Revenue (billion) Forecast, by Application 2020 & 2033
- Table 10: Global Pea Protein Revenue billion Forecast, by Application 2020 & 2033
- Table 11: Global Pea Protein Revenue billion Forecast, by Type 2020 & 2033
- Table 12: Global Pea Protein Revenue billion Forecast, by Country 2020 & 2033
- Table 13: Brazil Pea Protein Revenue (billion) Forecast, by Application 2020 & 2033
- Table 14: Argentina Pea Protein Revenue (billion) Forecast, by Application 2020 & 2033
- Table 15: Rest of South America Pea Protein Revenue (billion) Forecast, by Application 2020 & 2033
- Table 16: Global Pea Protein Revenue billion Forecast, by Application 2020 & 2033
- Table 17: Global Pea Protein Revenue billion Forecast, by Type 2020 & 2033
- Table 18: Global Pea Protein Revenue billion Forecast, by Country 2020 & 2033
- Table 19: United Kingdom Pea Protein Revenue (billion) Forecast, by Application 2020 & 2033
- Table 20: Germany Pea Protein Revenue (billion) Forecast, by Application 2020 & 2033
- Table 21: France Pea Protein Revenue (billion) Forecast, by Application 2020 & 2033
- Table 22: Italy Pea Protein Revenue (billion) Forecast, by Application 2020 & 2033
- Table 23: Spain Pea Protein Revenue (billion) Forecast, by Application 2020 & 2033
- Table 24: Russia Pea Protein Revenue (billion) Forecast, by Application 2020 & 2033
- Table 25: Benelux Pea Protein Revenue (billion) Forecast, by Application 2020 & 2033
- Table 26: Nordics Pea Protein Revenue (billion) Forecast, by Application 2020 & 2033
- Table 27: Rest of Europe Pea Protein Revenue (billion) Forecast, by Application 2020 & 2033
- Table 28: Global Pea Protein Revenue billion Forecast, by Application 2020 & 2033
- Table 29: Global Pea Protein Revenue billion Forecast, by Type 2020 & 2033
- Table 30: Global Pea Protein Revenue billion Forecast, by Country 2020 & 2033
- Table 31: Turkey Pea Protein Revenue (billion) Forecast, by Application 2020 & 2033
- Table 32: Israel Pea Protein Revenue (billion) Forecast, by Application 2020 & 2033
- Table 33: GCC Pea Protein Revenue (billion) Forecast, by Application 2020 & 2033
- Table 34: North Africa Pea Protein Revenue (billion) Forecast, by Application 2020 & 2033
- Table 35: South Africa Pea Protein Revenue (billion) Forecast, by Application 2020 & 2033
- Table 36: Rest of Middle East & Africa Pea Protein Revenue (billion) Forecast, by Application 2020 & 2033
- Table 37: Global Pea Protein Revenue billion Forecast, by Application 2020 & 2033
- Table 38: Global Pea Protein Revenue billion Forecast, by Type 2020 & 2033
- Table 39: Global Pea Protein Revenue billion Forecast, by Country 2020 & 2033
- Table 40: China Pea Protein Revenue (billion) Forecast, by Application 2020 & 2033
- Table 41: India Pea Protein Revenue (billion) Forecast, by Application 2020 & 2033
- Table 42: Japan Pea Protein Revenue (billion) Forecast, by Application 2020 & 2033
- Table 43: South Korea Pea Protein Revenue (billion) Forecast, by Application 2020 & 2033
- Table 44: ASEAN Pea Protein Revenue (billion) Forecast, by Application 2020 & 2033
- Table 45: Oceania Pea Protein Revenue (billion) Forecast, by Application 2020 & 2033
- Table 46: Rest of Asia Pacific Pea Protein Revenue (billion) Forecast, by Application 2020 & 2033
Frequently Asked Questions
1. What is the projected Compound Annual Growth Rate (CAGR) of the Pea Protein?
The projected CAGR is approximately 11.84%.
2. Which companies are prominent players in the Pea Protein?
Key companies in the market include Emsland, Roquette, Cosucra, Nutri-Pea, Shuangta Food, Yantai Oriental Protein Tech, Shandong Jianyuan Foods, Shandong Huatai Food.
3. What are the main segments of the Pea Protein?
The market segments include Application, Type.
4. Can you provide details about the market size?
The market size is estimated to be USD 3.3 billion as of 2022.
5. What are some drivers contributing to market growth?
N/A
6. What are the notable trends driving market growth?
N/A
7. Are there any restraints impacting market growth?
N/A
8. Can you provide examples of recent developments in the market?
N/A
9. What pricing options are available for accessing the report?
Pricing options include single-user, multi-user, and enterprise licenses priced at USD 4250.00, USD 6375.00, and USD 8500.00 respectively.
10. Is the market size provided in terms of value or volume?
The market size is provided in terms of value, measured in billion.
11. Are there any specific market keywords associated with the report?
Yes, the market keyword associated with the report is "Pea Protein," which aids in identifying and referencing the specific market segment covered.
12. How do I determine which pricing option suits my needs best?
The pricing options vary based on user requirements and access needs. Individual users may opt for single-user licenses, while businesses requiring broader access may choose multi-user or enterprise licenses for cost-effective access to the report.
13. Are there any additional resources or data provided in the Pea Protein report?
While the report offers comprehensive insights, it's advisable to review the specific contents or supplementary materials provided to ascertain if additional resources or data are available.
14. How can I stay updated on further developments or reports in the Pea Protein?
To stay informed about further developments, trends, and reports in the Pea Protein, consider subscribing to industry newsletters, following relevant companies and organizations, or regularly checking reputable industry news sources and publications.
Methodology
Step 1 - Identification of Relevant Samples Size from Population Database


Step 2 - Approaches for Defining Global Market Size (Value, Volume* & Price*)

Note*: In applicable scenarios
Step 3 - Data Sources
Primary Research
- Web Analytics
- Survey Reports
- Research Institute
- Latest Research Reports
- Opinion Leaders
Secondary Research
- Annual Reports
- White Paper
- Latest Press Release
- Industry Association
- Paid Database
- Investor Presentations

Step 4 - Data Triangulation
Involves using different sources of information in order to increase the validity of a study
These sources are likely to be stakeholders in a program - participants, other researchers, program staff, other community members, and so on.
Then we put all data in single framework & apply various statistical tools to find out the dynamic on the market.
During the analysis stage, feedback from the stakeholder groups would be compared to determine areas of agreement as well as areas of divergence