

Key Insights
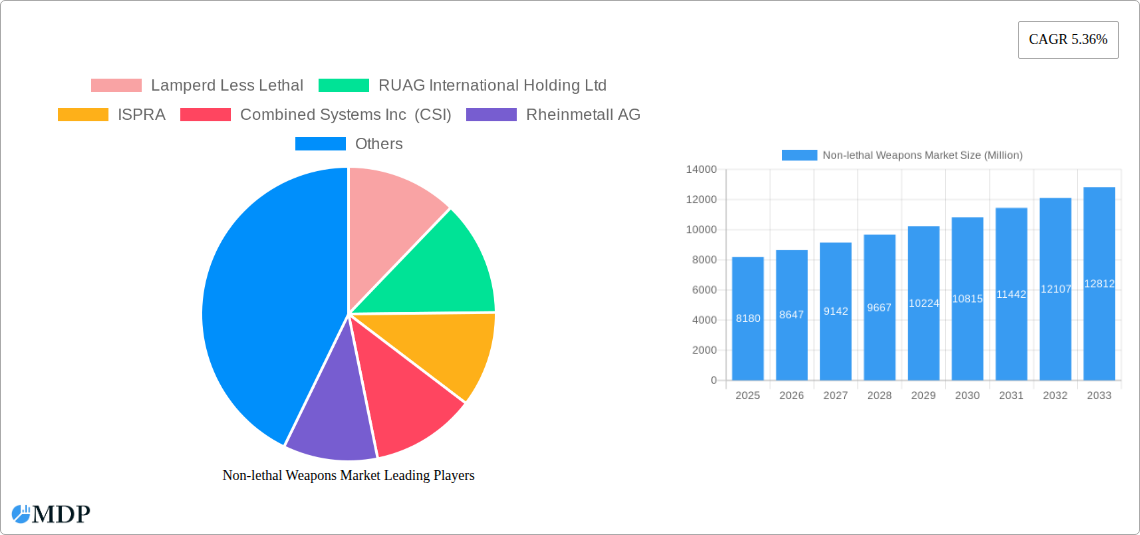
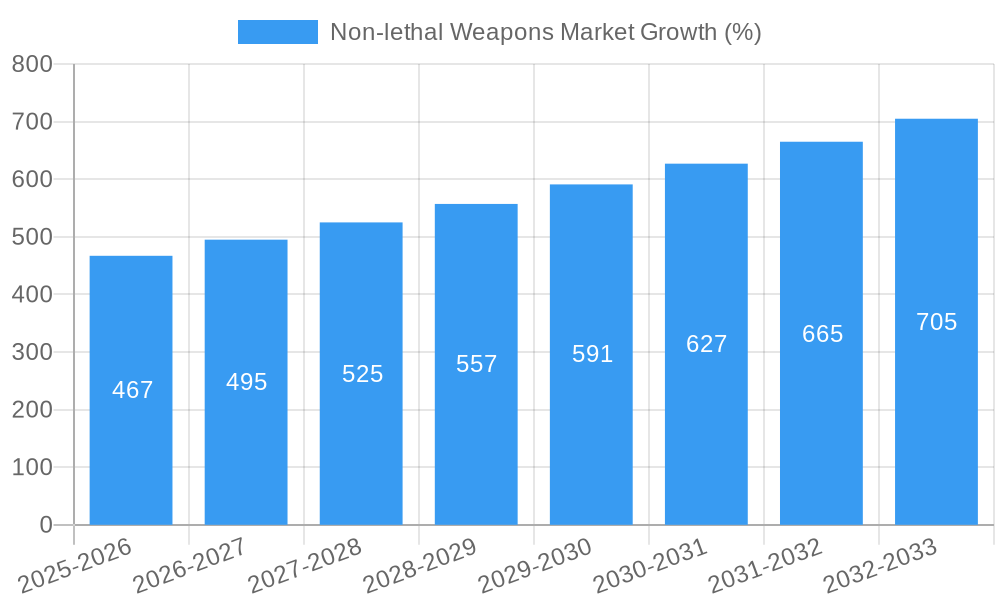
The non-lethal weapons market, valued at $8.18 billion in 2025, is projected to experience robust growth, exhibiting a Compound Annual Growth Rate (CAGR) of 5.36% from 2025 to 2033. This expansion is fueled by several key drivers. Increasing global concerns regarding civilian safety and minimizing casualties in law enforcement and military operations are significantly bolstering demand for less-lethal alternatives to traditional firearms. Furthermore, technological advancements in directed energy weapons, such as electroshock weapons and pepper spray systems, are leading to the development of more effective and precise non-lethal tools. The rising adoption of these technologies by law enforcement agencies worldwide and increasing military expenditure on advanced defense solutions are further contributing to market growth. Market segmentation reveals that anti-personnel ammunition and area denial systems currently dominate the product landscape, while law enforcement remains the leading application segment. However, the increasing adoption of non-lethal weapons in military applications presents a significant growth opportunity. While stringent regulations and ethical concerns surrounding the use of non-lethal weapons could pose challenges, the overall market outlook remains positive, driven by ongoing technological innovation and a growing global need for effective crowd control and de-escalation tactics.
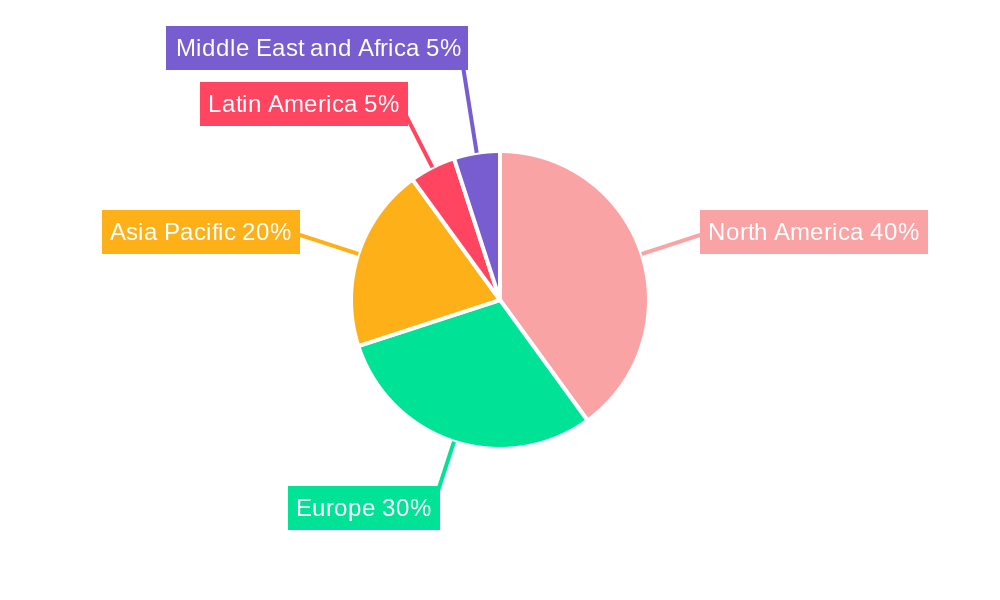
The geographic distribution of the non-lethal weapons market reflects the varying levels of security concerns and technological adoption across different regions. North America, particularly the United States, is currently the largest market, benefiting from significant investment in advanced law enforcement and military technologies. Europe follows closely, with a strong presence of established defense manufacturers. The Asia-Pacific region is witnessing rapid growth, driven by increasing urbanization, escalating security concerns, and rising defense spending in countries like China and India. Latin America and the Middle East and Africa are also expected to witness moderate growth, albeit at a slower pace compared to the more developed regions. Competition within the market is intense, with a mix of large multinational corporations and specialized smaller companies vying for market share. This competitive landscape fosters innovation and drives down prices, making non-lethal weapons increasingly accessible to various stakeholders.
Non-Lethal Weapons Market: A Comprehensive Report (2019-2033)
This in-depth report provides a comprehensive analysis of the Non-Lethal Weapons Market, offering invaluable insights for industry stakeholders, investors, and strategic decision-makers. Covering the period from 2019 to 2033, with a focus on 2025, this report unveils market dynamics, trends, leading players, and future growth potential. The market is projected to reach xx Million by 2033, presenting significant opportunities for growth and innovation.
Non-lethal Weapons Market Market Dynamics & Concentration
The Non-Lethal Weapons market is characterized by a moderate level of concentration, with several key players holding significant market share. However, the market is also witnessing increasing competition from smaller, innovative companies focusing on niche segments. The market is driven by continuous technological advancements, stricter regulations regarding lethal force, and increasing demand from law enforcement and military agencies worldwide. Product substitution is minimal, with the focus primarily on improving existing technologies and developing more effective and safer non-lethal options. The regulatory landscape is evolving, with different regions having varying regulations, creating both opportunities and challenges for market participants. Mergers and acquisitions (M&A) activity is moderate, with larger companies seeking to expand their product portfolios and market reach through strategic acquisitions of smaller, specialized firms.
- Market Concentration: The top 5 players account for approximately xx% of the market share in 2025.
- Innovation Drivers: Technological advancements in directed energy weapons, improved ammunition designs, and sophisticated control systems.
- Regulatory Frameworks: Varying regulations across different jurisdictions impact market penetration and product development strategies.
- Product Substitutes: Limited substitutes exist, primarily focused on improving existing non-lethal technologies.
- End-User Trends: Increasing preference for less-lethal options by law enforcement and military agencies due to ethical and operational considerations.
- M&A Activities: An estimated xx M&A deals occurred between 2019 and 2024, driven by the desire to consolidate market share and expand product offerings.
Non-lethal Weapons Market Industry Trends & Analysis
The Non-Lethal Weapons market is experiencing robust growth, driven by several key factors. The increasing adoption of non-lethal weapons by law enforcement agencies globally, to mitigate civilian casualties and maintain public order, fuels market expansion. Technological disruptions, such as advancements in directed energy weapons and smart ammunition, are creating new market opportunities and transforming the competitive landscape. Consumer preferences are shifting towards more precise, effective, and less harmful non-lethal options. Competitive dynamics are intense, with established players facing challenges from innovative startups offering cutting-edge technologies. The market is expected to witness a Compound Annual Growth Rate (CAGR) of xx% during the forecast period (2025-2033), with significant market penetration expected in developing economies.
Leading Markets & Segments in Non-lethal Weapons Market
The North American region currently holds the largest market share, driven by strong demand from law enforcement agencies and the military. Within the segments, Anti-personnel Ammunition and Pepper Spray are the leading product types, while law enforcement constitutes the largest application segment.
- Key Drivers in North America: Stringent law enforcement regulations, high technological advancement, and robust defense spending.
- Key Drivers in Europe: Increasing adoption of non-lethal weapons by law enforcement, and growing awareness of the need for less-lethal crowd control measures.
- Key Drivers in Asia-Pacific: Increasing instances of civil unrest and terrorism, and growing government spending on internal security.
Dominance Analysis: North America's dominance is attributed to its advanced technological capabilities, significant defense budgets, and strict regulations promoting non-lethal solutions in law enforcement. The Anti-personnel Ammunition and Pepper Spray segments maintain their leading positions due to their established effectiveness and widespread usage. Law enforcement represents the largest application segment due to the considerable needs of maintaining public order and reducing civilian casualties.
Non-lethal Weapons Market Product Developments
Recent product innovations are focused on enhancing precision, effectiveness, and safety. Advancements in directed energy weapons, such as improved tasers and lasers, are gaining traction. Smart ammunition with enhanced targeting capabilities is also emerging, optimizing the impact and reducing collateral damage. These technological trends are tailored to meet the evolving needs of law enforcement and military applications, emphasizing minimizing harm while maximizing effectiveness. The market continues to witness innovative solutions that address the demand for safer and more efficient non-lethal technologies.
Key Drivers of Non-lethal Weapons Market Growth
Several factors are driving the growth of the non-lethal weapons market. Advancements in technology, such as the development of more effective and less harmful non-lethal weapons, are key drivers. Increased government spending on defense and internal security, particularly in regions facing civil unrest or terrorism, fuels market expansion. Moreover, changing societal attitudes and growing concern regarding the use of lethal force by law enforcement agencies are leading to greater adoption of non-lethal alternatives.
Challenges in the Non-lethal Weapons Market Market
The Non-lethal Weapons market faces several challenges, including stringent regulatory frameworks that can hinder product development and market entry. Supply chain disruptions and fluctuating raw material prices can impact production costs and profitability. Furthermore, intense competition from established players and new entrants necessitates continuous innovation and adaptation to maintain market share. These factors can create uncertainty for businesses operating in this sector.
Emerging Opportunities in Non-lethal Weapons Market
Significant opportunities for growth exist in the non-lethal weapons market. Technological breakthroughs, such as the development of more precise and versatile directed energy weapons, are opening new avenues for market expansion. Strategic partnerships between technology companies and law enforcement agencies can enhance product development and market penetration. Moreover, expansion into emerging markets with growing security needs offers substantial growth potential.
Leading Players in the Non-lethal Weapons Market Sector
- Lamperd Less Lethal
- RUAG International Holding Ltd
- ISPRÁ
- Combined Systems Inc (CSI)
- Rheinmetall AG
- Byrna Technologies Inc
- CONDOR TECNOLOGIAS Não LETALIS
- AMTEC Less-Lethal Systems Inc
- NonLethal Technologies Inc
- RTX Corporation
- Fiocchi Munizioni S p A
- Zarc International Inc
- Axon Enterprise Inc
- UTS United Tactical Systems LLC (Pepperball)
- Herstal Group
- Safariland LLC
Key Milestones in Non-lethal Weapons Market Industry
- May 2023: The Republic of Singapore Navy equips its Sentinel-class vessels with Sitep Italia's MASS, demonstrating a shift towards advanced non-lethal technologies in maritime security.
- January 2022: KWESST Micro Systems Inc. launches the Para Ops Low Energy Cartridge System, signifying a significant advancement in personal defense and law enforcement applications.
Strategic Outlook for Non-lethal Weapons Market Market
The Non-lethal Weapons market is poised for continued growth, driven by technological advancements and increasing demand. Strategic opportunities include focusing on innovative product development, expanding into new markets, and forging strategic partnerships. Companies that can effectively navigate the regulatory landscape and address the evolving needs of law enforcement and military agencies are well-positioned to capitalize on this market's long-term growth potential.
Non-lethal Weapons Market Segmentation
-
1. Type
-
1.1. Area Denial
- 1.1.1. Anti-vehicle
- 1.1.2. Anti-personnel
-
1.2. Ammunition
- 1.2.1. Rubber Bullets
- 1.2.2. Wax Bullets
- 1.2.3. Plastic Bullets
- 1.2.4. Bean Bag Rounds
- 1.2.5. Sponge Grenade
-
1.3. Explosives
- 1.3.1. Flash Bang Grenades
- 1.3.2. Sting Grenades
-
1.4. Gases and Sprays
- 1.4.1. Water Cannons
- 1.4.2. Scent-based Weapons
- 1.4.3. Teargas
- 1.4.4. Pepper Spray
- 1.5. Directed Energy Weapons
- 1.6. Electroshock Weapons
-
1.1. Area Denial
-
2. Application
- 2.1. Law Enforcement
- 2.2. Military
Non-lethal Weapons Market Segmentation By Geography
-
1. North America
- 1.1. United States
- 1.2. Canada
-
2. Europe
- 2.1. United Kingdom
- 2.2. Germany
- 2.3. France
- 2.4. Rest of Europe
-
3. Asia Pacific
- 3.1. China
- 3.2. India
- 3.3. Japan
- 3.4. South Korea
- 3.5. Rest of Asia Pacific
-
4. Latin America
- 4.1. Brazil
- 4.2. Mexico
- 4.3. Rest of Latin America
-
5. Middle East and Africa
- 5.1. United Arab Emirates
- 5.2. Saudi Arabia
- 5.3. Egypt
- 5.4. Qatar
- 5.5. Rest of Middle East and Africa
Non-lethal Weapons Market REPORT HIGHLIGHTS
| Aspects | Details |
|---|---|
| Study Period | 2019-2033 |
| Base Year | 2024 |
| Estimated Year | 2025 |
| Forecast Period | 2025-2033 |
| Historical Period | 2019-2024 |
| Growth Rate | CAGR of 5.36% from 2019-2033 |
| Segmentation |
|
Table of Contents
- 1. Introduction
- 1.1. Research Scope
- 1.2. Market Segmentation
- 1.3. Research Methodology
- 1.4. Definitions and Assumptions
- 2. Executive Summary
- 2.1. Introduction
- 3. Market Dynamics
- 3.1. Introduction
- 3.2. Market Drivers
- 3.3. Market Restrains
- 3.4. Market Trends
- 3.4.1. Military Segment is Anticipated to Grow with the Highest CAGR During the Forecast Period
- 4. Market Factor Analysis
- 4.1. Porters Five Forces
- 4.2. Supply/Value Chain
- 4.3. PESTEL analysis
- 4.4. Market Entropy
- 4.5. Patent/Trademark Analysis
- 5. Global Non-lethal Weapons Market Analysis, Insights and Forecast, 2019-2031
- 5.1. Market Analysis, Insights and Forecast - by Type
- 5.1.1. Area Denial
- 5.1.1.1. Anti-vehicle
- 5.1.1.2. Anti-personnel
- 5.1.2. Ammunition
- 5.1.2.1. Rubber Bullets
- 5.1.2.2. Wax Bullets
- 5.1.2.3. Plastic Bullets
- 5.1.2.4. Bean Bag Rounds
- 5.1.2.5. Sponge Grenade
- 5.1.3. Explosives
- 5.1.3.1. Flash Bang Grenades
- 5.1.3.2. Sting Grenades
- 5.1.4. Gases and Sprays
- 5.1.4.1. Water Cannons
- 5.1.4.2. Scent-based Weapons
- 5.1.4.3. Teargas
- 5.1.4.4. Pepper Spray
- 5.1.5. Directed Energy Weapons
- 5.1.6. Electroshock Weapons
- 5.1.1. Area Denial
- 5.2. Market Analysis, Insights and Forecast - by Application
- 5.2.1. Law Enforcement
- 5.2.2. Military
- 5.3. Market Analysis, Insights and Forecast - by Region
- 5.3.1. North America
- 5.3.2. Europe
- 5.3.3. Asia Pacific
- 5.3.4. Latin America
- 5.3.5. Middle East and Africa
- 5.1. Market Analysis, Insights and Forecast - by Type
- 6. North America Non-lethal Weapons Market Analysis, Insights and Forecast, 2019-2031
- 6.1. Market Analysis, Insights and Forecast - by Type
- 6.1.1. Area Denial
- 6.1.1.1. Anti-vehicle
- 6.1.1.2. Anti-personnel
- 6.1.2. Ammunition
- 6.1.2.1. Rubber Bullets
- 6.1.2.2. Wax Bullets
- 6.1.2.3. Plastic Bullets
- 6.1.2.4. Bean Bag Rounds
- 6.1.2.5. Sponge Grenade
- 6.1.3. Explosives
- 6.1.3.1. Flash Bang Grenades
- 6.1.3.2. Sting Grenades
- 6.1.4. Gases and Sprays
- 6.1.4.1. Water Cannons
- 6.1.4.2. Scent-based Weapons
- 6.1.4.3. Teargas
- 6.1.4.4. Pepper Spray
- 6.1.5. Directed Energy Weapons
- 6.1.6. Electroshock Weapons
- 6.1.1. Area Denial
- 6.2. Market Analysis, Insights and Forecast - by Application
- 6.2.1. Law Enforcement
- 6.2.2. Military
- 6.1. Market Analysis, Insights and Forecast - by Type
- 7. Europe Non-lethal Weapons Market Analysis, Insights and Forecast, 2019-2031
- 7.1. Market Analysis, Insights and Forecast - by Type
- 7.1.1. Area Denial
- 7.1.1.1. Anti-vehicle
- 7.1.1.2. Anti-personnel
- 7.1.2. Ammunition
- 7.1.2.1. Rubber Bullets
- 7.1.2.2. Wax Bullets
- 7.1.2.3. Plastic Bullets
- 7.1.2.4. Bean Bag Rounds
- 7.1.2.5. Sponge Grenade
- 7.1.3. Explosives
- 7.1.3.1. Flash Bang Grenades
- 7.1.3.2. Sting Grenades
- 7.1.4. Gases and Sprays
- 7.1.4.1. Water Cannons
- 7.1.4.2. Scent-based Weapons
- 7.1.4.3. Teargas
- 7.1.4.4. Pepper Spray
- 7.1.5. Directed Energy Weapons
- 7.1.6. Electroshock Weapons
- 7.1.1. Area Denial
- 7.2. Market Analysis, Insights and Forecast - by Application
- 7.2.1. Law Enforcement
- 7.2.2. Military
- 7.1. Market Analysis, Insights and Forecast - by Type
- 8. Asia Pacific Non-lethal Weapons Market Analysis, Insights and Forecast, 2019-2031
- 8.1. Market Analysis, Insights and Forecast - by Type
- 8.1.1. Area Denial
- 8.1.1.1. Anti-vehicle
- 8.1.1.2. Anti-personnel
- 8.1.2. Ammunition
- 8.1.2.1. Rubber Bullets
- 8.1.2.2. Wax Bullets
- 8.1.2.3. Plastic Bullets
- 8.1.2.4. Bean Bag Rounds
- 8.1.2.5. Sponge Grenade
- 8.1.3. Explosives
- 8.1.3.1. Flash Bang Grenades
- 8.1.3.2. Sting Grenades
- 8.1.4. Gases and Sprays
- 8.1.4.1. Water Cannons
- 8.1.4.2. Scent-based Weapons
- 8.1.4.3. Teargas
- 8.1.4.4. Pepper Spray
- 8.1.5. Directed Energy Weapons
- 8.1.6. Electroshock Weapons
- 8.1.1. Area Denial
- 8.2. Market Analysis, Insights and Forecast - by Application
- 8.2.1. Law Enforcement
- 8.2.2. Military
- 8.1. Market Analysis, Insights and Forecast - by Type
- 9. Latin America Non-lethal Weapons Market Analysis, Insights and Forecast, 2019-2031
- 9.1. Market Analysis, Insights and Forecast - by Type
- 9.1.1. Area Denial
- 9.1.1.1. Anti-vehicle
- 9.1.1.2. Anti-personnel
- 9.1.2. Ammunition
- 9.1.2.1. Rubber Bullets
- 9.1.2.2. Wax Bullets
- 9.1.2.3. Plastic Bullets
- 9.1.2.4. Bean Bag Rounds
- 9.1.2.5. Sponge Grenade
- 9.1.3. Explosives
- 9.1.3.1. Flash Bang Grenades
- 9.1.3.2. Sting Grenades
- 9.1.4. Gases and Sprays
- 9.1.4.1. Water Cannons
- 9.1.4.2. Scent-based Weapons
- 9.1.4.3. Teargas
- 9.1.4.4. Pepper Spray
- 9.1.5. Directed Energy Weapons
- 9.1.6. Electroshock Weapons
- 9.1.1. Area Denial
- 9.2. Market Analysis, Insights and Forecast - by Application
- 9.2.1. Law Enforcement
- 9.2.2. Military
- 9.1. Market Analysis, Insights and Forecast - by Type
- 10. Middle East and Africa Non-lethal Weapons Market Analysis, Insights and Forecast, 2019-2031
- 10.1. Market Analysis, Insights and Forecast - by Type
- 10.1.1. Area Denial
- 10.1.1.1. Anti-vehicle
- 10.1.1.2. Anti-personnel
- 10.1.2. Ammunition
- 10.1.2.1. Rubber Bullets
- 10.1.2.2. Wax Bullets
- 10.1.2.3. Plastic Bullets
- 10.1.2.4. Bean Bag Rounds
- 10.1.2.5. Sponge Grenade
- 10.1.3. Explosives
- 10.1.3.1. Flash Bang Grenades
- 10.1.3.2. Sting Grenades
- 10.1.4. Gases and Sprays
- 10.1.4.1. Water Cannons
- 10.1.4.2. Scent-based Weapons
- 10.1.4.3. Teargas
- 10.1.4.4. Pepper Spray
- 10.1.5. Directed Energy Weapons
- 10.1.6. Electroshock Weapons
- 10.1.1. Area Denial
- 10.2. Market Analysis, Insights and Forecast - by Application
- 10.2.1. Law Enforcement
- 10.2.2. Military
- 10.1. Market Analysis, Insights and Forecast - by Type
- 11. North America Non-lethal Weapons Market Analysis, Insights and Forecast, 2019-2031
- 11.1. Market Analysis, Insights and Forecast - By Country/Sub-region
- 11.1.1 United States
- 11.1.2 Canada
- 12. Europe Non-lethal Weapons Market Analysis, Insights and Forecast, 2019-2031
- 12.1. Market Analysis, Insights and Forecast - By Country/Sub-region
- 12.1.1 United Kingdom
- 12.1.2 Germany
- 12.1.3 France
- 12.1.4 Rest of Europe
- 13. Asia Pacific Non-lethal Weapons Market Analysis, Insights and Forecast, 2019-2031
- 13.1. Market Analysis, Insights and Forecast - By Country/Sub-region
- 13.1.1 China
- 13.1.2 India
- 13.1.3 Japan
- 13.1.4 South Korea
- 13.1.5 Rest of Asia Pacific
- 14. Latin America Non-lethal Weapons Market Analysis, Insights and Forecast, 2019-2031
- 14.1. Market Analysis, Insights and Forecast - By Country/Sub-region
- 14.1.1 Brazil
- 14.1.2 Mexico
- 14.1.3 Rest of Latin America
- 15. Middle East and Africa Non-lethal Weapons Market Analysis, Insights and Forecast, 2019-2031
- 15.1. Market Analysis, Insights and Forecast - By Country/Sub-region
- 15.1.1 United Arab Emirates
- 15.1.2 Saudi Arabia
- 15.1.3 Egypt
- 15.1.4 Qatar
- 15.1.5 Rest of Middle East and Africa
- 16. Competitive Analysis
- 16.1. Global Market Share Analysis 2024
- 16.2. Company Profiles
- 16.2.1 Lamperd Less Lethal
- 16.2.1.1. Overview
- 16.2.1.2. Products
- 16.2.1.3. SWOT Analysis
- 16.2.1.4. Recent Developments
- 16.2.1.5. Financials (Based on Availability)
- 16.2.2 RUAG International Holding Ltd
- 16.2.2.1. Overview
- 16.2.2.2. Products
- 16.2.2.3. SWOT Analysis
- 16.2.2.4. Recent Developments
- 16.2.2.5. Financials (Based on Availability)
- 16.2.3 ISPRA
- 16.2.3.1. Overview
- 16.2.3.2. Products
- 16.2.3.3. SWOT Analysis
- 16.2.3.4. Recent Developments
- 16.2.3.5. Financials (Based on Availability)
- 16.2.4 Combined Systems Inc (CSI)
- 16.2.4.1. Overview
- 16.2.4.2. Products
- 16.2.4.3. SWOT Analysis
- 16.2.4.4. Recent Developments
- 16.2.4.5. Financials (Based on Availability)
- 16.2.5 Rheinmetall AG
- 16.2.5.1. Overview
- 16.2.5.2. Products
- 16.2.5.3. SWOT Analysis
- 16.2.5.4. Recent Developments
- 16.2.5.5. Financials (Based on Availability)
- 16.2.6 Byrna Technologies Inc
- 16.2.6.1. Overview
- 16.2.6.2. Products
- 16.2.6.3. SWOT Analysis
- 16.2.6.4. Recent Developments
- 16.2.6.5. Financials (Based on Availability)
- 16.2.7 CONDOR TECNOLOGIAS Não LETALIS
- 16.2.7.1. Overview
- 16.2.7.2. Products
- 16.2.7.3. SWOT Analysis
- 16.2.7.4. Recent Developments
- 16.2.7.5. Financials (Based on Availability)
- 16.2.8 AMTEC Less-Lethal Systems Inc
- 16.2.8.1. Overview
- 16.2.8.2. Products
- 16.2.8.3. SWOT Analysis
- 16.2.8.4. Recent Developments
- 16.2.8.5. Financials (Based on Availability)
- 16.2.9 NonLethal Technologies Inc
- 16.2.9.1. Overview
- 16.2.9.2. Products
- 16.2.9.3. SWOT Analysis
- 16.2.9.4. Recent Developments
- 16.2.9.5. Financials (Based on Availability)
- 16.2.10 RTX Corporation
- 16.2.10.1. Overview
- 16.2.10.2. Products
- 16.2.10.3. SWOT Analysis
- 16.2.10.4. Recent Developments
- 16.2.10.5. Financials (Based on Availability)
- 16.2.11 Fiocchi Munizioni S p A
- 16.2.11.1. Overview
- 16.2.11.2. Products
- 16.2.11.3. SWOT Analysis
- 16.2.11.4. Recent Developments
- 16.2.11.5. Financials (Based on Availability)
- 16.2.12 Zarc International Inc
- 16.2.12.1. Overview
- 16.2.12.2. Products
- 16.2.12.3. SWOT Analysis
- 16.2.12.4. Recent Developments
- 16.2.12.5. Financials (Based on Availability)
- 16.2.13 Axon Enterprise Inc
- 16.2.13.1. Overview
- 16.2.13.2. Products
- 16.2.13.3. SWOT Analysis
- 16.2.13.4. Recent Developments
- 16.2.13.5. Financials (Based on Availability)
- 16.2.14 UTS United Tactical Systems LLC (Pepperball)
- 16.2.14.1. Overview
- 16.2.14.2. Products
- 16.2.14.3. SWOT Analysis
- 16.2.14.4. Recent Developments
- 16.2.14.5. Financials (Based on Availability)
- 16.2.15 Herstal Group
- 16.2.15.1. Overview
- 16.2.15.2. Products
- 16.2.15.3. SWOT Analysis
- 16.2.15.4. Recent Developments
- 16.2.15.5. Financials (Based on Availability)
- 16.2.16 Safariland LLC
- 16.2.16.1. Overview
- 16.2.16.2. Products
- 16.2.16.3. SWOT Analysis
- 16.2.16.4. Recent Developments
- 16.2.16.5. Financials (Based on Availability)
- 16.2.1 Lamperd Less Lethal
List of Figures
- Figure 1: Global Non-lethal Weapons Market Revenue Breakdown (Million, %) by Region 2024 & 2032
- Figure 2: North America Non-lethal Weapons Market Revenue (Million), by Country 2024 & 2032
- Figure 3: North America Non-lethal Weapons Market Revenue Share (%), by Country 2024 & 2032
- Figure 4: Europe Non-lethal Weapons Market Revenue (Million), by Country 2024 & 2032
- Figure 5: Europe Non-lethal Weapons Market Revenue Share (%), by Country 2024 & 2032
- Figure 6: Asia Pacific Non-lethal Weapons Market Revenue (Million), by Country 2024 & 2032
- Figure 7: Asia Pacific Non-lethal Weapons Market Revenue Share (%), by Country 2024 & 2032
- Figure 8: Latin America Non-lethal Weapons Market Revenue (Million), by Country 2024 & 2032
- Figure 9: Latin America Non-lethal Weapons Market Revenue Share (%), by Country 2024 & 2032
- Figure 10: Middle East and Africa Non-lethal Weapons Market Revenue (Million), by Country 2024 & 2032
- Figure 11: Middle East and Africa Non-lethal Weapons Market Revenue Share (%), by Country 2024 & 2032
- Figure 12: North America Non-lethal Weapons Market Revenue (Million), by Type 2024 & 2032
- Figure 13: North America Non-lethal Weapons Market Revenue Share (%), by Type 2024 & 2032
- Figure 14: North America Non-lethal Weapons Market Revenue (Million), by Application 2024 & 2032
- Figure 15: North America Non-lethal Weapons Market Revenue Share (%), by Application 2024 & 2032
- Figure 16: North America Non-lethal Weapons Market Revenue (Million), by Country 2024 & 2032
- Figure 17: North America Non-lethal Weapons Market Revenue Share (%), by Country 2024 & 2032
- Figure 18: Europe Non-lethal Weapons Market Revenue (Million), by Type 2024 & 2032
- Figure 19: Europe Non-lethal Weapons Market Revenue Share (%), by Type 2024 & 2032
- Figure 20: Europe Non-lethal Weapons Market Revenue (Million), by Application 2024 & 2032
- Figure 21: Europe Non-lethal Weapons Market Revenue Share (%), by Application 2024 & 2032
- Figure 22: Europe Non-lethal Weapons Market Revenue (Million), by Country 2024 & 2032
- Figure 23: Europe Non-lethal Weapons Market Revenue Share (%), by Country 2024 & 2032
- Figure 24: Asia Pacific Non-lethal Weapons Market Revenue (Million), by Type 2024 & 2032
- Figure 25: Asia Pacific Non-lethal Weapons Market Revenue Share (%), by Type 2024 & 2032
- Figure 26: Asia Pacific Non-lethal Weapons Market Revenue (Million), by Application 2024 & 2032
- Figure 27: Asia Pacific Non-lethal Weapons Market Revenue Share (%), by Application 2024 & 2032
- Figure 28: Asia Pacific Non-lethal Weapons Market Revenue (Million), by Country 2024 & 2032
- Figure 29: Asia Pacific Non-lethal Weapons Market Revenue Share (%), by Country 2024 & 2032
- Figure 30: Latin America Non-lethal Weapons Market Revenue (Million), by Type 2024 & 2032
- Figure 31: Latin America Non-lethal Weapons Market Revenue Share (%), by Type 2024 & 2032
- Figure 32: Latin America Non-lethal Weapons Market Revenue (Million), by Application 2024 & 2032
- Figure 33: Latin America Non-lethal Weapons Market Revenue Share (%), by Application 2024 & 2032
- Figure 34: Latin America Non-lethal Weapons Market Revenue (Million), by Country 2024 & 2032
- Figure 35: Latin America Non-lethal Weapons Market Revenue Share (%), by Country 2024 & 2032
- Figure 36: Middle East and Africa Non-lethal Weapons Market Revenue (Million), by Type 2024 & 2032
- Figure 37: Middle East and Africa Non-lethal Weapons Market Revenue Share (%), by Type 2024 & 2032
- Figure 38: Middle East and Africa Non-lethal Weapons Market Revenue (Million), by Application 2024 & 2032
- Figure 39: Middle East and Africa Non-lethal Weapons Market Revenue Share (%), by Application 2024 & 2032
- Figure 40: Middle East and Africa Non-lethal Weapons Market Revenue (Million), by Country 2024 & 2032
- Figure 41: Middle East and Africa Non-lethal Weapons Market Revenue Share (%), by Country 2024 & 2032
List of Tables
- Table 1: Global Non-lethal Weapons Market Revenue Million Forecast, by Region 2019 & 2032
- Table 2: Global Non-lethal Weapons Market Revenue Million Forecast, by Type 2019 & 2032
- Table 3: Global Non-lethal Weapons Market Revenue Million Forecast, by Application 2019 & 2032
- Table 4: Global Non-lethal Weapons Market Revenue Million Forecast, by Region 2019 & 2032
- Table 5: Global Non-lethal Weapons Market Revenue Million Forecast, by Country 2019 & 2032
- Table 6: United States Non-lethal Weapons Market Revenue (Million) Forecast, by Application 2019 & 2032
- Table 7: Canada Non-lethal Weapons Market Revenue (Million) Forecast, by Application 2019 & 2032
- Table 8: Global Non-lethal Weapons Market Revenue Million Forecast, by Country 2019 & 2032
- Table 9: United Kingdom Non-lethal Weapons Market Revenue (Million) Forecast, by Application 2019 & 2032
- Table 10: Germany Non-lethal Weapons Market Revenue (Million) Forecast, by Application 2019 & 2032
- Table 11: France Non-lethal Weapons Market Revenue (Million) Forecast, by Application 2019 & 2032
- Table 12: Rest of Europe Non-lethal Weapons Market Revenue (Million) Forecast, by Application 2019 & 2032
- Table 13: Global Non-lethal Weapons Market Revenue Million Forecast, by Country 2019 & 2032
- Table 14: China Non-lethal Weapons Market Revenue (Million) Forecast, by Application 2019 & 2032
- Table 15: India Non-lethal Weapons Market Revenue (Million) Forecast, by Application 2019 & 2032
- Table 16: Japan Non-lethal Weapons Market Revenue (Million) Forecast, by Application 2019 & 2032
- Table 17: South Korea Non-lethal Weapons Market Revenue (Million) Forecast, by Application 2019 & 2032
- Table 18: Rest of Asia Pacific Non-lethal Weapons Market Revenue (Million) Forecast, by Application 2019 & 2032
- Table 19: Global Non-lethal Weapons Market Revenue Million Forecast, by Country 2019 & 2032
- Table 20: Brazil Non-lethal Weapons Market Revenue (Million) Forecast, by Application 2019 & 2032
- Table 21: Mexico Non-lethal Weapons Market Revenue (Million) Forecast, by Application 2019 & 2032
- Table 22: Rest of Latin America Non-lethal Weapons Market Revenue (Million) Forecast, by Application 2019 & 2032
- Table 23: Global Non-lethal Weapons Market Revenue Million Forecast, by Country 2019 & 2032
- Table 24: United Arab Emirates Non-lethal Weapons Market Revenue (Million) Forecast, by Application 2019 & 2032
- Table 25: Saudi Arabia Non-lethal Weapons Market Revenue (Million) Forecast, by Application 2019 & 2032
- Table 26: Egypt Non-lethal Weapons Market Revenue (Million) Forecast, by Application 2019 & 2032
- Table 27: Qatar Non-lethal Weapons Market Revenue (Million) Forecast, by Application 2019 & 2032
- Table 28: Rest of Middle East and Africa Non-lethal Weapons Market Revenue (Million) Forecast, by Application 2019 & 2032
- Table 29: Global Non-lethal Weapons Market Revenue Million Forecast, by Type 2019 & 2032
- Table 30: Global Non-lethal Weapons Market Revenue Million Forecast, by Application 2019 & 2032
- Table 31: Global Non-lethal Weapons Market Revenue Million Forecast, by Country 2019 & 2032
- Table 32: United States Non-lethal Weapons Market Revenue (Million) Forecast, by Application 2019 & 2032
- Table 33: Canada Non-lethal Weapons Market Revenue (Million) Forecast, by Application 2019 & 2032
- Table 34: Global Non-lethal Weapons Market Revenue Million Forecast, by Type 2019 & 2032
- Table 35: Global Non-lethal Weapons Market Revenue Million Forecast, by Application 2019 & 2032
- Table 36: Global Non-lethal Weapons Market Revenue Million Forecast, by Country 2019 & 2032
- Table 37: United Kingdom Non-lethal Weapons Market Revenue (Million) Forecast, by Application 2019 & 2032
- Table 38: Germany Non-lethal Weapons Market Revenue (Million) Forecast, by Application 2019 & 2032
- Table 39: France Non-lethal Weapons Market Revenue (Million) Forecast, by Application 2019 & 2032
- Table 40: Rest of Europe Non-lethal Weapons Market Revenue (Million) Forecast, by Application 2019 & 2032
- Table 41: Global Non-lethal Weapons Market Revenue Million Forecast, by Type 2019 & 2032
- Table 42: Global Non-lethal Weapons Market Revenue Million Forecast, by Application 2019 & 2032
- Table 43: Global Non-lethal Weapons Market Revenue Million Forecast, by Country 2019 & 2032
- Table 44: China Non-lethal Weapons Market Revenue (Million) Forecast, by Application 2019 & 2032
- Table 45: India Non-lethal Weapons Market Revenue (Million) Forecast, by Application 2019 & 2032
- Table 46: Japan Non-lethal Weapons Market Revenue (Million) Forecast, by Application 2019 & 2032
- Table 47: South Korea Non-lethal Weapons Market Revenue (Million) Forecast, by Application 2019 & 2032
- Table 48: Rest of Asia Pacific Non-lethal Weapons Market Revenue (Million) Forecast, by Application 2019 & 2032
- Table 49: Global Non-lethal Weapons Market Revenue Million Forecast, by Type 2019 & 2032
- Table 50: Global Non-lethal Weapons Market Revenue Million Forecast, by Application 2019 & 2032
- Table 51: Global Non-lethal Weapons Market Revenue Million Forecast, by Country 2019 & 2032
- Table 52: Brazil Non-lethal Weapons Market Revenue (Million) Forecast, by Application 2019 & 2032
- Table 53: Mexico Non-lethal Weapons Market Revenue (Million) Forecast, by Application 2019 & 2032
- Table 54: Rest of Latin America Non-lethal Weapons Market Revenue (Million) Forecast, by Application 2019 & 2032
- Table 55: Global Non-lethal Weapons Market Revenue Million Forecast, by Type 2019 & 2032
- Table 56: Global Non-lethal Weapons Market Revenue Million Forecast, by Application 2019 & 2032
- Table 57: Global Non-lethal Weapons Market Revenue Million Forecast, by Country 2019 & 2032
- Table 58: United Arab Emirates Non-lethal Weapons Market Revenue (Million) Forecast, by Application 2019 & 2032
- Table 59: Saudi Arabia Non-lethal Weapons Market Revenue (Million) Forecast, by Application 2019 & 2032
- Table 60: Egypt Non-lethal Weapons Market Revenue (Million) Forecast, by Application 2019 & 2032
- Table 61: Qatar Non-lethal Weapons Market Revenue (Million) Forecast, by Application 2019 & 2032
- Table 62: Rest of Middle East and Africa Non-lethal Weapons Market Revenue (Million) Forecast, by Application 2019 & 2032
Frequently Asked Questions
1. What is the projected Compound Annual Growth Rate (CAGR) of the Non-lethal Weapons Market?
The projected CAGR is approximately 5.36%.
2. Which companies are prominent players in the Non-lethal Weapons Market?
Key companies in the market include Lamperd Less Lethal, RUAG International Holding Ltd, ISPRA, Combined Systems Inc (CSI), Rheinmetall AG, Byrna Technologies Inc, CONDOR TECNOLOGIAS Não LETALIS, AMTEC Less-Lethal Systems Inc, NonLethal Technologies Inc, RTX Corporation, Fiocchi Munizioni S p A, Zarc International Inc, Axon Enterprise Inc, UTS United Tactical Systems LLC (Pepperball), Herstal Group, Safariland LLC.
3. What are the main segments of the Non-lethal Weapons Market?
The market segments include Type, Application.
4. Can you provide details about the market size?
The market size is estimated to be USD 8.18 Million as of 2022.
5. What are some drivers contributing to market growth?
N/A
6. What are the notable trends driving market growth?
Military Segment is Anticipated to Grow with the Highest CAGR During the Forecast Period.
7. Are there any restraints impacting market growth?
N/A
8. Can you provide examples of recent developments in the market?
May 2023: The Republic of Singapore Navy's (RSN's) Sentinel-class maritime security and response vessels (MSRVs) announced that they are being equipped with Sitep Italia's multirole acoustic stabilized system (MASS). Moreover, the system will be installed across all four vessels in the Sentinel class.
9. What pricing options are available for accessing the report?
Pricing options include single-user, multi-user, and enterprise licenses priced at USD 4750, USD 5250, and USD 8750 respectively.
10. Is the market size provided in terms of value or volume?
The market size is provided in terms of value, measured in Million.
11. Are there any specific market keywords associated with the report?
Yes, the market keyword associated with the report is "Non-lethal Weapons Market," which aids in identifying and referencing the specific market segment covered.
12. How do I determine which pricing option suits my needs best?
The pricing options vary based on user requirements and access needs. Individual users may opt for single-user licenses, while businesses requiring broader access may choose multi-user or enterprise licenses for cost-effective access to the report.
13. Are there any additional resources or data provided in the Non-lethal Weapons Market report?
While the report offers comprehensive insights, it's advisable to review the specific contents or supplementary materials provided to ascertain if additional resources or data are available.
14. How can I stay updated on further developments or reports in the Non-lethal Weapons Market?
To stay informed about further developments, trends, and reports in the Non-lethal Weapons Market, consider subscribing to industry newsletters, following relevant companies and organizations, or regularly checking reputable industry news sources and publications.
Methodology
Step 1 - Identification of Relevant Samples Size from Population Database


Step 2 - Approaches for Defining Global Market Size (Value, Volume* & Price*)

Note*: In applicable scenarios
Step 3 - Data Sources
Primary Research
- Web Analytics
- Survey Reports
- Research Institute
- Latest Research Reports
- Opinion Leaders
Secondary Research
- Annual Reports
- White Paper
- Latest Press Release
- Industry Association
- Paid Database
- Investor Presentations

Step 4 - Data Triangulation
Involves using different sources of information in order to increase the validity of a study
These sources are likely to be stakeholders in a program - participants, other researchers, program staff, other community members, and so on.
Then we put all data in single framework & apply various statistical tools to find out the dynamic on the market.
During the analysis stage, feedback from the stakeholder groups would be compared to determine areas of agreement as well as areas of divergence
