

Key Insights
The network analytics market is experiencing robust growth, driven by the increasing complexity and volume of network traffic, the rise of cloud computing and the Internet of Things (IoT), and the critical need for enhanced cybersecurity. The market's Compound Annual Growth Rate (CAGR) of 20.12% from 2019 to 2024 indicates significant expansion, and this trajectory is expected to continue through 2033. Key market drivers include the imperative for organizations to optimize network performance, gain actionable insights from network data for improved decision-making, and proactively detect and mitigate security threats. The shift towards cloud-based deployments is a major trend, offering scalability and cost-effectiveness. However, challenges remain, including the complexity of integrating various network analytics tools and the high cost of implementation for some solutions, particularly in smaller organizations. The market is segmented by deployment (on-premise and on-cloud), type (network intelligence solutions and services), and end-user (cloud service providers, communication service providers, and enterprises). North America currently holds a substantial market share due to early adoption of advanced technologies and a strong presence of key players. However, the Asia-Pacific region is projected to exhibit the fastest growth in the coming years, fueled by rapid digitalization and increasing investment in infrastructure. Competitive landscape analysis reveals the presence of both established players like Cisco, IBM, and Juniper Networks, and specialized niche providers offering innovative solutions. The market's future hinges on the continued development of artificial intelligence (AI) and machine learning (ML) capabilities within network analytics platforms, enabling more precise threat detection and predictive network optimization.
The competitive landscape is dynamic, with established players alongside emerging specialized firms innovating in areas like AI-driven threat detection and predictive analytics. The market’s growth will be influenced by factors such as the increasing adoption of 5G technology, the expansion of edge computing, and the growing need for network visibility in distributed environments. Companies are focusing on developing solutions that offer enhanced security, improved performance, and better network management capabilities. The integration of network analytics with other IT management tools is also a key trend, allowing organizations to gain a holistic view of their IT infrastructure. The need for regulatory compliance and data privacy is driving the demand for robust and secure network analytics solutions, further fueling market expansion. The on-cloud segment is poised for significant growth, driven by its scalability, flexibility, and cost-effectiveness. The market is expected to witness continuous innovation in areas such as network traffic analysis, application performance monitoring, and security threat detection, leading to improved network efficiency and enhanced security postures. Continued investments in research and development and strategic partnerships are expected to shape the future of this rapidly evolving market.
Network Analytics Industry Market Report: A Comprehensive Analysis (2019-2033)
This comprehensive report provides an in-depth analysis of the Network Analytics industry, offering valuable insights for stakeholders, investors, and industry professionals. With a study period spanning 2019-2033, a base year of 2025, and a forecast period of 2025-2033, this report projects a market valued at xx Million by 2033, exhibiting a robust CAGR of xx%. This report leverages a blend of historical data (2019-2024) and future projections to offer a holistic perspective on market dynamics and growth potential.
Network Analytics Industry Market Dynamics & Concentration
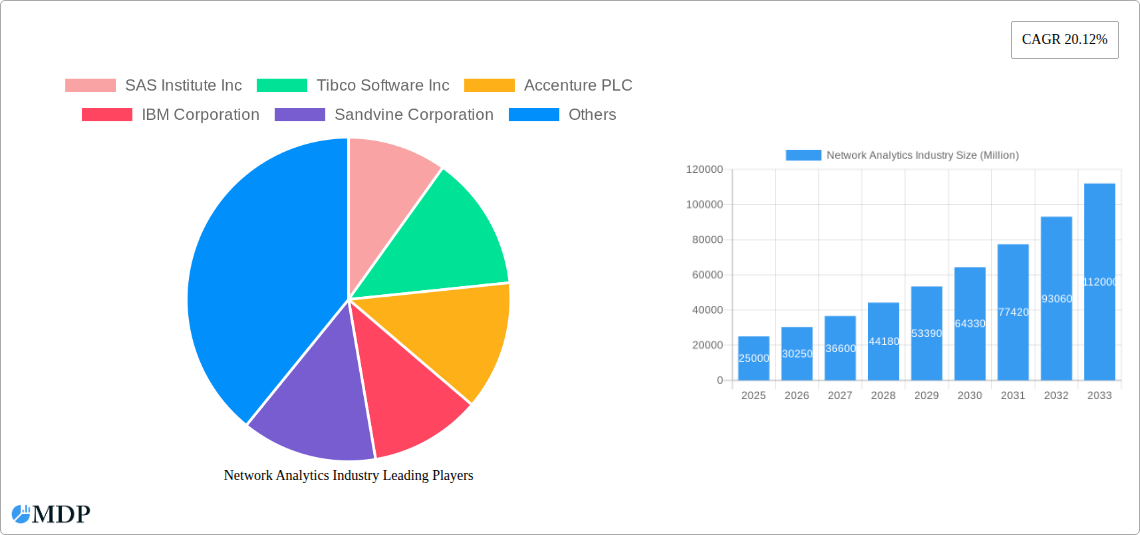
The Network Analytics market is characterized by a moderately concentrated landscape, with several key players holding significant market share. The top five companies – SAS Institute Inc, Tibco Software Inc, Accenture PLC, IBM Corporation, and Sandvine Corporation – collectively account for an estimated xx% of the global market in 2025. This concentration is driven by significant investments in R&D, strong brand recognition, and established customer bases.
Market innovation is fueled by advancements in artificial intelligence (AI), machine learning (ML), and big data analytics, enabling more sophisticated network monitoring and optimization. Regulatory frameworks, particularly concerning data privacy and security, are shaping market practices and influencing product development. The emergence of cloud-based solutions acts as a substitute for traditional on-premise deployments, driving market transformation. End-user trends reveal an increasing demand for real-time network visibility and predictive analytics capabilities to address evolving cybersecurity threats and optimize network performance.
Significant M&A activity has been observed in recent years, with xx deals recorded between 2019 and 2024, contributing to market consolidation and technological advancements. These acquisitions often involve companies specializing in niche technologies or geographic regions, expanding the capabilities and reach of larger players.
Network Analytics Industry Industry Trends & Analysis
The Network Analytics market is experiencing robust growth, driven by the exponential increase in network traffic, the rising adoption of cloud computing, and the growing need for enhanced network security. The market is witnessing a shift towards cloud-based solutions, driven by their scalability, cost-effectiveness, and ease of deployment. Consumer preferences are increasingly focused on user-friendly interfaces, comprehensive analytics dashboards, and proactive threat detection capabilities.
Technological disruptions, such as the proliferation of 5G networks and the Internet of Things (IoT), are creating new opportunities for network analytics providers. The increasing sophistication of cyberattacks is also driving demand for advanced security analytics solutions. Competitive dynamics are shaped by factors such as product innovation, pricing strategies, and strategic partnerships. The market's overall growth is expected to continue at a CAGR of xx% during the forecast period (2025-2033), with a market penetration rate projected to reach xx% by 2033.
Leading Markets & Segments in Network Analytics Industry
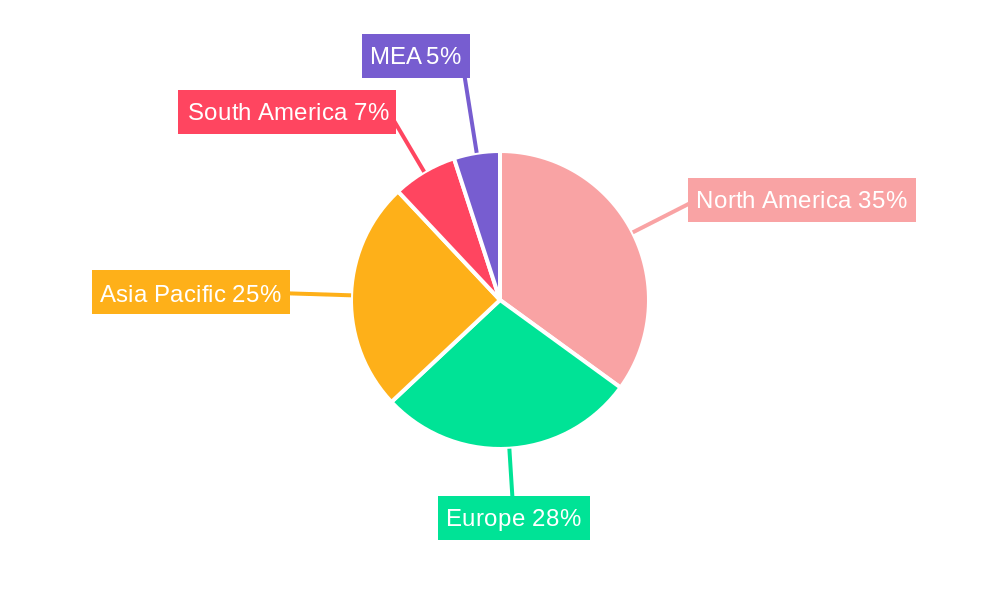
The North American region is currently the dominant market for Network Analytics, accounting for an estimated xx% of the global market share in 2025. This dominance is largely attributed to the high adoption of cloud-based solutions, robust IT infrastructure, and the presence of several major technology companies.
- Key Drivers in North America:
- Strong presence of major technology companies and established IT infrastructure.
- High adoption of cloud-based solutions.
- Stringent data privacy regulations driving demand for advanced security solutions.
The On-cloud deployment segment is experiencing the fastest growth, driven by the advantages of scalability, flexibility, and cost-efficiency. Within the Type segment, Network Intelligence Solutions holds the largest market share due to the increasing demand for comprehensive network visibility and performance optimization tools. Among End-Users, Communication Service Providers (CSPs) represent the largest segment, fueled by the need to manage and optimize their complex network infrastructure. The increasing adoption of 5G technology is further driving demand in this segment.
Network Analytics Industry Product Developments
Recent product innovations focus on integrating AI/ML capabilities for predictive analytics, advanced threat detection, and automated network optimization. These solutions offer competitive advantages by providing real-time insights, improved accuracy, and reduced operational costs. The market is witnessing a growing trend towards integrated platforms that combine network performance monitoring, security analytics, and application performance management. These integrated solutions provide a more holistic view of network operations, improving efficiency and reducing complexity.
Key Drivers of Network Analytics Industry Growth
The growth of the Network Analytics market is driven by several factors: the rapid expansion of network infrastructure, increasing data volumes, escalating cybersecurity threats, and stringent regulatory compliance requirements. The evolution of 5G technology is a key driver, generating substantial demand for advanced network monitoring and management capabilities. The rising adoption of cloud computing and IoT devices further fuels market expansion by generating massive amounts of data that need effective analysis and monitoring.
Challenges in the Network Analytics Industry Market
Key challenges include the complexity of integrating network analytics solutions with existing infrastructure, the high cost of implementation and maintenance, and the scarcity of skilled professionals capable of managing and interpreting complex data sets. Data privacy and security concerns also present significant hurdles, requiring vendors to comply with stringent regulations and implement robust data protection measures. Competition from established players and the emergence of new entrants create a dynamic and challenging market environment. These factors, while posing challenges, are also simultaneously creating opportunities for innovation and growth.
Emerging Opportunities in Network Analytics Industry
Significant opportunities exist in the integration of network analytics with emerging technologies such as AI, ML, and blockchain to enhance security and efficiency. Strategic partnerships between network analytics vendors and cloud service providers can unlock substantial growth potential. Market expansion into developing economies offers another significant avenue for growth, as these regions experience rapid infrastructure development and increasing digital adoption. The continued evolution of network technologies, like 5G and IoT, will further fuel demand for advanced network analytics solutions for years to come.
Leading Players in the Network Analytics Industry Sector
- SAS Institute Inc
- Tibco Software Inc
- Accenture PLC
- IBM Corporation
- Sandvine Corporation
- Hewlett Packard Enterprise Company
- Allot Communication
- Cisco Systems Inc
- Juniper Networks Inc
- Ericsson Inc
- Bradford Networks Inc
- Nokia Corporation
- Alcatel-Lucent Enterprise SA
Key Milestones in Network Analytics Industry Industry
October 2022: Oracle launched its Network Analytics Suite, a set of virtualized cloud infrastructure products designed to enhance 5G data center performance monitoring for Communication Service Providers (CSPs). This launch signals a significant advance in network monitoring capabilities for 5G environments.
June 2022: IBM's acquisition of Randori, an attack surface management (ASM) and offensive cybersecurity company, strengthened IBM's security analytics portfolio and expanded its capabilities in identifying and mitigating external cybersecurity threats. This acquisition highlights the growing importance of cybersecurity in the network analytics market.
Strategic Outlook for Network Analytics Industry Market
The future of the Network Analytics market is bright, characterized by sustained growth driven by technological advancements and evolving user needs. Strategic partnerships, product innovation, and expansion into new geographic markets will be key success factors. The continued integration of AI/ML capabilities will enable more sophisticated analytics and proactive threat management. Companies that can effectively adapt to evolving market dynamics and deliver innovative solutions will be best positioned to capture significant market share.
Network Analytics Industry Segmentation
-
1. Deployment
- 1.1. On-premise
- 1.2. On-cloud
-
2. Type
- 2.1. Network Intelligence Solutions
- 2.2. Services
-
3. End-User
- 3.1. Cloud Service Providers
- 3.2. Communication Service Providers
Network Analytics Industry Segmentation By Geography
-
1. North America
- 1.1. United States
- 1.2. Canada
-
2. Europe
- 2.1. United Kingdom
- 2.2. Rest of Europe
-
3. Asia Pacific
- 3.1. China
- 3.2. Japan
- 3.3. India
- 3.4. Australia and New Zealand
- 3.5. Rest of Asia Pacific
-
4. Latin America
- 4.1. Brazil
- 4.2. Mexico
- 4.3. Rest of Latin America
-
5. Middle East and Africa
- 5.1. Middle East
- 5.2. Africa
Network Analytics Industry REPORT HIGHLIGHTS
| Aspects | Details |
|---|---|
| Study Period | 2019-2033 |
| Base Year | 2024 |
| Estimated Year | 2025 |
| Forecast Period | 2025-2033 |
| Historical Period | 2019-2024 |
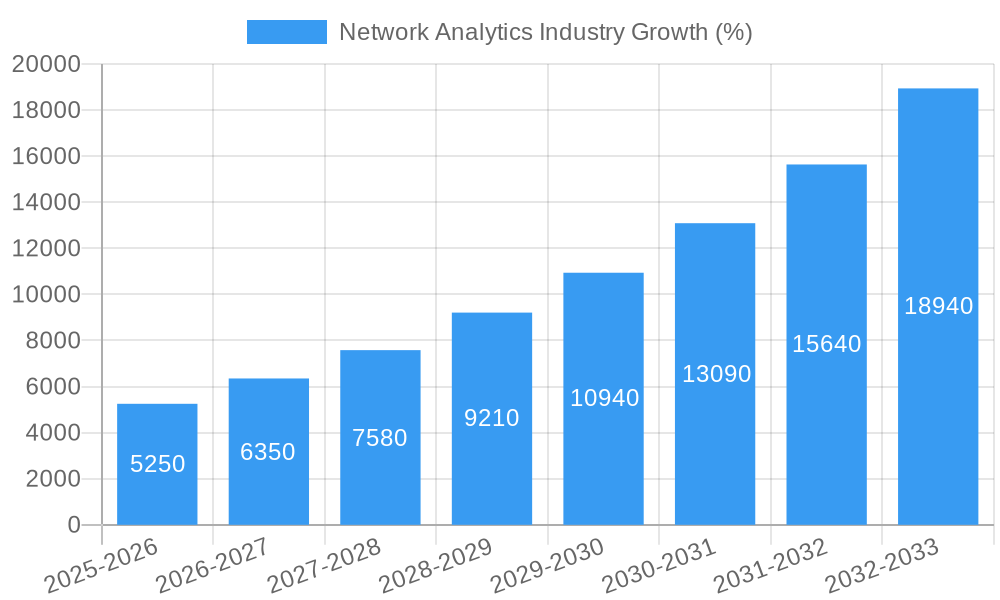
| Growth Rate | CAGR of 20.12% from 2019-2033 |
| Segmentation |
|
Table of Contents
- 1. Introduction
- 1.1. Research Scope
- 1.2. Market Segmentation
- 1.3. Research Methodology
- 1.4. Definitions and Assumptions
- 2. Executive Summary
- 2.1. Introduction
- 3. Market Dynamics
- 3.1. Introduction
- 3.2. Market Drivers
- 3.2.1. Need for Autonomous and Self-managing Networks; Rise of IoT and Machine-to-machine Communications; Need for Improved Network Reliability and Elimination of Costly Disruptions
- 3.3. Market Restrains
- 3.3.1. High Initial Costs and Low ROI; Design and Upgradation of Platforms
- 3.4. Market Trends
- 3.4.1. Communication Service Providers Segment is Expected to Witness a Significant Growth
- 4. Market Factor Analysis
- 4.1. Porters Five Forces
- 4.2. Supply/Value Chain
- 4.3. PESTEL analysis
- 4.4. Market Entropy
- 4.5. Patent/Trademark Analysis
- 5. Global Network Analytics Industry Analysis, Insights and Forecast, 2019-2031
- 5.1. Market Analysis, Insights and Forecast - by Deployment
- 5.1.1. On-premise
- 5.1.2. On-cloud
- 5.2. Market Analysis, Insights and Forecast - by Type
- 5.2.1. Network Intelligence Solutions
- 5.2.2. Services
- 5.3. Market Analysis, Insights and Forecast - by End-User
- 5.3.1. Cloud Service Providers
- 5.3.2. Communication Service Providers
- 5.4. Market Analysis, Insights and Forecast - by Region
- 5.4.1. North America
- 5.4.2. Europe
- 5.4.3. Asia Pacific
- 5.4.4. Latin America
- 5.4.5. Middle East and Africa
- 5.1. Market Analysis, Insights and Forecast - by Deployment
- 6. North America Network Analytics Industry Analysis, Insights and Forecast, 2019-2031
- 6.1. Market Analysis, Insights and Forecast - by Deployment
- 6.1.1. On-premise
- 6.1.2. On-cloud
- 6.2. Market Analysis, Insights and Forecast - by Type
- 6.2.1. Network Intelligence Solutions
- 6.2.2. Services
- 6.3. Market Analysis, Insights and Forecast - by End-User
- 6.3.1. Cloud Service Providers
- 6.3.2. Communication Service Providers
- 6.1. Market Analysis, Insights and Forecast - by Deployment
- 7. Europe Network Analytics Industry Analysis, Insights and Forecast, 2019-2031
- 7.1. Market Analysis, Insights and Forecast - by Deployment
- 7.1.1. On-premise
- 7.1.2. On-cloud
- 7.2. Market Analysis, Insights and Forecast - by Type
- 7.2.1. Network Intelligence Solutions
- 7.2.2. Services
- 7.3. Market Analysis, Insights and Forecast - by End-User
- 7.3.1. Cloud Service Providers
- 7.3.2. Communication Service Providers
- 7.1. Market Analysis, Insights and Forecast - by Deployment
- 8. Asia Pacific Network Analytics Industry Analysis, Insights and Forecast, 2019-2031
- 8.1. Market Analysis, Insights and Forecast - by Deployment
- 8.1.1. On-premise
- 8.1.2. On-cloud
- 8.2. Market Analysis, Insights and Forecast - by Type
- 8.2.1. Network Intelligence Solutions
- 8.2.2. Services
- 8.3. Market Analysis, Insights and Forecast - by End-User
- 8.3.1. Cloud Service Providers
- 8.3.2. Communication Service Providers
- 8.1. Market Analysis, Insights and Forecast - by Deployment
- 9. Latin America Network Analytics Industry Analysis, Insights and Forecast, 2019-2031
- 9.1. Market Analysis, Insights and Forecast - by Deployment
- 9.1.1. On-premise
- 9.1.2. On-cloud
- 9.2. Market Analysis, Insights and Forecast - by Type
- 9.2.1. Network Intelligence Solutions
- 9.2.2. Services
- 9.3. Market Analysis, Insights and Forecast - by End-User
- 9.3.1. Cloud Service Providers
- 9.3.2. Communication Service Providers
- 9.1. Market Analysis, Insights and Forecast - by Deployment
- 10. Middle East and Africa Network Analytics Industry Analysis, Insights and Forecast, 2019-2031
- 10.1. Market Analysis, Insights and Forecast - by Deployment
- 10.1.1. On-premise
- 10.1.2. On-cloud
- 10.2. Market Analysis, Insights and Forecast - by Type
- 10.2.1. Network Intelligence Solutions
- 10.2.2. Services
- 10.3. Market Analysis, Insights and Forecast - by End-User
- 10.3.1. Cloud Service Providers
- 10.3.2. Communication Service Providers
- 10.1. Market Analysis, Insights and Forecast - by Deployment
- 11. North America Network Analytics Industry Analysis, Insights and Forecast, 2019-2031
- 11.1. Market Analysis, Insights and Forecast - By Country/Sub-region
- 11.1.1 United States
- 11.1.2 Canada
- 11.1.3 Mexico
- 12. Europe Network Analytics Industry Analysis, Insights and Forecast, 2019-2031
- 12.1. Market Analysis, Insights and Forecast - By Country/Sub-region
- 12.1.1 Germany
- 12.1.2 United Kingdom
- 12.1.3 France
- 12.1.4 Spain
- 12.1.5 Italy
- 12.1.6 Spain
- 12.1.7 Belgium
- 12.1.8 Netherland
- 12.1.9 Nordics
- 12.1.10 Rest of Europe
- 13. Asia Pacific Network Analytics Industry Analysis, Insights and Forecast, 2019-2031
- 13.1. Market Analysis, Insights and Forecast - By Country/Sub-region
- 13.1.1 China
- 13.1.2 Japan
- 13.1.3 India
- 13.1.4 South Korea
- 13.1.5 Southeast Asia
- 13.1.6 Australia
- 13.1.7 Indonesia
- 13.1.8 Phillipes
- 13.1.9 Singapore
- 13.1.10 Thailandc
- 13.1.11 Rest of Asia Pacific
- 14. South America Network Analytics Industry Analysis, Insights and Forecast, 2019-2031
- 14.1. Market Analysis, Insights and Forecast - By Country/Sub-region
- 14.1.1 Brazil
- 14.1.2 Argentina
- 14.1.3 Peru
- 14.1.4 Chile
- 14.1.5 Colombia
- 14.1.6 Ecuador
- 14.1.7 Venezuela
- 14.1.8 Rest of South America
- 15. North America Network Analytics Industry Analysis, Insights and Forecast, 2019-2031
- 15.1. Market Analysis, Insights and Forecast - By Country/Sub-region
- 15.1.1 United States
- 15.1.2 Canada
- 15.1.3 Mexico
- 16. MEA Network Analytics Industry Analysis, Insights and Forecast, 2019-2031
- 16.1. Market Analysis, Insights and Forecast - By Country/Sub-region
- 16.1.1 United Arab Emirates
- 16.1.2 Saudi Arabia
- 16.1.3 South Africa
- 16.1.4 Rest of Middle East and Africa
- 17. Competitive Analysis
- 17.1. Global Market Share Analysis 2024
- 17.2. Company Profiles
- 17.2.1 SAS Institute Inc
- 17.2.1.1. Overview
- 17.2.1.2. Products
- 17.2.1.3. SWOT Analysis
- 17.2.1.4. Recent Developments
- 17.2.1.5. Financials (Based on Availability)
- 17.2.2 Tibco Software Inc
- 17.2.2.1. Overview
- 17.2.2.2. Products
- 17.2.2.3. SWOT Analysis
- 17.2.2.4. Recent Developments
- 17.2.2.5. Financials (Based on Availability)
- 17.2.3 Accenture PLC
- 17.2.3.1. Overview
- 17.2.3.2. Products
- 17.2.3.3. SWOT Analysis
- 17.2.3.4. Recent Developments
- 17.2.3.5. Financials (Based on Availability)
- 17.2.4 IBM Corporation
- 17.2.4.1. Overview
- 17.2.4.2. Products
- 17.2.4.3. SWOT Analysis
- 17.2.4.4. Recent Developments
- 17.2.4.5. Financials (Based on Availability)
- 17.2.5 Sandvine Corporation
- 17.2.5.1. Overview
- 17.2.5.2. Products
- 17.2.5.3. SWOT Analysis
- 17.2.5.4. Recent Developments
- 17.2.5.5. Financials (Based on Availability)
- 17.2.6 Hewlett Packard Enterprise Company
- 17.2.6.1. Overview
- 17.2.6.2. Products
- 17.2.6.3. SWOT Analysis
- 17.2.6.4. Recent Developments
- 17.2.6.5. Financials (Based on Availability)
- 17.2.7 Allot Communication
- 17.2.7.1. Overview
- 17.2.7.2. Products
- 17.2.7.3. SWOT Analysis
- 17.2.7.4. Recent Developments
- 17.2.7.5. Financials (Based on Availability)
- 17.2.8 Cisco Systems Inc
- 17.2.8.1. Overview
- 17.2.8.2. Products
- 17.2.8.3. SWOT Analysis
- 17.2.8.4. Recent Developments
- 17.2.8.5. Financials (Based on Availability)
- 17.2.9 Juniper Networks Inc
- 17.2.9.1. Overview
- 17.2.9.2. Products
- 17.2.9.3. SWOT Analysis
- 17.2.9.4. Recent Developments
- 17.2.9.5. Financials (Based on Availability)
- 17.2.10 Ericsson Inc
- 17.2.10.1. Overview
- 17.2.10.2. Products
- 17.2.10.3. SWOT Analysis
- 17.2.10.4. Recent Developments
- 17.2.10.5. Financials (Based on Availability)
- 17.2.11 Bradford Networks Inc
- 17.2.11.1. Overview
- 17.2.11.2. Products
- 17.2.11.3. SWOT Analysis
- 17.2.11.4. Recent Developments
- 17.2.11.5. Financials (Based on Availability)
- 17.2.12 Nokia Corporation
- 17.2.12.1. Overview
- 17.2.12.2. Products
- 17.2.12.3. SWOT Analysis
- 17.2.12.4. Recent Developments
- 17.2.12.5. Financials (Based on Availability)
- 17.2.13 Alcatel-Lucent Enterprise SA
- 17.2.13.1. Overview
- 17.2.13.2. Products
- 17.2.13.3. SWOT Analysis
- 17.2.13.4. Recent Developments
- 17.2.13.5. Financials (Based on Availability)
- 17.2.1 SAS Institute Inc
List of Figures
- Figure 1: Global Network Analytics Industry Revenue Breakdown (Million, %) by Region 2024 & 2032
- Figure 2: Global Network Analytics Industry Volume Breakdown (K Unit, %) by Region 2024 & 2032
- Figure 3: North America Network Analytics Industry Revenue (Million), by Country 2024 & 2032
- Figure 4: North America Network Analytics Industry Volume (K Unit), by Country 2024 & 2032
- Figure 5: North America Network Analytics Industry Revenue Share (%), by Country 2024 & 2032
- Figure 6: North America Network Analytics Industry Volume Share (%), by Country 2024 & 2032
- Figure 7: Europe Network Analytics Industry Revenue (Million), by Country 2024 & 2032
- Figure 8: Europe Network Analytics Industry Volume (K Unit), by Country 2024 & 2032
- Figure 9: Europe Network Analytics Industry Revenue Share (%), by Country 2024 & 2032
- Figure 10: Europe Network Analytics Industry Volume Share (%), by Country 2024 & 2032
- Figure 11: Asia Pacific Network Analytics Industry Revenue (Million), by Country 2024 & 2032
- Figure 12: Asia Pacific Network Analytics Industry Volume (K Unit), by Country 2024 & 2032
- Figure 13: Asia Pacific Network Analytics Industry Revenue Share (%), by Country 2024 & 2032
- Figure 14: Asia Pacific Network Analytics Industry Volume Share (%), by Country 2024 & 2032
- Figure 15: South America Network Analytics Industry Revenue (Million), by Country 2024 & 2032
- Figure 16: South America Network Analytics Industry Volume (K Unit), by Country 2024 & 2032
- Figure 17: South America Network Analytics Industry Revenue Share (%), by Country 2024 & 2032
- Figure 18: South America Network Analytics Industry Volume Share (%), by Country 2024 & 2032
- Figure 19: North America Network Analytics Industry Revenue (Million), by Country 2024 & 2032
- Figure 20: North America Network Analytics Industry Volume (K Unit), by Country 2024 & 2032
- Figure 21: North America Network Analytics Industry Revenue Share (%), by Country 2024 & 2032
- Figure 22: North America Network Analytics Industry Volume Share (%), by Country 2024 & 2032
- Figure 23: MEA Network Analytics Industry Revenue (Million), by Country 2024 & 2032
- Figure 24: MEA Network Analytics Industry Volume (K Unit), by Country 2024 & 2032
- Figure 25: MEA Network Analytics Industry Revenue Share (%), by Country 2024 & 2032
- Figure 26: MEA Network Analytics Industry Volume Share (%), by Country 2024 & 2032
- Figure 27: North America Network Analytics Industry Revenue (Million), by Deployment 2024 & 2032
- Figure 28: North America Network Analytics Industry Volume (K Unit), by Deployment 2024 & 2032
- Figure 29: North America Network Analytics Industry Revenue Share (%), by Deployment 2024 & 2032
- Figure 30: North America Network Analytics Industry Volume Share (%), by Deployment 2024 & 2032
- Figure 31: North America Network Analytics Industry Revenue (Million), by Type 2024 & 2032
- Figure 32: North America Network Analytics Industry Volume (K Unit), by Type 2024 & 2032
- Figure 33: North America Network Analytics Industry Revenue Share (%), by Type 2024 & 2032
- Figure 34: North America Network Analytics Industry Volume Share (%), by Type 2024 & 2032
- Figure 35: North America Network Analytics Industry Revenue (Million), by End-User 2024 & 2032
- Figure 36: North America Network Analytics Industry Volume (K Unit), by End-User 2024 & 2032
- Figure 37: North America Network Analytics Industry Revenue Share (%), by End-User 2024 & 2032
- Figure 38: North America Network Analytics Industry Volume Share (%), by End-User 2024 & 2032
- Figure 39: North America Network Analytics Industry Revenue (Million), by Country 2024 & 2032
- Figure 40: North America Network Analytics Industry Volume (K Unit), by Country 2024 & 2032
- Figure 41: North America Network Analytics Industry Revenue Share (%), by Country 2024 & 2032
- Figure 42: North America Network Analytics Industry Volume Share (%), by Country 2024 & 2032
- Figure 43: Europe Network Analytics Industry Revenue (Million), by Deployment 2024 & 2032
- Figure 44: Europe Network Analytics Industry Volume (K Unit), by Deployment 2024 & 2032
- Figure 45: Europe Network Analytics Industry Revenue Share (%), by Deployment 2024 & 2032
- Figure 46: Europe Network Analytics Industry Volume Share (%), by Deployment 2024 & 2032
- Figure 47: Europe Network Analytics Industry Revenue (Million), by Type 2024 & 2032
- Figure 48: Europe Network Analytics Industry Volume (K Unit), by Type 2024 & 2032
- Figure 49: Europe Network Analytics Industry Revenue Share (%), by Type 2024 & 2032
- Figure 50: Europe Network Analytics Industry Volume Share (%), by Type 2024 & 2032
- Figure 51: Europe Network Analytics Industry Revenue (Million), by End-User 2024 & 2032
- Figure 52: Europe Network Analytics Industry Volume (K Unit), by End-User 2024 & 2032
- Figure 53: Europe Network Analytics Industry Revenue Share (%), by End-User 2024 & 2032
- Figure 54: Europe Network Analytics Industry Volume Share (%), by End-User 2024 & 2032
- Figure 55: Europe Network Analytics Industry Revenue (Million), by Country 2024 & 2032
- Figure 56: Europe Network Analytics Industry Volume (K Unit), by Country 2024 & 2032
- Figure 57: Europe Network Analytics Industry Revenue Share (%), by Country 2024 & 2032
- Figure 58: Europe Network Analytics Industry Volume Share (%), by Country 2024 & 2032
- Figure 59: Asia Pacific Network Analytics Industry Revenue (Million), by Deployment 2024 & 2032
- Figure 60: Asia Pacific Network Analytics Industry Volume (K Unit), by Deployment 2024 & 2032
- Figure 61: Asia Pacific Network Analytics Industry Revenue Share (%), by Deployment 2024 & 2032
- Figure 62: Asia Pacific Network Analytics Industry Volume Share (%), by Deployment 2024 & 2032
- Figure 63: Asia Pacific Network Analytics Industry Revenue (Million), by Type 2024 & 2032
- Figure 64: Asia Pacific Network Analytics Industry Volume (K Unit), by Type 2024 & 2032
- Figure 65: Asia Pacific Network Analytics Industry Revenue Share (%), by Type 2024 & 2032
- Figure 66: Asia Pacific Network Analytics Industry Volume Share (%), by Type 2024 & 2032
- Figure 67: Asia Pacific Network Analytics Industry Revenue (Million), by End-User 2024 & 2032
- Figure 68: Asia Pacific Network Analytics Industry Volume (K Unit), by End-User 2024 & 2032
- Figure 69: Asia Pacific Network Analytics Industry Revenue Share (%), by End-User 2024 & 2032
- Figure 70: Asia Pacific Network Analytics Industry Volume Share (%), by End-User 2024 & 2032
- Figure 71: Asia Pacific Network Analytics Industry Revenue (Million), by Country 2024 & 2032
- Figure 72: Asia Pacific Network Analytics Industry Volume (K Unit), by Country 2024 & 2032
- Figure 73: Asia Pacific Network Analytics Industry Revenue Share (%), by Country 2024 & 2032
- Figure 74: Asia Pacific Network Analytics Industry Volume Share (%), by Country 2024 & 2032
- Figure 75: Latin America Network Analytics Industry Revenue (Million), by Deployment 2024 & 2032
- Figure 76: Latin America Network Analytics Industry Volume (K Unit), by Deployment 2024 & 2032
- Figure 77: Latin America Network Analytics Industry Revenue Share (%), by Deployment 2024 & 2032
- Figure 78: Latin America Network Analytics Industry Volume Share (%), by Deployment 2024 & 2032
- Figure 79: Latin America Network Analytics Industry Revenue (Million), by Type 2024 & 2032
- Figure 80: Latin America Network Analytics Industry Volume (K Unit), by Type 2024 & 2032
- Figure 81: Latin America Network Analytics Industry Revenue Share (%), by Type 2024 & 2032
- Figure 82: Latin America Network Analytics Industry Volume Share (%), by Type 2024 & 2032
- Figure 83: Latin America Network Analytics Industry Revenue (Million), by End-User 2024 & 2032
- Figure 84: Latin America Network Analytics Industry Volume (K Unit), by End-User 2024 & 2032
- Figure 85: Latin America Network Analytics Industry Revenue Share (%), by End-User 2024 & 2032
- Figure 86: Latin America Network Analytics Industry Volume Share (%), by End-User 2024 & 2032
- Figure 87: Latin America Network Analytics Industry Revenue (Million), by Country 2024 & 2032
- Figure 88: Latin America Network Analytics Industry Volume (K Unit), by Country 2024 & 2032
- Figure 89: Latin America Network Analytics Industry Revenue Share (%), by Country 2024 & 2032
- Figure 90: Latin America Network Analytics Industry Volume Share (%), by Country 2024 & 2032
- Figure 91: Middle East and Africa Network Analytics Industry Revenue (Million), by Deployment 2024 & 2032
- Figure 92: Middle East and Africa Network Analytics Industry Volume (K Unit), by Deployment 2024 & 2032
- Figure 93: Middle East and Africa Network Analytics Industry Revenue Share (%), by Deployment 2024 & 2032
- Figure 94: Middle East and Africa Network Analytics Industry Volume Share (%), by Deployment 2024 & 2032
- Figure 95: Middle East and Africa Network Analytics Industry Revenue (Million), by Type 2024 & 2032
- Figure 96: Middle East and Africa Network Analytics Industry Volume (K Unit), by Type 2024 & 2032
- Figure 97: Middle East and Africa Network Analytics Industry Revenue Share (%), by Type 2024 & 2032
- Figure 98: Middle East and Africa Network Analytics Industry Volume Share (%), by Type 2024 & 2032
- Figure 99: Middle East and Africa Network Analytics Industry Revenue (Million), by End-User 2024 & 2032
- Figure 100: Middle East and Africa Network Analytics Industry Volume (K Unit), by End-User 2024 & 2032
- Figure 101: Middle East and Africa Network Analytics Industry Revenue Share (%), by End-User 2024 & 2032
- Figure 102: Middle East and Africa Network Analytics Industry Volume Share (%), by End-User 2024 & 2032
- Figure 103: Middle East and Africa Network Analytics Industry Revenue (Million), by Country 2024 & 2032
- Figure 104: Middle East and Africa Network Analytics Industry Volume (K Unit), by Country 2024 & 2032
- Figure 105: Middle East and Africa Network Analytics Industry Revenue Share (%), by Country 2024 & 2032
- Figure 106: Middle East and Africa Network Analytics Industry Volume Share (%), by Country 2024 & 2032
List of Tables
- Table 1: Global Network Analytics Industry Revenue Million Forecast, by Region 2019 & 2032
- Table 2: Global Network Analytics Industry Volume K Unit Forecast, by Region 2019 & 2032
- Table 3: Global Network Analytics Industry Revenue Million Forecast, by Deployment 2019 & 2032
- Table 4: Global Network Analytics Industry Volume K Unit Forecast, by Deployment 2019 & 2032
- Table 5: Global Network Analytics Industry Revenue Million Forecast, by Type 2019 & 2032
- Table 6: Global Network Analytics Industry Volume K Unit Forecast, by Type 2019 & 2032
- Table 7: Global Network Analytics Industry Revenue Million Forecast, by End-User 2019 & 2032
- Table 8: Global Network Analytics Industry Volume K Unit Forecast, by End-User 2019 & 2032
- Table 9: Global Network Analytics Industry Revenue Million Forecast, by Region 2019 & 2032
- Table 10: Global Network Analytics Industry Volume K Unit Forecast, by Region 2019 & 2032
- Table 11: Global Network Analytics Industry Revenue Million Forecast, by Country 2019 & 2032
- Table 12: Global Network Analytics Industry Volume K Unit Forecast, by Country 2019 & 2032
- Table 13: United States Network Analytics Industry Revenue (Million) Forecast, by Application 2019 & 2032
- Table 14: United States Network Analytics Industry Volume (K Unit) Forecast, by Application 2019 & 2032
- Table 15: Canada Network Analytics Industry Revenue (Million) Forecast, by Application 2019 & 2032
- Table 16: Canada Network Analytics Industry Volume (K Unit) Forecast, by Application 2019 & 2032
- Table 17: Mexico Network Analytics Industry Revenue (Million) Forecast, by Application 2019 & 2032
- Table 18: Mexico Network Analytics Industry Volume (K Unit) Forecast, by Application 2019 & 2032
- Table 19: Global Network Analytics Industry Revenue Million Forecast, by Country 2019 & 2032
- Table 20: Global Network Analytics Industry Volume K Unit Forecast, by Country 2019 & 2032
- Table 21: Germany Network Analytics Industry Revenue (Million) Forecast, by Application 2019 & 2032
- Table 22: Germany Network Analytics Industry Volume (K Unit) Forecast, by Application 2019 & 2032
- Table 23: United Kingdom Network Analytics Industry Revenue (Million) Forecast, by Application 2019 & 2032
- Table 24: United Kingdom Network Analytics Industry Volume (K Unit) Forecast, by Application 2019 & 2032
- Table 25: France Network Analytics Industry Revenue (Million) Forecast, by Application 2019 & 2032
- Table 26: France Network Analytics Industry Volume (K Unit) Forecast, by Application 2019 & 2032
- Table 27: Spain Network Analytics Industry Revenue (Million) Forecast, by Application 2019 & 2032
- Table 28: Spain Network Analytics Industry Volume (K Unit) Forecast, by Application 2019 & 2032
- Table 29: Italy Network Analytics Industry Revenue (Million) Forecast, by Application 2019 & 2032
- Table 30: Italy Network Analytics Industry Volume (K Unit) Forecast, by Application 2019 & 2032
- Table 31: Spain Network Analytics Industry Revenue (Million) Forecast, by Application 2019 & 2032
- Table 32: Spain Network Analytics Industry Volume (K Unit) Forecast, by Application 2019 & 2032
- Table 33: Belgium Network Analytics Industry Revenue (Million) Forecast, by Application 2019 & 2032
- Table 34: Belgium Network Analytics Industry Volume (K Unit) Forecast, by Application 2019 & 2032
- Table 35: Netherland Network Analytics Industry Revenue (Million) Forecast, by Application 2019 & 2032
- Table 36: Netherland Network Analytics Industry Volume (K Unit) Forecast, by Application 2019 & 2032
- Table 37: Nordics Network Analytics Industry Revenue (Million) Forecast, by Application 2019 & 2032
- Table 38: Nordics Network Analytics Industry Volume (K Unit) Forecast, by Application 2019 & 2032
- Table 39: Rest of Europe Network Analytics Industry Revenue (Million) Forecast, by Application 2019 & 2032
- Table 40: Rest of Europe Network Analytics Industry Volume (K Unit) Forecast, by Application 2019 & 2032
- Table 41: Global Network Analytics Industry Revenue Million Forecast, by Country 2019 & 2032
- Table 42: Global Network Analytics Industry Volume K Unit Forecast, by Country 2019 & 2032
- Table 43: China Network Analytics Industry Revenue (Million) Forecast, by Application 2019 & 2032
- Table 44: China Network Analytics Industry Volume (K Unit) Forecast, by Application 2019 & 2032
- Table 45: Japan Network Analytics Industry Revenue (Million) Forecast, by Application 2019 & 2032
- Table 46: Japan Network Analytics Industry Volume (K Unit) Forecast, by Application 2019 & 2032
- Table 47: India Network Analytics Industry Revenue (Million) Forecast, by Application 2019 & 2032
- Table 48: India Network Analytics Industry Volume (K Unit) Forecast, by Application 2019 & 2032
- Table 49: South Korea Network Analytics Industry Revenue (Million) Forecast, by Application 2019 & 2032
- Table 50: South Korea Network Analytics Industry Volume (K Unit) Forecast, by Application 2019 & 2032
- Table 51: Southeast Asia Network Analytics Industry Revenue (Million) Forecast, by Application 2019 & 2032
- Table 52: Southeast Asia Network Analytics Industry Volume (K Unit) Forecast, by Application 2019 & 2032
- Table 53: Australia Network Analytics Industry Revenue (Million) Forecast, by Application 2019 & 2032
- Table 54: Australia Network Analytics Industry Volume (K Unit) Forecast, by Application 2019 & 2032
- Table 55: Indonesia Network Analytics Industry Revenue (Million) Forecast, by Application 2019 & 2032
- Table 56: Indonesia Network Analytics Industry Volume (K Unit) Forecast, by Application 2019 & 2032
- Table 57: Phillipes Network Analytics Industry Revenue (Million) Forecast, by Application 2019 & 2032
- Table 58: Phillipes Network Analytics Industry Volume (K Unit) Forecast, by Application 2019 & 2032
- Table 59: Singapore Network Analytics Industry Revenue (Million) Forecast, by Application 2019 & 2032
- Table 60: Singapore Network Analytics Industry Volume (K Unit) Forecast, by Application 2019 & 2032
- Table 61: Thailandc Network Analytics Industry Revenue (Million) Forecast, by Application 2019 & 2032
- Table 62: Thailandc Network Analytics Industry Volume (K Unit) Forecast, by Application 2019 & 2032
- Table 63: Rest of Asia Pacific Network Analytics Industry Revenue (Million) Forecast, by Application 2019 & 2032
- Table 64: Rest of Asia Pacific Network Analytics Industry Volume (K Unit) Forecast, by Application 2019 & 2032
- Table 65: Global Network Analytics Industry Revenue Million Forecast, by Country 2019 & 2032
- Table 66: Global Network Analytics Industry Volume K Unit Forecast, by Country 2019 & 2032
- Table 67: Brazil Network Analytics Industry Revenue (Million) Forecast, by Application 2019 & 2032
- Table 68: Brazil Network Analytics Industry Volume (K Unit) Forecast, by Application 2019 & 2032
- Table 69: Argentina Network Analytics Industry Revenue (Million) Forecast, by Application 2019 & 2032
- Table 70: Argentina Network Analytics Industry Volume (K Unit) Forecast, by Application 2019 & 2032
- Table 71: Peru Network Analytics Industry Revenue (Million) Forecast, by Application 2019 & 2032
- Table 72: Peru Network Analytics Industry Volume (K Unit) Forecast, by Application 2019 & 2032
- Table 73: Chile Network Analytics Industry Revenue (Million) Forecast, by Application 2019 & 2032
- Table 74: Chile Network Analytics Industry Volume (K Unit) Forecast, by Application 2019 & 2032
- Table 75: Colombia Network Analytics Industry Revenue (Million) Forecast, by Application 2019 & 2032
- Table 76: Colombia Network Analytics Industry Volume (K Unit) Forecast, by Application 2019 & 2032
- Table 77: Ecuador Network Analytics Industry Revenue (Million) Forecast, by Application 2019 & 2032
- Table 78: Ecuador Network Analytics Industry Volume (K Unit) Forecast, by Application 2019 & 2032
- Table 79: Venezuela Network Analytics Industry Revenue (Million) Forecast, by Application 2019 & 2032
- Table 80: Venezuela Network Analytics Industry Volume (K Unit) Forecast, by Application 2019 & 2032
- Table 81: Rest of South America Network Analytics Industry Revenue (Million) Forecast, by Application 2019 & 2032
- Table 82: Rest of South America Network Analytics Industry Volume (K Unit) Forecast, by Application 2019 & 2032
- Table 83: Global Network Analytics Industry Revenue Million Forecast, by Country 2019 & 2032
- Table 84: Global Network Analytics Industry Volume K Unit Forecast, by Country 2019 & 2032
- Table 85: United States Network Analytics Industry Revenue (Million) Forecast, by Application 2019 & 2032
- Table 86: United States Network Analytics Industry Volume (K Unit) Forecast, by Application 2019 & 2032
- Table 87: Canada Network Analytics Industry Revenue (Million) Forecast, by Application 2019 & 2032
- Table 88: Canada Network Analytics Industry Volume (K Unit) Forecast, by Application 2019 & 2032
- Table 89: Mexico Network Analytics Industry Revenue (Million) Forecast, by Application 2019 & 2032
- Table 90: Mexico Network Analytics Industry Volume (K Unit) Forecast, by Application 2019 & 2032
- Table 91: Global Network Analytics Industry Revenue Million Forecast, by Country 2019 & 2032
- Table 92: Global Network Analytics Industry Volume K Unit Forecast, by Country 2019 & 2032
- Table 93: United Arab Emirates Network Analytics Industry Revenue (Million) Forecast, by Application 2019 & 2032
- Table 94: United Arab Emirates Network Analytics Industry Volume (K Unit) Forecast, by Application 2019 & 2032
- Table 95: Saudi Arabia Network Analytics Industry Revenue (Million) Forecast, by Application 2019 & 2032
- Table 96: Saudi Arabia Network Analytics Industry Volume (K Unit) Forecast, by Application 2019 & 2032
- Table 97: South Africa Network Analytics Industry Revenue (Million) Forecast, by Application 2019 & 2032
- Table 98: South Africa Network Analytics Industry Volume (K Unit) Forecast, by Application 2019 & 2032
- Table 99: Rest of Middle East and Africa Network Analytics Industry Revenue (Million) Forecast, by Application 2019 & 2032
- Table 100: Rest of Middle East and Africa Network Analytics Industry Volume (K Unit) Forecast, by Application 2019 & 2032
- Table 101: Global Network Analytics Industry Revenue Million Forecast, by Deployment 2019 & 2032
- Table 102: Global Network Analytics Industry Volume K Unit Forecast, by Deployment 2019 & 2032
- Table 103: Global Network Analytics Industry Revenue Million Forecast, by Type 2019 & 2032
- Table 104: Global Network Analytics Industry Volume K Unit Forecast, by Type 2019 & 2032
- Table 105: Global Network Analytics Industry Revenue Million Forecast, by End-User 2019 & 2032
- Table 106: Global Network Analytics Industry Volume K Unit Forecast, by End-User 2019 & 2032
- Table 107: Global Network Analytics Industry Revenue Million Forecast, by Country 2019 & 2032
- Table 108: Global Network Analytics Industry Volume K Unit Forecast, by Country 2019 & 2032
- Table 109: United States Network Analytics Industry Revenue (Million) Forecast, by Application 2019 & 2032
- Table 110: United States Network Analytics Industry Volume (K Unit) Forecast, by Application 2019 & 2032
- Table 111: Canada Network Analytics Industry Revenue (Million) Forecast, by Application 2019 & 2032
- Table 112: Canada Network Analytics Industry Volume (K Unit) Forecast, by Application 2019 & 2032
- Table 113: Global Network Analytics Industry Revenue Million Forecast, by Deployment 2019 & 2032
- Table 114: Global Network Analytics Industry Volume K Unit Forecast, by Deployment 2019 & 2032
- Table 115: Global Network Analytics Industry Revenue Million Forecast, by Type 2019 & 2032
- Table 116: Global Network Analytics Industry Volume K Unit Forecast, by Type 2019 & 2032
- Table 117: Global Network Analytics Industry Revenue Million Forecast, by End-User 2019 & 2032
- Table 118: Global Network Analytics Industry Volume K Unit Forecast, by End-User 2019 & 2032
- Table 119: Global Network Analytics Industry Revenue Million Forecast, by Country 2019 & 2032
- Table 120: Global Network Analytics Industry Volume K Unit Forecast, by Country 2019 & 2032
- Table 121: United Kingdom Network Analytics Industry Revenue (Million) Forecast, by Application 2019 & 2032
- Table 122: United Kingdom Network Analytics Industry Volume (K Unit) Forecast, by Application 2019 & 2032
- Table 123: Rest of Europe Network Analytics Industry Revenue (Million) Forecast, by Application 2019 & 2032
- Table 124: Rest of Europe Network Analytics Industry Volume (K Unit) Forecast, by Application 2019 & 2032
- Table 125: Global Network Analytics Industry Revenue Million Forecast, by Deployment 2019 & 2032
- Table 126: Global Network Analytics Industry Volume K Unit Forecast, by Deployment 2019 & 2032
- Table 127: Global Network Analytics Industry Revenue Million Forecast, by Type 2019 & 2032
- Table 128: Global Network Analytics Industry Volume K Unit Forecast, by Type 2019 & 2032
- Table 129: Global Network Analytics Industry Revenue Million Forecast, by End-User 2019 & 2032
- Table 130: Global Network Analytics Industry Volume K Unit Forecast, by End-User 2019 & 2032
- Table 131: Global Network Analytics Industry Revenue Million Forecast, by Country 2019 & 2032
- Table 132: Global Network Analytics Industry Volume K Unit Forecast, by Country 2019 & 2032
- Table 133: China Network Analytics Industry Revenue (Million) Forecast, by Application 2019 & 2032
- Table 134: China Network Analytics Industry Volume (K Unit) Forecast, by Application 2019 & 2032
- Table 135: Japan Network Analytics Industry Revenue (Million) Forecast, by Application 2019 & 2032
- Table 136: Japan Network Analytics Industry Volume (K Unit) Forecast, by Application 2019 & 2032
- Table 137: India Network Analytics Industry Revenue (Million) Forecast, by Application 2019 & 2032
- Table 138: India Network Analytics Industry Volume (K Unit) Forecast, by Application 2019 & 2032
- Table 139: Australia and New Zealand Network Analytics Industry Revenue (Million) Forecast, by Application 2019 & 2032
- Table 140: Australia and New Zealand Network Analytics Industry Volume (K Unit) Forecast, by Application 2019 & 2032
- Table 141: Rest of Asia Pacific Network Analytics Industry Revenue (Million) Forecast, by Application 2019 & 2032
- Table 142: Rest of Asia Pacific Network Analytics Industry Volume (K Unit) Forecast, by Application 2019 & 2032
- Table 143: Global Network Analytics Industry Revenue Million Forecast, by Deployment 2019 & 2032
- Table 144: Global Network Analytics Industry Volume K Unit Forecast, by Deployment 2019 & 2032
- Table 145: Global Network Analytics Industry Revenue Million Forecast, by Type 2019 & 2032
- Table 146: Global Network Analytics Industry Volume K Unit Forecast, by Type 2019 & 2032
- Table 147: Global Network Analytics Industry Revenue Million Forecast, by End-User 2019 & 2032
- Table 148: Global Network Analytics Industry Volume K Unit Forecast, by End-User 2019 & 2032
- Table 149: Global Network Analytics Industry Revenue Million Forecast, by Country 2019 & 2032
- Table 150: Global Network Analytics Industry Volume K Unit Forecast, by Country 2019 & 2032
- Table 151: Brazil Network Analytics Industry Revenue (Million) Forecast, by Application 2019 & 2032
- Table 152: Brazil Network Analytics Industry Volume (K Unit) Forecast, by Application 2019 & 2032
- Table 153: Mexico Network Analytics Industry Revenue (Million) Forecast, by Application 2019 & 2032
- Table 154: Mexico Network Analytics Industry Volume (K Unit) Forecast, by Application 2019 & 2032
- Table 155: Rest of Latin America Network Analytics Industry Revenue (Million) Forecast, by Application 2019 & 2032
- Table 156: Rest of Latin America Network Analytics Industry Volume (K Unit) Forecast, by Application 2019 & 2032
- Table 157: Global Network Analytics Industry Revenue Million Forecast, by Deployment 2019 & 2032
- Table 158: Global Network Analytics Industry Volume K Unit Forecast, by Deployment 2019 & 2032
- Table 159: Global Network Analytics Industry Revenue Million Forecast, by Type 2019 & 2032
- Table 160: Global Network Analytics Industry Volume K Unit Forecast, by Type 2019 & 2032
- Table 161: Global Network Analytics Industry Revenue Million Forecast, by End-User 2019 & 2032
- Table 162: Global Network Analytics Industry Volume K Unit Forecast, by End-User 2019 & 2032
- Table 163: Global Network Analytics Industry Revenue Million Forecast, by Country 2019 & 2032
- Table 164: Global Network Analytics Industry Volume K Unit Forecast, by Country 2019 & 2032
- Table 165: Middle East Network Analytics Industry Revenue (Million) Forecast, by Application 2019 & 2032
- Table 166: Middle East Network Analytics Industry Volume (K Unit) Forecast, by Application 2019 & 2032
- Table 167: Africa Network Analytics Industry Revenue (Million) Forecast, by Application 2019 & 2032
- Table 168: Africa Network Analytics Industry Volume (K Unit) Forecast, by Application 2019 & 2032
Frequently Asked Questions
1. What is the projected Compound Annual Growth Rate (CAGR) of the Network Analytics Industry?
The projected CAGR is approximately 20.12%.
2. Which companies are prominent players in the Network Analytics Industry?
Key companies in the market include SAS Institute Inc, Tibco Software Inc, Accenture PLC, IBM Corporation, Sandvine Corporation, Hewlett Packard Enterprise Company, Allot Communication, Cisco Systems Inc, Juniper Networks Inc, Ericsson Inc, Bradford Networks Inc, Nokia Corporation, Alcatel-Lucent Enterprise SA.
3. What are the main segments of the Network Analytics Industry?
The market segments include Deployment, Type, End-User.
4. Can you provide details about the market size?
The market size is estimated to be USD XX Million as of 2022.
5. What are some drivers contributing to market growth?
Need for Autonomous and Self-managing Networks; Rise of IoT and Machine-to-machine Communications; Need for Improved Network Reliability and Elimination of Costly Disruptions.
6. What are the notable trends driving market growth?
Communication Service Providers Segment is Expected to Witness a Significant Growth.
7. Are there any restraints impacting market growth?
High Initial Costs and Low ROI; Design and Upgradation of Platforms.
8. Can you provide examples of recent developments in the market?
October 2022: Communication Service Providers (CSPs) may benefit from Network Analytics Suite, a new set of virtualized cloud infrastructure products developed by Oracle, to gain more knowledge about the performance and stability of their 5G data centers. It gathers data from the 5G network functions (NFs), app functions (AFs), and operations, administration, and maintenance that comply with the standards (OAM).
9. What pricing options are available for accessing the report?
Pricing options include single-user, multi-user, and enterprise licenses priced at USD 4750, USD 5250, and USD 8750 respectively.
10. Is the market size provided in terms of value or volume?
The market size is provided in terms of value, measured in Million and volume, measured in K Unit.
11. Are there any specific market keywords associated with the report?
Yes, the market keyword associated with the report is "Network Analytics Industry," which aids in identifying and referencing the specific market segment covered.
12. How do I determine which pricing option suits my needs best?
The pricing options vary based on user requirements and access needs. Individual users may opt for single-user licenses, while businesses requiring broader access may choose multi-user or enterprise licenses for cost-effective access to the report.
13. Are there any additional resources or data provided in the Network Analytics Industry report?
While the report offers comprehensive insights, it's advisable to review the specific contents or supplementary materials provided to ascertain if additional resources or data are available.
14. How can I stay updated on further developments or reports in the Network Analytics Industry?
To stay informed about further developments, trends, and reports in the Network Analytics Industry, consider subscribing to industry newsletters, following relevant companies and organizations, or regularly checking reputable industry news sources and publications.
Methodology
Step 1 - Identification of Relevant Samples Size from Population Database


Step 2 - Approaches for Defining Global Market Size (Value, Volume* & Price*)

Note*: In applicable scenarios
Step 3 - Data Sources
Primary Research
- Web Analytics
- Survey Reports
- Research Institute
- Latest Research Reports
- Opinion Leaders
Secondary Research
- Annual Reports
- White Paper
- Latest Press Release
- Industry Association
- Paid Database
- Investor Presentations

Step 4 - Data Triangulation
Involves using different sources of information in order to increase the validity of a study
These sources are likely to be stakeholders in a program - participants, other researchers, program staff, other community members, and so on.
Then we put all data in single framework & apply various statistical tools to find out the dynamic on the market.
During the analysis stage, feedback from the stakeholder groups would be compared to determine areas of agreement as well as areas of divergence
