

Key Insights
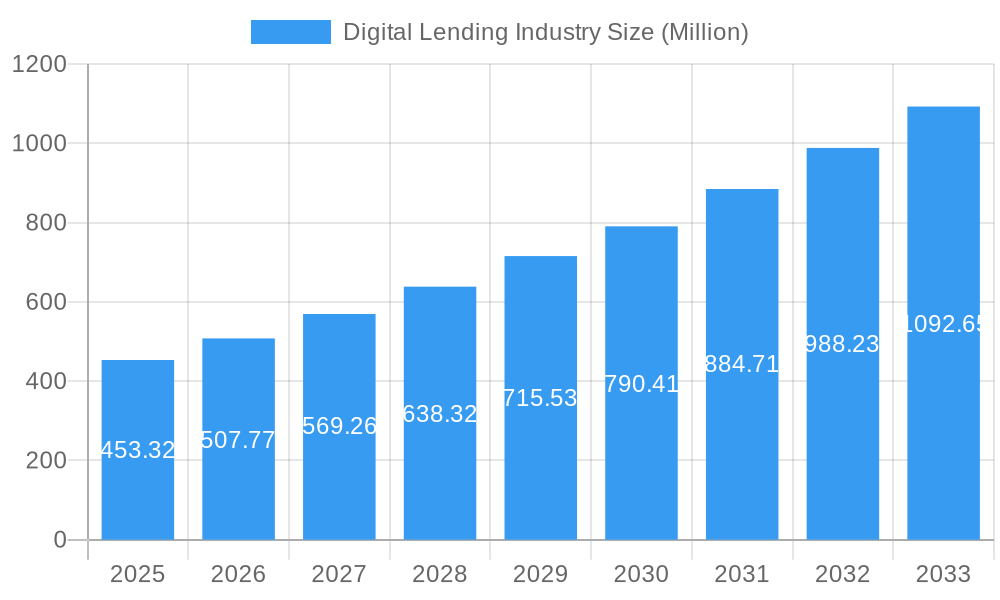
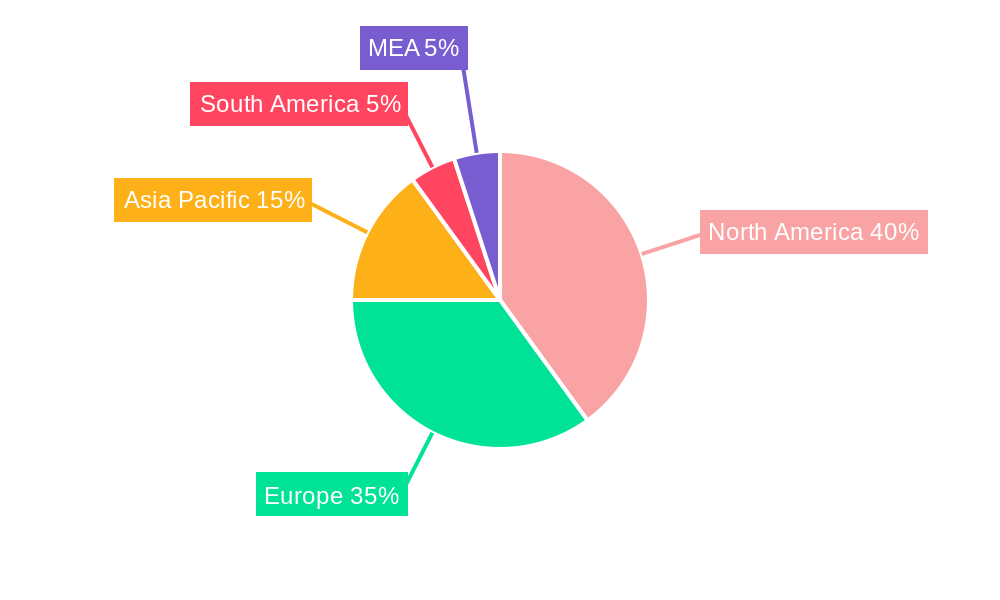
The global digital lending market, valued at $453.32 million in 2025, is projected to experience robust growth, driven by the increasing adoption of fintech solutions, rising smartphone penetration, and the expanding e-commerce sector. The market's Compound Annual Growth Rate (CAGR) of 11.90% from 2019 to 2024 indicates a strong upward trajectory, expected to continue throughout the forecast period (2025-2033). Key drivers include the enhanced convenience and speed offered by digital platforms compared to traditional lending methods, the ability to reach underserved populations, and the use of advanced analytics and AI for improved risk assessment and credit scoring. The rise of open banking and APIs is further facilitating seamless integration with various financial services, fueling market expansion. While data privacy and security concerns present a restraint, the industry is actively addressing these through robust security measures and regulatory compliance. The market is segmented by type (business and consumer lending) and by ecosystem participants (startups and incumbents). The business segment is likely to experience higher growth due to the increasing demand for quick and efficient financing solutions among small and medium-sized enterprises (SMEs). North America and Europe currently hold significant market shares, but the Asia-Pacific region is poised for rapid growth due to its large and increasingly digitally savvy population.
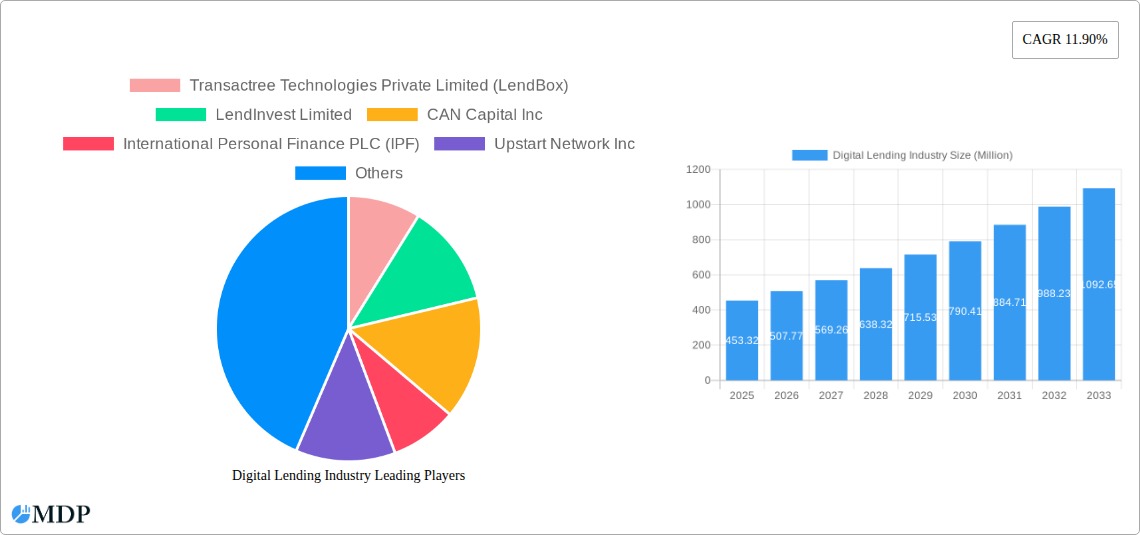
Digital Lending Industry Market Size (In Million)
The competitive landscape is characterized by a mix of established financial institutions and innovative fintech startups. Established players are leveraging their brand reputation and existing customer base to integrate digital lending solutions, while startups are introducing disruptive technologies and business models. The ongoing consolidation and partnerships within the industry reflect a push towards wider reach and enhanced service offerings. Growth will be further influenced by evolving regulatory frameworks and advancements in technologies like blockchain and artificial intelligence, which promise to further improve efficiency and transparency in the lending process. The expanding adoption of mobile-first lending platforms and the growth of Buy Now, Pay Later (BNPL) services significantly contribute to the market's overall positive outlook. Predicting precise future values requires detailed financial statements for each company listed and precise market breakdown by region, which is beyond the scope of this analysis, given the limited information provided. However, the provided data strongly suggests a consistently upward trend in the digital lending market throughout the forecast period.
Digital Lending Industry Company Market Share
Digital Lending Industry: A Comprehensive Market Report (2019-2033)
This in-depth report provides a comprehensive analysis of the global digital lending industry, encompassing market dynamics, leading players, technological advancements, and future growth prospects. With a study period spanning 2019-2033, a base year of 2025, and an estimated year of 2025, this report offers invaluable insights for investors, lenders, fintech companies, and regulatory bodies. The forecast period covers 2025-2033, while the historical period analyzed is 2019-2024. Expect detailed analysis of market share, M&A activity, and projected growth across various segments, including business and consumer lending. The report also covers key developments such as the RBI's new digital lending pilot project and the Biz2X-TruBoard partnership aimed at reducing NPAs. This report contains no placeholders and is ready for immediate use.
Digital Lending Industry Market Dynamics & Concentration
The digital lending market, valued at xx Million in 2024, exhibits a dynamic interplay of concentration, innovation, regulation, and evolving consumer preferences. Market concentration is moderate, with a few major players commanding significant shares, while numerous smaller firms compete in niche segments. The market share of the top 5 players is estimated at xx%, indicating a relatively fragmented landscape. Innovation drives, such as AI-powered credit scoring and blockchain technology for secure transactions, are shaping the industry's trajectory.
Regulatory frameworks, constantly evolving to address risks and protect consumers, significantly impact market dynamics. The rise of open banking and stricter data privacy regulations are key considerations. Product substitutes, such as traditional lending channels and peer-to-peer lending platforms, continue to exert competitive pressure. End-user trends, particularly the increasing adoption of mobile lending and the demand for personalized financial services, influence market growth. M&A activity is robust, with xx major deals recorded between 2019 and 2024. This trend reflects the industry's consolidation and the expansion of existing players.
- Market Concentration: Top 5 players hold approximately xx% market share.
- M&A Activity: xx major deals recorded between 2019 and 2024.
- Key Innovation Drivers: AI-powered credit scoring, blockchain technology.
- Regulatory Landscape: Increasing focus on data privacy and open banking.
Digital Lending Industry Industry Trends & Analysis
The global digital lending market is experiencing rapid expansion, driven by technological advancements, shifting consumer preferences, and favorable economic conditions. The Compound Annual Growth Rate (CAGR) is projected to be xx% during the forecast period (2025-2033), with market penetration expected to reach xx% by 2033. Technological disruptions, including the widespread adoption of mobile lending apps, AI-driven risk assessment, and the integration of blockchain technology for secure and transparent transactions, are transforming the industry. Consumer preferences are shifting towards convenience, speed, and personalized financial solutions, fueling the growth of digital lending platforms. Competitive dynamics are intense, with both established financial institutions and fintech startups vying for market share. This competition drives innovation and leads to the development of more efficient and customer-centric lending products.
Leading Markets & Segments in Digital Lending Industry
The digital lending market shows significant regional variations, with xx being the leading region due to factors such as robust economic growth, favorable regulatory environment, and high internet penetration. Within this region, country xx demonstrates particularly strong growth.
By Type:
Business Lending: The business lending segment is experiencing significant growth driven by the increasing demand for working capital and expansion financing among SMEs. Key drivers include government support programs for small businesses and the growing adoption of digital lending platforms by businesses of all sizes.
Consumer Lending: The consumer lending segment is driven by rising disposable incomes, increasing smartphone penetration, and the convenience of online borrowing. The segment is further boosted by the expanding fintech ecosystem which offers consumer-friendly solutions.
Business Digital Lending Ecosystem (Startups and Incumbents):
Startups: The proliferation of digital lending startups indicates a high level of innovation, bringing new technologies and models to the market. This competitive landscape often leads to faster product development and improved services.
Incumbents: Traditional banks and financial institutions are adapting to the digital revolution, investing in technologies and developing their own digital lending platforms to maintain competitiveness. Their established customer base and extensive resources provide a significant advantage.
Key Drivers (Region xx): Strong economic growth, favorable regulatory policies, high internet and smartphone penetration.
Digital Lending Industry Product Developments
Recent product innovations in digital lending include AI-driven credit scoring, personalized loan offers, and streamlined application processes. These advancements enhance the customer experience and improve efficiency for lenders. The integration of blockchain technology enhances security and transparency, while the adoption of open banking facilitates seamless data exchange between lenders and borrowers. These innovations directly address market needs for faster, more transparent, and accessible lending solutions.
Key Drivers of Digital Lending Industry Growth
Technological advancements, particularly in artificial intelligence and machine learning, are accelerating the growth of the digital lending industry. AI-powered credit scoring allows for faster and more accurate assessments, while mobile-first platforms enhance accessibility and convenience. Favorable economic conditions, such as low interest rates and increased disposable income, stimulate borrowing activity. Supportive government policies and regulatory frameworks promote innovation and adoption of digital lending solutions, furthering market expansion.
Challenges in the Digital Lending Industry Market
Regulatory hurdles, including compliance with data privacy regulations and anti-money laundering laws, represent significant challenges for digital lenders. Supply chain issues, especially concerning access to reliable data and efficient technology infrastructure, impact operational efficiency. Intense competition from established financial institutions and new entrants creates pressure on pricing and profitability. These factors collectively result in estimated xx Million in lost revenue annually.
Emerging Opportunities in Digital Lending Industry
Emerging technologies, such as embedded finance and the metaverse, present significant growth opportunities. Strategic partnerships between digital lenders and businesses across various sectors create new avenues for customer acquisition and product development. Expanding into underserved markets and developing innovative lending products tailored to specific customer segments promise substantial long-term growth.
Leading Players in the Digital Lending Industry Sector
- Transactree Technologies Private Limited (LendBox)
- LendInvest Limited
- CAN Capital Inc
- International Personal Finance PLC (IPF)
- Upstart Network Inc
- Provident Bank (Provident Financial Services Inc)
- Kiva Microfunds
- Bizfi LLC
- Klarna Bank AB
- On Deck Capital Inc
- Kabbage Inc
- Oriente
- Funding Circle Limited (Funding Circle Holdings PLC)
- i-LEND
- LendingClub Corp
- CapFloat Financial Services Private Limited
- Kaspi Bank JSC
- LenDenClub
- Decimal Technologies Pvt Ltd
- Zopa Limited
- Ferratum Oyj
- Social Finance Inc
- Monexo
- Faircent
- Prosper Marketplace Inc
Key Milestones in Digital Lending Industry Industry
- August 2023: The Reserve Bank of India (RBI) announces a pilot project for a public tech platform for frictionless digital lending, established by the RBIH. This initiative is expected to significantly increase financial inclusion and boost the digital lending market in India.
- August 2023: Biz2X partners with TruBoard to address rising NPAs in retail and small business loans using the Maadhyam platform. This collaboration improves asset performance management and contributes to better monetary inclusivity for SMEs.
Strategic Outlook for Digital Lending Industry Market
The digital lending industry is poised for sustained growth, driven by technological advancements, evolving consumer preferences, and expanding financial inclusion initiatives. Strategic opportunities abound in leveraging emerging technologies, forging strategic partnerships, and expanding into new markets. The focus on responsible lending practices and regulatory compliance will be paramount in shaping the industry's future. The market is expected to reach xx Million by 2033, presenting significant potential for both established players and new entrants.
Digital Lending Industry Segmentation
-
1. Type
-
1.1. Business
- 1.1.1. Business Digital Lending Market Dynamics
- 1.1.2. Business
-
1.2. By Consumer
- 1.2.1. Consumer Digital Lending Market Dynamics
- 1.2.2. Consumer
- 1.2.3. Consumer
-
1.1. Business
Digital Lending Industry Segmentation By Geography
- 1. North America
- 2. Europe
- 3. Asia
- 4. Australia and New Zealand
- 5. Latin America
- 6. Middle East and Africa
Digital Lending Industry Regional Market Share
Geographic Coverage of Digital Lending Industry
Digital Lending Industry REPORT HIGHLIGHTS
| Aspects | Details |
|---|---|
| Study Period | 2020-2034 |
| Base Year | 2025 |
| Estimated Year | 2026 |
| Forecast Period | 2026-2034 |
| Historical Period | 2020-2025 |
| Growth Rate | CAGR of 11.90% from 2020-2034 |
| Segmentation |
|
Table of Contents
- 1. Introduction
- 1.1. Research Scope
- 1.2. Market Segmentation
- 1.3. Research Methodology
- 1.4. Definitions and Assumptions
- 2. Executive Summary
- 2.1. Introduction
- 3. Market Dynamics
- 3.1. Introduction
- 3.2. Market Drivers
- 3.2.1. Increasing Number of Potential Loan Purchasers with Digital Behavior
- 3.3. Market Restrains
- 3.3.1. ; Privacy Concerns towards the Authentication Vendor and High Costs of Token
- 3.4. Market Trends
- 3.4.1. Consumer segment is expected to grow at a higher pace
- 4. Market Factor Analysis
- 4.1. Porters Five Forces
- 4.2. Supply/Value Chain
- 4.3. PESTEL analysis
- 4.4. Market Entropy
- 4.5. Patent/Trademark Analysis
- 5. Global Digital Lending Industry Analysis, Insights and Forecast, 2020-2032
- 5.1. Market Analysis, Insights and Forecast - by Type
- 5.1.1. Business
- 5.1.1.1. Business Digital Lending Market Dynamics
- 5.1.1.2. Business
- 5.1.2. By Consumer
- 5.1.2.1. Consumer Digital Lending Market Dynamics
- 5.1.2.2. Consumer
- 5.1.2.3. Consumer
- 5.1.1. Business
- 5.2. Market Analysis, Insights and Forecast - by Region
- 5.2.1. North America
- 5.2.2. Europe
- 5.2.3. Asia
- 5.2.4. Australia and New Zealand
- 5.2.5. Latin America
- 5.2.6. Middle East and Africa
- 5.1. Market Analysis, Insights and Forecast - by Type
- 6. North America Digital Lending Industry Analysis, Insights and Forecast, 2020-2032
- 6.1. Market Analysis, Insights and Forecast - by Type
- 6.1.1. Business
- 6.1.1.1. Business Digital Lending Market Dynamics
- 6.1.1.2. Business
- 6.1.2. By Consumer
- 6.1.2.1. Consumer Digital Lending Market Dynamics
- 6.1.2.2. Consumer
- 6.1.2.3. Consumer
- 6.1.1. Business
- 6.1. Market Analysis, Insights and Forecast - by Type
- 7. Europe Digital Lending Industry Analysis, Insights and Forecast, 2020-2032
- 7.1. Market Analysis, Insights and Forecast - by Type
- 7.1.1. Business
- 7.1.1.1. Business Digital Lending Market Dynamics
- 7.1.1.2. Business
- 7.1.2. By Consumer
- 7.1.2.1. Consumer Digital Lending Market Dynamics
- 7.1.2.2. Consumer
- 7.1.2.3. Consumer
- 7.1.1. Business
- 7.1. Market Analysis, Insights and Forecast - by Type
- 8. Asia Digital Lending Industry Analysis, Insights and Forecast, 2020-2032
- 8.1. Market Analysis, Insights and Forecast - by Type
- 8.1.1. Business
- 8.1.1.1. Business Digital Lending Market Dynamics
- 8.1.1.2. Business
- 8.1.2. By Consumer
- 8.1.2.1. Consumer Digital Lending Market Dynamics
- 8.1.2.2. Consumer
- 8.1.2.3. Consumer
- 8.1.1. Business
- 8.1. Market Analysis, Insights and Forecast - by Type
- 9. Australia and New Zealand Digital Lending Industry Analysis, Insights and Forecast, 2020-2032
- 9.1. Market Analysis, Insights and Forecast - by Type
- 9.1.1. Business
- 9.1.1.1. Business Digital Lending Market Dynamics
- 9.1.1.2. Business
- 9.1.2. By Consumer
- 9.1.2.1. Consumer Digital Lending Market Dynamics
- 9.1.2.2. Consumer
- 9.1.2.3. Consumer
- 9.1.1. Business
- 9.1. Market Analysis, Insights and Forecast - by Type
- 10. Latin America Digital Lending Industry Analysis, Insights and Forecast, 2020-2032
- 10.1. Market Analysis, Insights and Forecast - by Type
- 10.1.1. Business
- 10.1.1.1. Business Digital Lending Market Dynamics
- 10.1.1.2. Business
- 10.1.2. By Consumer
- 10.1.2.1. Consumer Digital Lending Market Dynamics
- 10.1.2.2. Consumer
- 10.1.2.3. Consumer
- 10.1.1. Business
- 10.1. Market Analysis, Insights and Forecast - by Type
- 11. Middle East and Africa Digital Lending Industry Analysis, Insights and Forecast, 2020-2032
- 11.1. Market Analysis, Insights and Forecast - by Type
- 11.1.1. Business
- 11.1.1.1. Business Digital Lending Market Dynamics
- 11.1.1.2. Business
- 11.1.2. By Consumer
- 11.1.2.1. Consumer Digital Lending Market Dynamics
- 11.1.2.2. Consumer
- 11.1.2.3. Consumer
- 11.1.1. Business
- 11.1. Market Analysis, Insights and Forecast - by Type
- 12. Competitive Analysis
- 12.1. Global Market Share Analysis 2025
- 12.2. Company Profiles
- 12.2.1 Transactree Technologies Private Limited (LendBox)
- 12.2.1.1. Overview
- 12.2.1.2. Products
- 12.2.1.3. SWOT Analysis
- 12.2.1.4. Recent Developments
- 12.2.1.5. Financials (Based on Availability)
- 12.2.2 LendInvest Limited
- 12.2.2.1. Overview
- 12.2.2.2. Products
- 12.2.2.3. SWOT Analysis
- 12.2.2.4. Recent Developments
- 12.2.2.5. Financials (Based on Availability)
- 12.2.3 CAN Capital Inc
- 12.2.3.1. Overview
- 12.2.3.2. Products
- 12.2.3.3. SWOT Analysis
- 12.2.3.4. Recent Developments
- 12.2.3.5. Financials (Based on Availability)
- 12.2.4 International Personal Finance PLC (IPF)
- 12.2.4.1. Overview
- 12.2.4.2. Products
- 12.2.4.3. SWOT Analysis
- 12.2.4.4. Recent Developments
- 12.2.4.5. Financials (Based on Availability)
- 12.2.5 Upstart Network Inc
- 12.2.5.1. Overview
- 12.2.5.2. Products
- 12.2.5.3. SWOT Analysis
- 12.2.5.4. Recent Developments
- 12.2.5.5. Financials (Based on Availability)
- 12.2.6 Provident Bank (Provident Financial Services Inc )
- 12.2.6.1. Overview
- 12.2.6.2. Products
- 12.2.6.3. SWOT Analysis
- 12.2.6.4. Recent Developments
- 12.2.6.5. Financials (Based on Availability)
- 12.2.7 Kiva Microfunds
- 12.2.7.1. Overview
- 12.2.7.2. Products
- 12.2.7.3. SWOT Analysis
- 12.2.7.4. Recent Developments
- 12.2.7.5. Financials (Based on Availability)
- 12.2.8 Bizfi LLC
- 12.2.8.1. Overview
- 12.2.8.2. Products
- 12.2.8.3. SWOT Analysis
- 12.2.8.4. Recent Developments
- 12.2.8.5. Financials (Based on Availability)
- 12.2.9 Klarna Bank AB
- 12.2.9.1. Overview
- 12.2.9.2. Products
- 12.2.9.3. SWOT Analysis
- 12.2.9.4. Recent Developments
- 12.2.9.5. Financials (Based on Availability)
- 12.2.10 On Deck Capital Inc
- 12.2.10.1. Overview
- 12.2.10.2. Products
- 12.2.10.3. SWOT Analysis
- 12.2.10.4. Recent Developments
- 12.2.10.5. Financials (Based on Availability)
- 12.2.11 Kabbage Inc
- 12.2.11.1. Overview
- 12.2.11.2. Products
- 12.2.11.3. SWOT Analysis
- 12.2.11.4. Recent Developments
- 12.2.11.5. Financials (Based on Availability)
- 12.2.12 Oriente
- 12.2.12.1. Overview
- 12.2.12.2. Products
- 12.2.12.3. SWOT Analysis
- 12.2.12.4. Recent Developments
- 12.2.12.5. Financials (Based on Availability)
- 12.2.13 Funding Circle Limited (Funding Circle Holdings PLC)
- 12.2.13.1. Overview
- 12.2.13.2. Products
- 12.2.13.3. SWOT Analysis
- 12.2.13.4. Recent Developments
- 12.2.13.5. Financials (Based on Availability)
- 12.2.14 i-LEND
- 12.2.14.1. Overview
- 12.2.14.2. Products
- 12.2.14.3. SWOT Analysis
- 12.2.14.4. Recent Developments
- 12.2.14.5. Financials (Based on Availability)
- 12.2.15 LendingClub Corp
- 12.2.15.1. Overview
- 12.2.15.2. Products
- 12.2.15.3. SWOT Analysis
- 12.2.15.4. Recent Developments
- 12.2.15.5. Financials (Based on Availability)
- 12.2.16 CapFloat Financial Services Private Limited
- 12.2.16.1. Overview
- 12.2.16.2. Products
- 12.2.16.3. SWOT Analysis
- 12.2.16.4. Recent Developments
- 12.2.16.5. Financials (Based on Availability)
- 12.2.17 Kaspi Bank JSC
- 12.2.17.1. Overview
- 12.2.17.2. Products
- 12.2.17.3. SWOT Analysis
- 12.2.17.4. Recent Developments
- 12.2.17.5. Financials (Based on Availability)
- 12.2.18 LenDenClub
- 12.2.18.1. Overview
- 12.2.18.2. Products
- 12.2.18.3. SWOT Analysis
- 12.2.18.4. Recent Developments
- 12.2.18.5. Financials (Based on Availability)
- 12.2.19 Decimal Technologies Pvt Ltd
- 12.2.19.1. Overview
- 12.2.19.2. Products
- 12.2.19.3. SWOT Analysis
- 12.2.19.4. Recent Developments
- 12.2.19.5. Financials (Based on Availability)
- 12.2.20 Zopa Limited
- 12.2.20.1. Overview
- 12.2.20.2. Products
- 12.2.20.3. SWOT Analysis
- 12.2.20.4. Recent Developments
- 12.2.20.5. Financials (Based on Availability)
- 12.2.21 Ferratum Oyj
- 12.2.21.1. Overview
- 12.2.21.2. Products
- 12.2.21.3. SWOT Analysis
- 12.2.21.4. Recent Developments
- 12.2.21.5. Financials (Based on Availability)
- 12.2.22 Social Finance Inc
- 12.2.22.1. Overview
- 12.2.22.2. Products
- 12.2.22.3. SWOT Analysis
- 12.2.22.4. Recent Developments
- 12.2.22.5. Financials (Based on Availability)
- 12.2.23 Monexo
- 12.2.23.1. Overview
- 12.2.23.2. Products
- 12.2.23.3. SWOT Analysis
- 12.2.23.4. Recent Developments
- 12.2.23.5. Financials (Based on Availability)
- 12.2.24 Faircent
- 12.2.24.1. Overview
- 12.2.24.2. Products
- 12.2.24.3. SWOT Analysis
- 12.2.24.4. Recent Developments
- 12.2.24.5. Financials (Based on Availability)
- 12.2.25 Prosper Marketplace Inc
- 12.2.25.1. Overview
- 12.2.25.2. Products
- 12.2.25.3. SWOT Analysis
- 12.2.25.4. Recent Developments
- 12.2.25.5. Financials (Based on Availability)
- 12.2.1 Transactree Technologies Private Limited (LendBox)
List of Figures
- Figure 1: Global Digital Lending Industry Revenue Breakdown (Million, %) by Region 2025 & 2033
- Figure 2: North America Digital Lending Industry Revenue (Million), by Type 2025 & 2033
- Figure 3: North America Digital Lending Industry Revenue Share (%), by Type 2025 & 2033
- Figure 4: North America Digital Lending Industry Revenue (Million), by Country 2025 & 2033
- Figure 5: North America Digital Lending Industry Revenue Share (%), by Country 2025 & 2033
- Figure 6: Europe Digital Lending Industry Revenue (Million), by Type 2025 & 2033
- Figure 7: Europe Digital Lending Industry Revenue Share (%), by Type 2025 & 2033
- Figure 8: Europe Digital Lending Industry Revenue (Million), by Country 2025 & 2033
- Figure 9: Europe Digital Lending Industry Revenue Share (%), by Country 2025 & 2033
- Figure 10: Asia Digital Lending Industry Revenue (Million), by Type 2025 & 2033
- Figure 11: Asia Digital Lending Industry Revenue Share (%), by Type 2025 & 2033
- Figure 12: Asia Digital Lending Industry Revenue (Million), by Country 2025 & 2033
- Figure 13: Asia Digital Lending Industry Revenue Share (%), by Country 2025 & 2033
- Figure 14: Australia and New Zealand Digital Lending Industry Revenue (Million), by Type 2025 & 2033
- Figure 15: Australia and New Zealand Digital Lending Industry Revenue Share (%), by Type 2025 & 2033
- Figure 16: Australia and New Zealand Digital Lending Industry Revenue (Million), by Country 2025 & 2033
- Figure 17: Australia and New Zealand Digital Lending Industry Revenue Share (%), by Country 2025 & 2033
- Figure 18: Latin America Digital Lending Industry Revenue (Million), by Type 2025 & 2033
- Figure 19: Latin America Digital Lending Industry Revenue Share (%), by Type 2025 & 2033
- Figure 20: Latin America Digital Lending Industry Revenue (Million), by Country 2025 & 2033
- Figure 21: Latin America Digital Lending Industry Revenue Share (%), by Country 2025 & 2033
- Figure 22: Middle East and Africa Digital Lending Industry Revenue (Million), by Type 2025 & 2033
- Figure 23: Middle East and Africa Digital Lending Industry Revenue Share (%), by Type 2025 & 2033
- Figure 24: Middle East and Africa Digital Lending Industry Revenue (Million), by Country 2025 & 2033
- Figure 25: Middle East and Africa Digital Lending Industry Revenue Share (%), by Country 2025 & 2033
List of Tables
- Table 1: Global Digital Lending Industry Revenue Million Forecast, by Type 2020 & 2033
- Table 2: Global Digital Lending Industry Revenue Million Forecast, by Region 2020 & 2033
- Table 3: Global Digital Lending Industry Revenue Million Forecast, by Type 2020 & 2033
- Table 4: Global Digital Lending Industry Revenue Million Forecast, by Country 2020 & 2033
- Table 5: Global Digital Lending Industry Revenue Million Forecast, by Type 2020 & 2033
- Table 6: Global Digital Lending Industry Revenue Million Forecast, by Country 2020 & 2033
- Table 7: Global Digital Lending Industry Revenue Million Forecast, by Type 2020 & 2033
- Table 8: Global Digital Lending Industry Revenue Million Forecast, by Country 2020 & 2033
- Table 9: Global Digital Lending Industry Revenue Million Forecast, by Type 2020 & 2033
- Table 10: Global Digital Lending Industry Revenue Million Forecast, by Country 2020 & 2033
- Table 11: Global Digital Lending Industry Revenue Million Forecast, by Type 2020 & 2033
- Table 12: Global Digital Lending Industry Revenue Million Forecast, by Country 2020 & 2033
- Table 13: Global Digital Lending Industry Revenue Million Forecast, by Type 2020 & 2033
- Table 14: Global Digital Lending Industry Revenue Million Forecast, by Country 2020 & 2033
Frequently Asked Questions
1. What is the projected Compound Annual Growth Rate (CAGR) of the Digital Lending Industry?
The projected CAGR is approximately 11.90%.
2. Which companies are prominent players in the Digital Lending Industry?
Key companies in the market include Transactree Technologies Private Limited (LendBox), LendInvest Limited, CAN Capital Inc, International Personal Finance PLC (IPF), Upstart Network Inc, Provident Bank (Provident Financial Services Inc ), Kiva Microfunds, Bizfi LLC, Klarna Bank AB, On Deck Capital Inc, Kabbage Inc, Oriente, Funding Circle Limited (Funding Circle Holdings PLC), i-LEND, LendingClub Corp, CapFloat Financial Services Private Limited, Kaspi Bank JSC, LenDenClub, Decimal Technologies Pvt Ltd, Zopa Limited, Ferratum Oyj, Social Finance Inc, Monexo, Faircent, Prosper Marketplace Inc.
3. What are the main segments of the Digital Lending Industry?
The market segments include Type.
4. Can you provide details about the market size?
The market size is estimated to be USD 453.32 Million as of 2022.
5. What are some drivers contributing to market growth?
Increasing Number of Potential Loan Purchasers with Digital Behavior.
6. What are the notable trends driving market growth?
Consumer segment is expected to grow at a higher pace.
7. Are there any restraints impacting market growth?
; Privacy Concerns towards the Authentication Vendor and High Costs of Token.
8. Can you provide examples of recent developments in the market?
In August 2023, The Reserve Bank of India (RBI) made an announcement regarding its plans to launch its new pilot project for digital lending for a public tech platform meant for 'frictionless credit.’ The platform is being established by the Reserve Bank Innovation Hub (RBIH), a solely-owned central bank subsidiary.
9. What pricing options are available for accessing the report?
Pricing options include single-user, multi-user, and enterprise licenses priced at USD 4750, USD 5250, and USD 8750 respectively.
10. Is the market size provided in terms of value or volume?
The market size is provided in terms of value, measured in Million.
11. Are there any specific market keywords associated with the report?
Yes, the market keyword associated with the report is "Digital Lending Industry," which aids in identifying and referencing the specific market segment covered.
12. How do I determine which pricing option suits my needs best?
The pricing options vary based on user requirements and access needs. Individual users may opt for single-user licenses, while businesses requiring broader access may choose multi-user or enterprise licenses for cost-effective access to the report.
13. Are there any additional resources or data provided in the Digital Lending Industry report?
While the report offers comprehensive insights, it's advisable to review the specific contents or supplementary materials provided to ascertain if additional resources or data are available.
14. How can I stay updated on further developments or reports in the Digital Lending Industry?
To stay informed about further developments, trends, and reports in the Digital Lending Industry, consider subscribing to industry newsletters, following relevant companies and organizations, or regularly checking reputable industry news sources and publications.
Methodology
Step 1 - Identification of Relevant Samples Size from Population Database


Step 2 - Approaches for Defining Global Market Size (Value, Volume* & Price*)

Note*: In applicable scenarios
Step 3 - Data Sources
Primary Research
- Web Analytics
- Survey Reports
- Research Institute
- Latest Research Reports
- Opinion Leaders
Secondary Research
- Annual Reports
- White Paper
- Latest Press Release
- Industry Association
- Paid Database
- Investor Presentations

Step 4 - Data Triangulation
Involves using different sources of information in order to increase the validity of a study
These sources are likely to be stakeholders in a program - participants, other researchers, program staff, other community members, and so on.
Then we put all data in single framework & apply various statistical tools to find out the dynamic on the market.
During the analysis stage, feedback from the stakeholder groups would be compared to determine areas of agreement as well as areas of divergence