

Key Insights
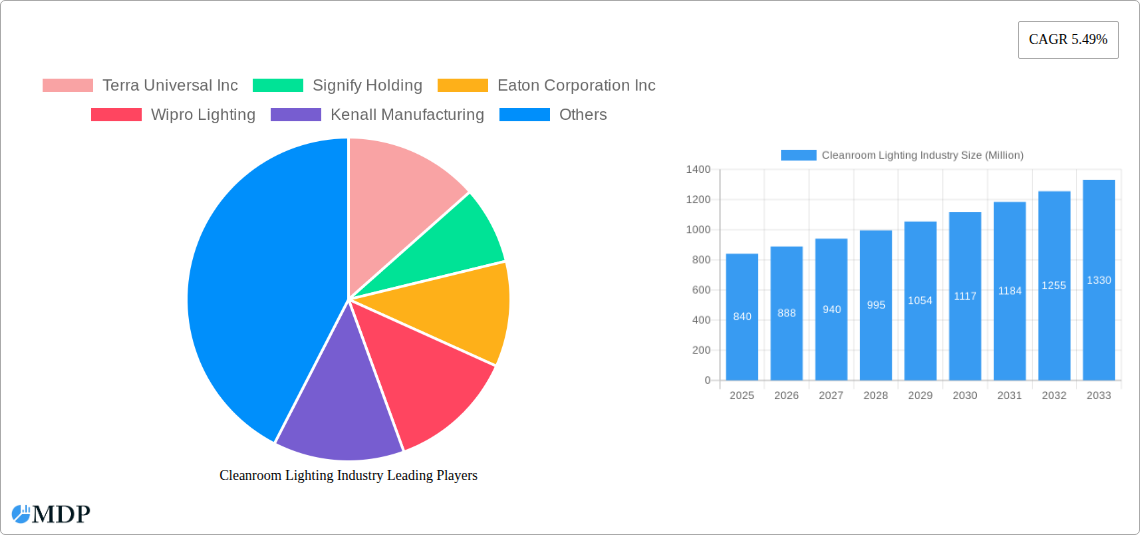
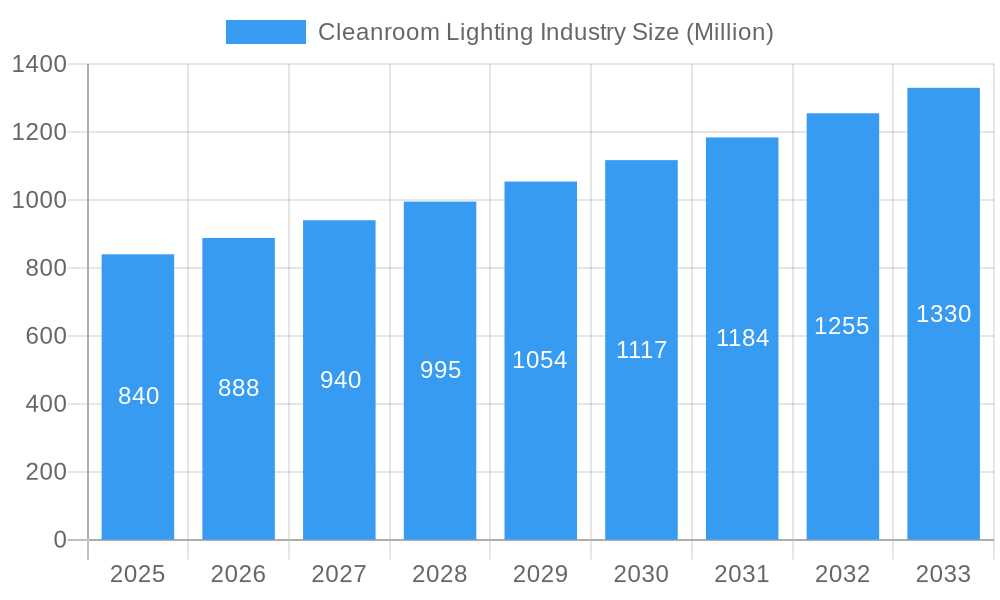
The cleanroom lighting market, valued at $840 million in 2025, is projected to experience robust growth, driven by the increasing demand for controlled environments across various industries. A compound annual growth rate (CAGR) of 5.49% from 2025 to 2033 indicates a significant expansion, reaching an estimated $1.3 billion by 2033. This growth is fueled by several key factors. The rising adoption of LED technology, offering superior energy efficiency and longer lifespans compared to fluorescent alternatives, is a major driver. Furthermore, the increasing stringency of regulatory compliance in sectors like healthcare and pharmaceuticals, demanding stringent cleanliness and illumination standards within cleanrooms, is significantly boosting market demand. The market segmentation highlights the importance of recessed and surface mount lighting types across diverse end-user industries, including healthcare, electronics, and food & beverage manufacturing. The competitive landscape features established players like Signify Holding and Eaton Corporation alongside specialized manufacturers, indicating a blend of established expertise and emerging innovation within the industry. Technological advancements such as IoT-enabled lighting systems and advancements in antimicrobial coatings further contribute to market growth by enhancing cleanroom efficiency and hygiene.
Cleanroom Lighting Industry Market Size (In Million)
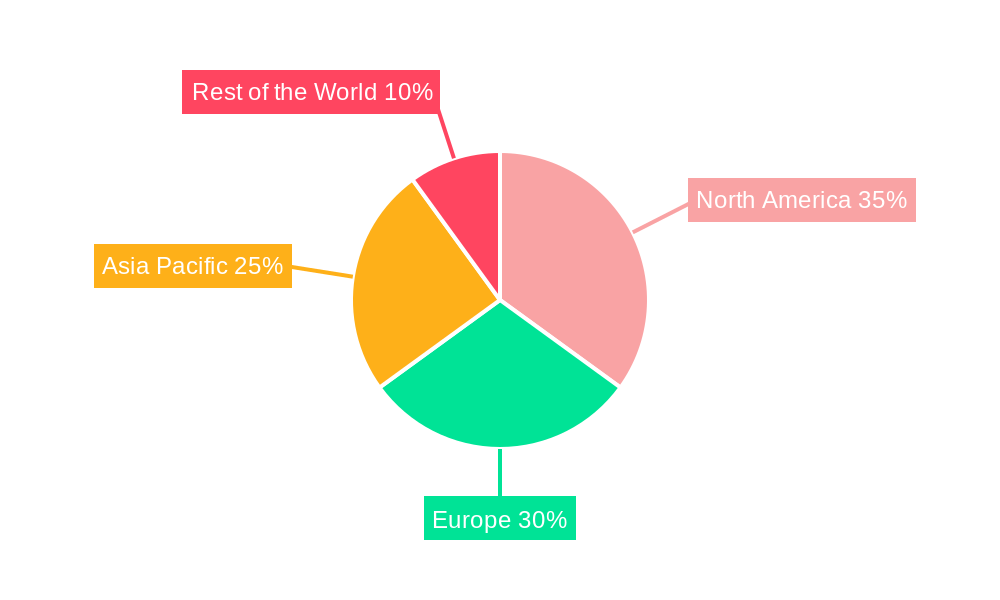
The geographical distribution of the market likely reflects the concentration of high-tech industries and pharmaceutical manufacturing hubs. North America and Europe are anticipated to hold significant market shares due to their established regulatory frameworks and technological advancements. However, rapid industrialization and economic growth in the Asia-Pacific region are expected to fuel substantial market expansion in the coming years, potentially surpassing regional growth in North America and Europe within the forecast period. The market's growth is, however, subject to restraints such as high initial investment costs associated with cleanroom infrastructure and the potential impact of economic downturns on capital expenditure in various industries. Nevertheless, the long-term outlook for cleanroom lighting remains positive, fueled by continuous technological improvements and the growing necessity for controlled environments across a broad spectrum of applications.
Cleanroom Lighting Industry Company Market Share
Cleanroom Lighting Industry Market Report: 2019-2033
Dive into the comprehensive analysis of the Cleanroom Lighting Industry, uncovering key trends, market dynamics, and future growth prospects. This in-depth report provides crucial insights for stakeholders, investors, and industry professionals seeking to navigate this dynamic sector. This report covers the period from 2019-2033, with a base year of 2025 and a forecast period of 2025-2033.
Cleanroom Lighting Industry Market Dynamics & Concentration
The global cleanroom lighting market, valued at $XX million in 2024, is projected to reach $XX million by 2033, exhibiting a CAGR of XX% during the forecast period (2025-2033). Market concentration is moderately high, with several key players holding significant market share.
Market Leaders: Signify Holding, Eaton Corporation Inc., and Wipro Lighting are among the leading players, collectively holding an estimated XX% market share in 2024. Other notable participants include Terra Universal Inc., Kenall Manufacturing, Solite Europe Ltd, LUG Light Factory Sp z o o, AB Fagerhult, Crompton Greaves Consumer Electricals Ltd, and Paramount Industries. This list is not exhaustive.
Innovation Drivers: Stringent regulatory requirements regarding contamination control and energy efficiency are primary drivers of innovation. The demand for advanced LED lighting solutions with features like adjustable color temperature, dimming capabilities, and enhanced hygiene is steadily increasing.
Regulatory Frameworks: Stringent international standards and regulations regarding energy consumption, safety, and hygiene in cleanroom environments significantly influence market growth and product development. Compliance costs and technological advancements to meet these regulations are shaping the market landscape.
Product Substitutes: While LED lighting is becoming the dominant technology, some niche applications might still utilize fluorescent solutions. However, the superior energy efficiency and longer lifespan of LEDs are making them increasingly preferred.
End-User Trends: The rising adoption of cleanroom technology across diverse industries, including healthcare & life sciences, electronics and semiconductors, and food & beverage, is boosting market demand. Growth in the pharmaceutical and biotechnology sectors, particularly in emerging economies, is a significant contributing factor.
M&A Activities: The cleanroom lighting sector has witnessed a moderate number of mergers and acquisitions in recent years (approximately XX deals between 2019 and 2024). These activities are primarily aimed at expanding product portfolios, strengthening market presence, and accessing new technologies.
Cleanroom Lighting Industry Industry Trends & Analysis
The cleanroom lighting market is experiencing significant growth driven by several factors. The increasing demand for energy-efficient lighting solutions, coupled with stricter regulations on energy consumption, is fueling the adoption of LED lighting systems. The rising demand for superior lighting solutions that enhance productivity and minimize cross-contamination is another key driver. Technological advancements, such as the development of smart lighting systems with integrated sensors and remote control capabilities, are further accelerating market growth. Moreover, the increasing adoption of cleanrooms across various industries, particularly in the healthcare and semiconductor sectors, is creating substantial growth opportunities. The market penetration of LED cleanroom lighting is already high, but continued growth is expected due to ongoing technological improvements and the associated cost reductions. This is reflected in the XX% CAGR observed over the historical period (2019-2024). Competitive dynamics are largely shaped by price competitiveness, technological innovation, and the ability to meet stringent regulatory requirements.
Leading Markets & Segments in Cleanroom Lighting Industry
The North American region currently dominates the cleanroom lighting market, followed by Europe and Asia-Pacific. This dominance is attributed to factors such as high technological advancements, robust regulatory frameworks promoting energy efficiency, and a large number of established cleanroom users in various industries.
By Light Source: LED lighting holds the largest market share, owing to its superior energy efficiency, longer lifespan, and improved light quality compared to fluorescent alternatives.
By Mounting Type: Recessed lighting is the preferred mounting type for many cleanroom applications due to its sleek design, ease of cleaning, and streamlined aesthetics. However, surface-mounted lights retain significance due to their ease of installation and cost-effectiveness.
By End-user Industry: The healthcare & life sciences sector dominates the demand for cleanroom lighting, fueled by the increasing focus on hygiene and contamination control in pharmaceutical manufacturing and research facilities. The electronics and semiconductor industry also presents a substantial segment due to the stringent cleanliness requirements in chip manufacturing and assembly. Food & beverage and other industries (such as aerospace and automotive) are also contributing to market growth.
Key Drivers:
- North America: Strong regulatory push for energy efficiency, high adoption of advanced technologies in the pharmaceutical and semiconductor industries.
- Europe: Stringent environmental regulations, increasing investment in life sciences research & development.
- Asia-Pacific: Rapid industrialization, expanding healthcare infrastructure, and growth in semiconductor manufacturing.
Cleanroom Lighting Industry Product Developments
Recent product innovations focus on improving energy efficiency, enhancing light quality, and integrating smart functionalities. LED technology continues to advance, resulting in higher lumen output, better color rendering, and improved durability. The integration of sensors for automated control, monitoring, and data analytics is gaining traction. These developments provide competitive advantages through reduced energy consumption, improved operational efficiency, and enhanced compliance with cleanroom standards.
Key Drivers of Cleanroom Lighting Industry Growth
Technological advancements in LED lighting, particularly in terms of energy efficiency and longevity, are a major driver. Stringent regulatory frameworks promoting energy conservation and improved hygiene standards further stimulate market growth. The expansion of industries such as pharmaceuticals, biotechnology, and semiconductors, all requiring cleanroom environments, is a key growth catalyst. Lastly, the increasing awareness among consumers regarding the importance of contamination control and hygiene is contributing to the market’s expansion.
Challenges in the Cleanroom Lighting Industry Market
High initial investment costs associated with installing advanced cleanroom lighting systems can be a barrier to entry for some businesses. Supply chain disruptions and fluctuations in raw material prices can impact manufacturing costs and availability. Intense competition from established players and the emergence of new entrants pose significant challenges to maintaining market share. The stringent regulatory compliance requirements associated with cleanroom certifications present another hurdle for businesses.
Emerging Opportunities in Cleanroom Lighting Industry
Emerging opportunities lie in the development of intelligent lighting systems that incorporate IoT technologies, allowing for real-time monitoring and control of lighting parameters. Strategic partnerships between cleanroom lighting manufacturers and HVAC system providers can offer integrated solutions for optimized environmental control. Expansion into emerging markets with rapidly developing healthcare and manufacturing sectors presents significant growth potential.
Leading Players in the Cleanroom Lighting Industry Sector
- Terra Universal Inc
- Signify Holding
- Eaton Corporation Inc
- Wipro Lighting
- Kenall Manufacturing
- Solite Europe Ltd
- LUG Light Factory Sp z o o
- AB Fagerhult
- Crompton Greaves Consumer Electricals Ltd
- Paramount Industries
Key Milestones in Cleanroom Lighting Industry Industry
December 2022: Nicomac Taikisha Cleanrooms' USD 15.2 million investment in a new manufacturing facility signifies expanding demand for cleanroom solutions across various sectors, including electronics, food, and pharmaceuticals. This directly increases the need for cleanroom lighting solutions.
May 2022: LOG's multi-million-dollar investment in a new ISO Class 8 cleanroom highlights the growing investment in cleanroom infrastructure and the associated need for specialized lighting.
Strategic Outlook for Cleanroom Lighting Industry Market
The cleanroom lighting market is poised for continued growth, driven by technological advancements, regulatory pressures, and expanding end-user industries. Strategic opportunities exist in developing innovative lighting solutions tailored to specific cleanroom applications, forging strategic partnerships, and expanding into emerging markets. Focus on energy efficiency, smart technologies, and superior hygiene will be crucial for success in this competitive market.
Cleanroom Lighting Industry Segmentation
-
1. Light Source
- 1.1. LED
- 1.2. Fluorescent
-
2. Mounting Type
- 2.1. Recessed
- 2.2. Surface Mount
-
3. End-user Industry
- 3.1. Healthcare & Life Sciences
- 3.2. Electronics and Semiconductor
- 3.3. Food & Beverage
- 3.4. Other End-user Industries
Cleanroom Lighting Industry Segmentation By Geography
- 1. North America
- 2. Europe
- 3. Asia
- 4. Latin America
- 5. Middle East and Africa
Cleanroom Lighting Industry Regional Market Share
Geographic Coverage of Cleanroom Lighting Industry
Cleanroom Lighting Industry REPORT HIGHLIGHTS
| Aspects | Details |
|---|---|
| Study Period | 2020-2034 |
| Base Year | 2025 |
| Estimated Year | 2026 |
| Forecast Period | 2026-2034 |
| Historical Period | 2020-2025 |
| Growth Rate | CAGR of 5.49% from 2020-2034 |
| Segmentation |
|
Table of Contents
- 1. Introduction
- 1.1. Research Scope
- 1.2. Market Segmentation
- 1.3. Research Objective
- 1.4. Definitions and Assumptions
- 2. Executive Summary
- 2.1. Market Snapshot
- 3. Market Dynamics
- 3.1. Market Drivers
- 3.2. Market Restrains
- 3.3. Market Trends
- 3.4. Market Opportunities
- 4. Market Factor Analysis
- 4.1. Porters Five Forces
- 4.1.1. Bargaining Power of Suppliers
- 4.1.2. Bargaining Power of Buyers
- 4.1.3. Threat of New Entrants
- 4.1.4. Threat of Substitutes
- 4.1.5. Competitive Rivalry
- 4.2. PESTEL analysis
- 4.3. BCG Analysis
- 4.3.1. Stars (High Growth, High Market Share)
- 4.3.2. Cash Cows (Low Growth, High Market Share)
- 4.3.3. Question Mark (High Growth, Low Market Share)
- 4.3.4. Dogs (Low Growth, Low Market Share)
- 4.4. Ansoff Matrix Analysis
- 4.5. Supply Chain Analysis
- 4.6. Regulatory Landscape
- 4.7. Current Market Potential and Opportunity Assessment (TAM–SAM–SOM Framework)
- 4.8. MDP Analyst Note
- 4.1. Porters Five Forces
- 5. Market Analysis, Insights and Forecast 2021-2033
- 5.1. Market Analysis, Insights and Forecast - by Light Source
- 5.1.1. LED
- 5.1.2. Fluorescent
- 5.2. Market Analysis, Insights and Forecast - by Mounting Type
- 5.2.1. Recessed
- 5.2.2. Surface Mount
- 5.3. Market Analysis, Insights and Forecast - by End-user Industry
- 5.3.1. Healthcare & Life Sciences
- 5.3.2. Electronics and Semiconductor
- 5.3.3. Food & Beverage
- 5.3.4. Other End-user Industries
- 5.4. Market Analysis, Insights and Forecast - by Region
- 5.4.1. North America
- 5.4.2. Europe
- 5.4.3. Asia
- 5.4.4. Latin America
- 5.4.5. Middle East and Africa
- 5.1. Market Analysis, Insights and Forecast - by Light Source
- 6. Global Cleanroom Lighting Industry Analysis, Insights and Forecast, 2021-2033
- 6.1. Market Analysis, Insights and Forecast - by Light Source
- 6.1.1. LED
- 6.1.2. Fluorescent
- 6.2. Market Analysis, Insights and Forecast - by Mounting Type
- 6.2.1. Recessed
- 6.2.2. Surface Mount
- 6.3. Market Analysis, Insights and Forecast - by End-user Industry
- 6.3.1. Healthcare & Life Sciences
- 6.3.2. Electronics and Semiconductor
- 6.3.3. Food & Beverage
- 6.3.4. Other End-user Industries
- 6.1. Market Analysis, Insights and Forecast - by Light Source
- 7. North America Cleanroom Lighting Industry Analysis, Insights and Forecast, 2020-2032
- 7.1. Market Analysis, Insights and Forecast - by Light Source
- 7.1.1. LED
- 7.1.2. Fluorescent
- 7.2. Market Analysis, Insights and Forecast - by Mounting Type
- 7.2.1. Recessed
- 7.2.2. Surface Mount
- 7.3. Market Analysis, Insights and Forecast - by End-user Industry
- 7.3.1. Healthcare & Life Sciences
- 7.3.2. Electronics and Semiconductor
- 7.3.3. Food & Beverage
- 7.3.4. Other End-user Industries
- 7.1. Market Analysis, Insights and Forecast - by Light Source
- 8. Europe Cleanroom Lighting Industry Analysis, Insights and Forecast, 2020-2032
- 8.1. Market Analysis, Insights and Forecast - by Light Source
- 8.1.1. LED
- 8.1.2. Fluorescent
- 8.2. Market Analysis, Insights and Forecast - by Mounting Type
- 8.2.1. Recessed
- 8.2.2. Surface Mount
- 8.3. Market Analysis, Insights and Forecast - by End-user Industry
- 8.3.1. Healthcare & Life Sciences
- 8.3.2. Electronics and Semiconductor
- 8.3.3. Food & Beverage
- 8.3.4. Other End-user Industries
- 8.1. Market Analysis, Insights and Forecast - by Light Source
- 9. Asia Cleanroom Lighting Industry Analysis, Insights and Forecast, 2020-2032
- 9.1. Market Analysis, Insights and Forecast - by Light Source
- 9.1.1. LED
- 9.1.2. Fluorescent
- 9.2. Market Analysis, Insights and Forecast - by Mounting Type
- 9.2.1. Recessed
- 9.2.2. Surface Mount
- 9.3. Market Analysis, Insights and Forecast - by End-user Industry
- 9.3.1. Healthcare & Life Sciences
- 9.3.2. Electronics and Semiconductor
- 9.3.3. Food & Beverage
- 9.3.4. Other End-user Industries
- 9.1. Market Analysis, Insights and Forecast - by Light Source
- 10. Latin America Cleanroom Lighting Industry Analysis, Insights and Forecast, 2020-2032
- 10.1. Market Analysis, Insights and Forecast - by Light Source
- 10.1.1. LED
- 10.1.2. Fluorescent
- 10.2. Market Analysis, Insights and Forecast - by Mounting Type
- 10.2.1. Recessed
- 10.2.2. Surface Mount
- 10.3. Market Analysis, Insights and Forecast - by End-user Industry
- 10.3.1. Healthcare & Life Sciences
- 10.3.2. Electronics and Semiconductor
- 10.3.3. Food & Beverage
- 10.3.4. Other End-user Industries
- 10.1. Market Analysis, Insights and Forecast - by Light Source
- 11. Middle East and Africa Cleanroom Lighting Industry Analysis, Insights and Forecast, 2020-2032
- 11.1. Market Analysis, Insights and Forecast - by Light Source
- 11.1.1. LED
- 11.1.2. Fluorescent
- 11.2. Market Analysis, Insights and Forecast - by Mounting Type
- 11.2.1. Recessed
- 11.2.2. Surface Mount
- 11.3. Market Analysis, Insights and Forecast - by End-user Industry
- 11.3.1. Healthcare & Life Sciences
- 11.3.2. Electronics and Semiconductor
- 11.3.3. Food & Beverage
- 11.3.4. Other End-user Industries
- 11.1. Market Analysis, Insights and Forecast - by Light Source
- 12. Competitive Analysis
- 12.1. Company Profiles
- 12.1.1 Terra Universal Inc
- 12.1.1.1. Company Overview
- 12.1.1.2. Products
- 12.1.1.3. Company Financials
- 12.1.1.4. SWOT Analysis
- 12.1.2 Signify Holding
- 12.1.2.1. Company Overview
- 12.1.2.2. Products
- 12.1.2.3. Company Financials
- 12.1.2.4. SWOT Analysis
- 12.1.3 Eaton Corporation Inc
- 12.1.3.1. Company Overview
- 12.1.3.2. Products
- 12.1.3.3. Company Financials
- 12.1.3.4. SWOT Analysis
- 12.1.4 Wipro Lighting
- 12.1.4.1. Company Overview
- 12.1.4.2. Products
- 12.1.4.3. Company Financials
- 12.1.4.4. SWOT Analysis
- 12.1.5 Kenall Manufacturing
- 12.1.5.1. Company Overview
- 12.1.5.2. Products
- 12.1.5.3. Company Financials
- 12.1.5.4. SWOT Analysis
- 12.1.6 Solite Europe Ltd
- 12.1.6.1. Company Overview
- 12.1.6.2. Products
- 12.1.6.3. Company Financials
- 12.1.6.4. SWOT Analysis
- 12.1.7 LUG Light Factory Sp z o o
- 12.1.7.1. Company Overview
- 12.1.7.2. Products
- 12.1.7.3. Company Financials
- 12.1.7.4. SWOT Analysis
- 12.1.8 AB Fagerhult*List Not Exhaustive
- 12.1.8.1. Company Overview
- 12.1.8.2. Products
- 12.1.8.3. Company Financials
- 12.1.8.4. SWOT Analysis
- 12.1.9 Crompton Greaves Consumer Electricals Ltd
- 12.1.9.1. Company Overview
- 12.1.9.2. Products
- 12.1.9.3. Company Financials
- 12.1.9.4. SWOT Analysis
- 12.1.10 Paramount Industries
- 12.1.10.1. Company Overview
- 12.1.10.2. Products
- 12.1.10.3. Company Financials
- 12.1.10.4. SWOT Analysis
- 12.1.1 Terra Universal Inc
- 12.2. Market Entropy
- 12.2.1 Company's Key Areas Served
- 12.2.2 Recent Developments
- 12.3. Company Market Share Analysis 2025
- 12.3.1 Top 5 Companies Market Share Analysis
- 12.3.2 Top 3 Companies Market Share Analysis
- 12.4. List of Potential Customers
- 13. Research Methodology
List of Figures
- Figure 1: Global Cleanroom Lighting Industry Revenue Breakdown (Million, %) by Region 2025 & 2033
- Figure 2: North America Cleanroom Lighting Industry Revenue (Million), by Light Source 2025 & 2033
- Figure 3: North America Cleanroom Lighting Industry Revenue Share (%), by Light Source 2025 & 2033
- Figure 4: North America Cleanroom Lighting Industry Revenue (Million), by Mounting Type 2025 & 2033
- Figure 5: North America Cleanroom Lighting Industry Revenue Share (%), by Mounting Type 2025 & 2033
- Figure 6: North America Cleanroom Lighting Industry Revenue (Million), by End-user Industry 2025 & 2033
- Figure 7: North America Cleanroom Lighting Industry Revenue Share (%), by End-user Industry 2025 & 2033
- Figure 8: North America Cleanroom Lighting Industry Revenue (Million), by Country 2025 & 2033
- Figure 9: North America Cleanroom Lighting Industry Revenue Share (%), by Country 2025 & 2033
- Figure 10: Europe Cleanroom Lighting Industry Revenue (Million), by Light Source 2025 & 2033
- Figure 11: Europe Cleanroom Lighting Industry Revenue Share (%), by Light Source 2025 & 2033
- Figure 12: Europe Cleanroom Lighting Industry Revenue (Million), by Mounting Type 2025 & 2033
- Figure 13: Europe Cleanroom Lighting Industry Revenue Share (%), by Mounting Type 2025 & 2033
- Figure 14: Europe Cleanroom Lighting Industry Revenue (Million), by End-user Industry 2025 & 2033
- Figure 15: Europe Cleanroom Lighting Industry Revenue Share (%), by End-user Industry 2025 & 2033
- Figure 16: Europe Cleanroom Lighting Industry Revenue (Million), by Country 2025 & 2033
- Figure 17: Europe Cleanroom Lighting Industry Revenue Share (%), by Country 2025 & 2033
- Figure 18: Asia Cleanroom Lighting Industry Revenue (Million), by Light Source 2025 & 2033
- Figure 19: Asia Cleanroom Lighting Industry Revenue Share (%), by Light Source 2025 & 2033
- Figure 20: Asia Cleanroom Lighting Industry Revenue (Million), by Mounting Type 2025 & 2033
- Figure 21: Asia Cleanroom Lighting Industry Revenue Share (%), by Mounting Type 2025 & 2033
- Figure 22: Asia Cleanroom Lighting Industry Revenue (Million), by End-user Industry 2025 & 2033
- Figure 23: Asia Cleanroom Lighting Industry Revenue Share (%), by End-user Industry 2025 & 2033
- Figure 24: Asia Cleanroom Lighting Industry Revenue (Million), by Country 2025 & 2033
- Figure 25: Asia Cleanroom Lighting Industry Revenue Share (%), by Country 2025 & 2033
- Figure 26: Latin America Cleanroom Lighting Industry Revenue (Million), by Light Source 2025 & 2033
- Figure 27: Latin America Cleanroom Lighting Industry Revenue Share (%), by Light Source 2025 & 2033
- Figure 28: Latin America Cleanroom Lighting Industry Revenue (Million), by Mounting Type 2025 & 2033
- Figure 29: Latin America Cleanroom Lighting Industry Revenue Share (%), by Mounting Type 2025 & 2033
- Figure 30: Latin America Cleanroom Lighting Industry Revenue (Million), by End-user Industry 2025 & 2033
- Figure 31: Latin America Cleanroom Lighting Industry Revenue Share (%), by End-user Industry 2025 & 2033
- Figure 32: Latin America Cleanroom Lighting Industry Revenue (Million), by Country 2025 & 2033
- Figure 33: Latin America Cleanroom Lighting Industry Revenue Share (%), by Country 2025 & 2033
- Figure 34: Middle East and Africa Cleanroom Lighting Industry Revenue (Million), by Light Source 2025 & 2033
- Figure 35: Middle East and Africa Cleanroom Lighting Industry Revenue Share (%), by Light Source 2025 & 2033
- Figure 36: Middle East and Africa Cleanroom Lighting Industry Revenue (Million), by Mounting Type 2025 & 2033
- Figure 37: Middle East and Africa Cleanroom Lighting Industry Revenue Share (%), by Mounting Type 2025 & 2033
- Figure 38: Middle East and Africa Cleanroom Lighting Industry Revenue (Million), by End-user Industry 2025 & 2033
- Figure 39: Middle East and Africa Cleanroom Lighting Industry Revenue Share (%), by End-user Industry 2025 & 2033
- Figure 40: Middle East and Africa Cleanroom Lighting Industry Revenue (Million), by Country 2025 & 2033
- Figure 41: Middle East and Africa Cleanroom Lighting Industry Revenue Share (%), by Country 2025 & 2033
List of Tables
- Table 1: Global Cleanroom Lighting Industry Revenue Million Forecast, by Light Source 2020 & 2033
- Table 2: Global Cleanroom Lighting Industry Revenue Million Forecast, by Mounting Type 2020 & 2033
- Table 3: Global Cleanroom Lighting Industry Revenue Million Forecast, by End-user Industry 2020 & 2033
- Table 4: Global Cleanroom Lighting Industry Revenue Million Forecast, by Region 2020 & 2033
- Table 5: Global Cleanroom Lighting Industry Revenue Million Forecast, by Light Source 2020 & 2033
- Table 6: Global Cleanroom Lighting Industry Revenue Million Forecast, by Mounting Type 2020 & 2033
- Table 7: Global Cleanroom Lighting Industry Revenue Million Forecast, by End-user Industry 2020 & 2033
- Table 8: Global Cleanroom Lighting Industry Revenue Million Forecast, by Country 2020 & 2033
- Table 9: Global Cleanroom Lighting Industry Revenue Million Forecast, by Light Source 2020 & 2033
- Table 10: Global Cleanroom Lighting Industry Revenue Million Forecast, by Mounting Type 2020 & 2033
- Table 11: Global Cleanroom Lighting Industry Revenue Million Forecast, by End-user Industry 2020 & 2033
- Table 12: Global Cleanroom Lighting Industry Revenue Million Forecast, by Country 2020 & 2033
- Table 13: Global Cleanroom Lighting Industry Revenue Million Forecast, by Light Source 2020 & 2033
- Table 14: Global Cleanroom Lighting Industry Revenue Million Forecast, by Mounting Type 2020 & 2033
- Table 15: Global Cleanroom Lighting Industry Revenue Million Forecast, by End-user Industry 2020 & 2033
- Table 16: Global Cleanroom Lighting Industry Revenue Million Forecast, by Country 2020 & 2033
- Table 17: Global Cleanroom Lighting Industry Revenue Million Forecast, by Light Source 2020 & 2033
- Table 18: Global Cleanroom Lighting Industry Revenue Million Forecast, by Mounting Type 2020 & 2033
- Table 19: Global Cleanroom Lighting Industry Revenue Million Forecast, by End-user Industry 2020 & 2033
- Table 20: Global Cleanroom Lighting Industry Revenue Million Forecast, by Country 2020 & 2033
- Table 21: Global Cleanroom Lighting Industry Revenue Million Forecast, by Light Source 2020 & 2033
- Table 22: Global Cleanroom Lighting Industry Revenue Million Forecast, by Mounting Type 2020 & 2033
- Table 23: Global Cleanroom Lighting Industry Revenue Million Forecast, by End-user Industry 2020 & 2033
- Table 24: Global Cleanroom Lighting Industry Revenue Million Forecast, by Country 2020 & 2033
Frequently Asked Questions
1. What is the projected Compound Annual Growth Rate (CAGR) of the Cleanroom Lighting Industry?
The projected CAGR is approximately 5.49%.
2. Which companies are prominent players in the Cleanroom Lighting Industry?
Key companies in the market include Terra Universal Inc, Signify Holding, Eaton Corporation Inc, Wipro Lighting, Kenall Manufacturing, Solite Europe Ltd, LUG Light Factory Sp z o o, AB Fagerhult*List Not Exhaustive, Crompton Greaves Consumer Electricals Ltd, Paramount Industries.
3. What are the main segments of the Cleanroom Lighting Industry?
The market segments include Light Source, Mounting Type, End-user Industry.
4. Can you provide details about the market size?
The market size is estimated to be USD 0.84 Million as of 2022.
5. What are some drivers contributing to market growth?
Stringent Regulations in Healthcare and Food Processing Industries; Rising Demand for Sterile Manufacturing Areas in Pharmaceuticals Industry.
6. What are the notable trends driving market growth?
Healthcare and Life Sciences Segment is Expected to Witness Significant Growth.
7. Are there any restraints impacting market growth?
High Cost Associated With Cleanrooms and their Operations.
8. Can you provide examples of recent developments in the market?
December 2022: Nicomac Taikisha Cleanrooms announced an investment of INR 126.2 crore (USD 15.2 million) to set up its third manufacturing facility in Hyderabad, India. Taikisha is a significant provider of cleanrooms and HVAC systems for electronic devices, the food industry, lithium-ion battery manufacturing, and hydroponic farming. The company also manufactures and constructs cleanroom facilities for pharmaceuticals and vaccines in sterile industries.
9. What pricing options are available for accessing the report?
Pricing options include single-user, multi-user, and enterprise licenses priced at USD 4750, USD 5250, and USD 8750 respectively.
10. Is the market size provided in terms of value or volume?
The market size is provided in terms of value, measured in Million.
11. Are there any specific market keywords associated with the report?
Yes, the market keyword associated with the report is "Cleanroom Lighting Industry," which aids in identifying and referencing the specific market segment covered.
12. How do I determine which pricing option suits my needs best?
The pricing options vary based on user requirements and access needs. Individual users may opt for single-user licenses, while businesses requiring broader access may choose multi-user or enterprise licenses for cost-effective access to the report.
13. Are there any additional resources or data provided in the Cleanroom Lighting Industry report?
While the report offers comprehensive insights, it's advisable to review the specific contents or supplementary materials provided to ascertain if additional resources or data are available.
14. How can I stay updated on further developments or reports in the Cleanroom Lighting Industry?
To stay informed about further developments, trends, and reports in the Cleanroom Lighting Industry, consider subscribing to industry newsletters, following relevant companies and organizations, or regularly checking reputable industry news sources and publications.
Methodology
Step 1 - Identification of Relevant Samples Size from Population Database


Step 2 - Approaches for Defining Global Market Size (Value, Volume* & Price*)

Note*: In applicable scenarios
Step 3 - Data Sources
Primary Research
- Web Analytics
- Survey Reports
- Research Institute
- Latest Research Reports
- Opinion Leaders
Secondary Research
- Annual Reports
- White Paper
- Latest Press Release
- Industry Association
- Paid Database
- Investor Presentations

Step 4 - Data Triangulation
Involves using different sources of information in order to increase the validity of a study
These sources are likely to be stakeholders in a program - participants, other researchers, program staff, other community members, and so on.
Then we put all data in single framework & apply various statistical tools to find out the dynamic on the market.
During the analysis stage, feedback from the stakeholder groups would be compared to determine areas of agreement as well as areas of divergence