

Key Insights
The global market for meat alternatives flavors is experiencing robust growth, driven by the increasing popularity of plant-based diets and the rising demand for sustainable and ethical food choices. The market is projected to reach a substantial size, with a considerable compound annual growth rate (CAGR) over the forecast period (2025-2033). Key drivers include the growing awareness of health benefits associated with reduced meat consumption, increasing concerns about the environmental impact of animal agriculture, and the rising number of vegetarians and vegans globally. Technological advancements in flavor creation, allowing for the development of more realistic and appealing meat-alternative flavors, are further propelling market expansion. While challenges remain, such as maintaining cost competitiveness with traditional meat products and ensuring consistent flavor profiles across different meat alternatives, the overall market outlook remains positive. Major players like Givaudan, Firmenich, and Symrise are heavily invested in research and development, focusing on creating innovative and authentic flavors that cater to diverse consumer preferences. The market is segmented by various flavor profiles (e.g., beef, chicken, pork), product applications (e.g., burgers, sausages, nuggets), and geographic regions. The North American and European markets currently hold significant shares, but Asia-Pacific is anticipated to witness substantial growth due to rising disposable incomes and changing dietary habits.
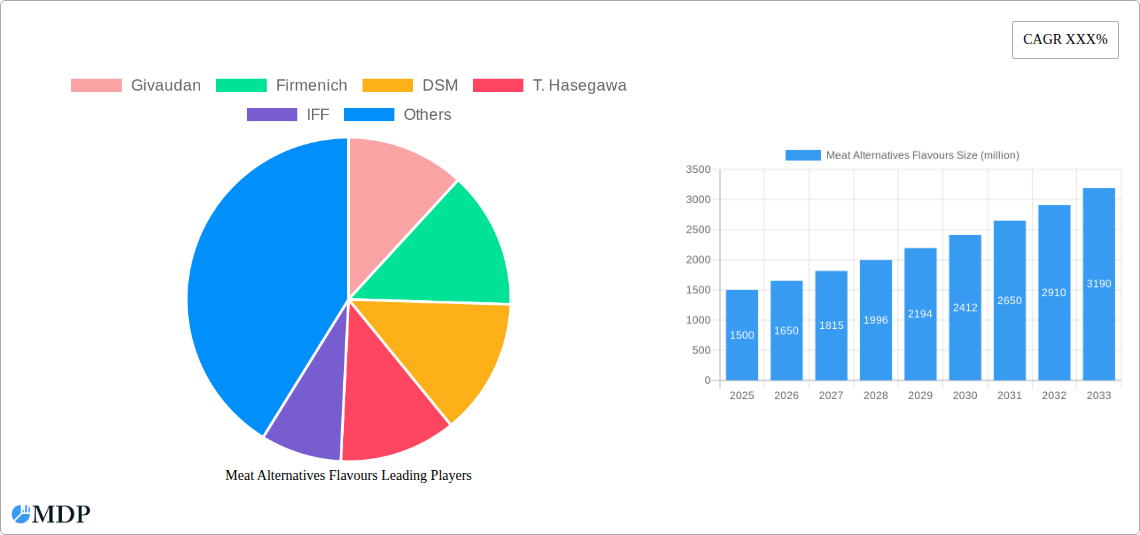
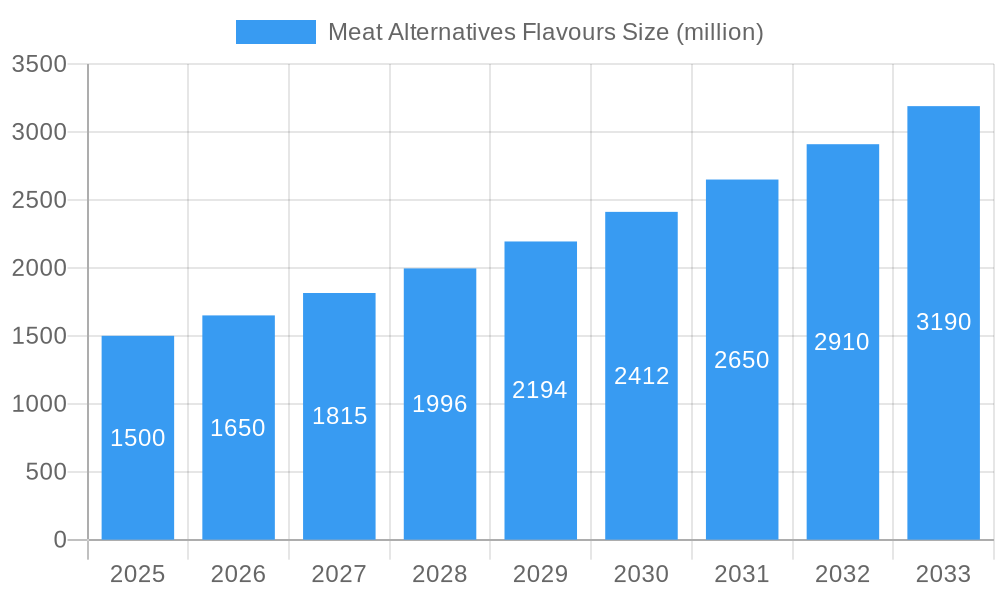
Meat Alternatives Flavours Market Size (In Billion)
The competitive landscape is characterized by both large multinational corporations and smaller specialized flavor houses. Successful companies are those that can effectively balance innovation with cost-efficiency, ensuring high-quality products while remaining competitive in pricing. The strategic partnerships between flavor companies and meat alternative producers are also crucial for the continued growth of the market. Future growth will depend on factors such as continued consumer demand for plant-based options, regulatory developments affecting the meat alternatives industry, and the continued development of innovative flavor technologies that can replicate the complex taste profiles of meat. The market's success will hinge on providing superior flavor experiences that resonate with consumers who are not just looking for healthy or sustainable food but also expect delicious and satisfying alternatives.
Meat Alternatives Flavours Company Market Share
Meat Alternatives Flavors Market Report: A Comprehensive Analysis (2019-2033)
This comprehensive report provides an in-depth analysis of the Meat Alternatives Flavors market, projecting a market valuation of $XX million by 2033. The report covers the period from 2019 to 2033, with a focus on the 2025-2033 forecast period. It meticulously examines market dynamics, leading players, emerging trends, and future opportunities, providing crucial insights for industry stakeholders, investors, and businesses operating within this rapidly expanding sector. Discover actionable strategies and navigate the complexities of this dynamic market with our data-driven analysis.
Meat Alternatives Flavours Market Dynamics & Concentration
The global meat alternatives flavors market, valued at $XX million in 2025, is characterized by a moderately concentrated landscape. Key players, including Givaudan, Firmenich, DSM, and IFF, hold significant market share, driven by their extensive R&D capabilities and global distribution networks. However, the market also accommodates several smaller, specialized companies like Foodie Flavors and Trilogy Flavors focusing on niche applications and innovative flavor profiles.
Market Concentration: The Herfindahl-Hirschman Index (HHI) for the market is estimated at XX, suggesting a moderately concentrated market with potential for both consolidation and diversification.
Innovation Drivers: Consumer demand for authentic meat-like flavors and textures fuels innovation in flavor technology, leading to the development of complex flavor profiles that mimic the nuances of various meat types. This includes the use of advanced extraction techniques and innovative flavor compounds.
Regulatory Frameworks: Stringent food safety regulations and labeling requirements across different geographies influence product development and market entry strategies. Compliance with these regulations is crucial for market participation.
Product Substitutes: The emergence of alternative protein sources like insect protein and cultivated meat may present both opportunities and challenges for the meat alternatives flavor market. However, many of these products would still need innovative flavor compounds.
End-User Trends: Growing consumer awareness of health and sustainability is driving the adoption of meat alternatives, in turn boosting demand for flavors that enhance the sensory appeal of these products.
M&A Activities: Over the historical period (2019-2024), approximately XX M&A deals were recorded in the meat alternatives flavors industry, indicating a dynamic market prone to consolidation. The estimated forecast shows around XX M&A deals during the forecast period.
Meat Alternatives Flavours Industry Trends & Analysis
The meat alternatives flavors market is experiencing robust growth, with a projected CAGR of XX% during the forecast period (2025-2033). This growth is fueled by several key trends:
- Technological Disruptions: Advancements in flavor chemistry and biotechnology are leading to the creation of more complex and realistic meat-like flavors, improving the overall consumer experience. This includes the use of precision fermentation for creating flavor molecules.
- Consumer Preferences: Rising health consciousness, environmental concerns, and ethical considerations are driving increased demand for plant-based and alternative protein sources. The market penetration of meat alternatives is expected to reach XX% by 2033.
- Competitive Dynamics: The market is witnessing increased competition among both established flavor houses and emerging specialty companies, resulting in product differentiation and innovation.
- Market Growth Drivers: The expanding global population, coupled with increasing disposable incomes in emerging economies, further contributes to the growth of this market. The rising adoption of vegan and vegetarian lifestyles plays a vital role.
Leading Markets & Segments in Meat Alternatives Flavours
The North American market currently dominates the global meat alternatives flavors market, driven by high consumer demand for plant-based products and a well-established infrastructure for food processing and distribution. Asia-Pacific is expected to experience significant growth due to expanding vegetarian and vegan populations, improving economies, and increasing demand for plant based proteins.
Key Drivers for North American Dominance:
- Strong regulatory framework encouraging innovation.
- High levels of venture capital investment in the plant-based food sector.
- Strong consumer awareness of health and environmental issues related to traditional meat consumption.
Key Drivers for Asia-Pacific Growth:
- Increasing disposable incomes, particularly in China and India.
- Government initiatives promoting sustainable food systems.
- Rising adoption of vegetarian and vegan lifestyles.
A detailed analysis of the regional and segment-wise market share will be incorporated within the full report.
Meat Alternatives Flavours Product Developments
Recent product innovations include the development of more complex flavor profiles that mimic the taste and aroma of specific meat cuts, such as beef, pork, and chicken. These innovations often utilize combinations of natural and artificial flavoring agents to achieve realistic sensory experiences. Technological advancements in fermentation and extraction processes, along with the use of artificial intelligence and machine learning, are accelerating the pace of flavor creation and optimization.
Key Drivers of Meat Alternatives Flavours Growth
Several factors fuel the growth of the meat alternatives flavors market:
- Technological Advancements: Precision fermentation and other biotechnological breakthroughs are enabling the creation of more authentic and complex flavors.
- Economic Factors: The rising disposable incomes in developing countries increase the affordability of meat alternatives.
- Regulatory Support: Government regulations supporting sustainable food systems, particularly in several European countries, are further bolstering market growth.
Challenges in the Meat Alternatives Flavours Market
The meat alternatives flavors market faces certain challenges:
- Regulatory Hurdles: Differing food safety regulations across countries create complexities in product standardization and market access.
- Supply Chain Issues: Fluctuations in the supply of raw materials needed for flavor production can impact production costs and timelines.
- Competitive Pressures: The market’s competitive nature demands constant innovation and cost optimization to maintain market share.
Emerging Opportunities in Meat Alternatives Flavours
The future holds immense potential for growth in this market. Technological breakthroughs, strategic alliances between flavor houses and food technology companies, and expansions into new geographic markets will offer lucrative opportunities. The continued development of novel flavor profiles for existing meat alternatives, as well as the creation of flavors for emerging alternative proteins, presents vast untapped potential.
Leading Players in the Meat Alternatives Flavours Sector
- Givaudan
- Firmenich
- DSM
- T. Hasegawa
- IFF
- Symrise
- Ajinomoto
- Takasago
- Kerry Group
- Wixon
- Foodie Flavors
- Ohly
- Trilogy Flavors
- Flavor Products
- Synergy Flavors
- Flavorjen
- RC Fine Foods
- Plant-Ex
- Mane
- Sensient Food Colors
- Robertet Canada
- Fuchs North America
- Bell Flavors & Fragrances
- Angel
Key Milestones in Meat Alternatives Flavours Industry
- 2020: Launch of several innovative meat alternative products with enhanced flavor profiles by major food companies.
- 2021: Significant investments in R&D for meat alternative flavor technology by leading flavor houses.
- 2022: Several strategic partnerships formed between flavor companies and plant-based food producers.
- 2023: Introduction of new flavoring technologies based on precision fermentation and cell-cultured ingredients.
- 2024: Increased regulatory scrutiny related to the labeling and marketing of meat alternatives.
Strategic Outlook for Meat Alternatives Flavours Market
The meat alternatives flavors market is poised for substantial growth, driven by increasing consumer demand and continuous innovation in flavor technology. Strategic partnerships, expansion into emerging markets, and the development of next-generation flavor solutions will be essential for success in this dynamic sector. Companies that prioritize sustainability, consumer health, and technological advancements will be best positioned to capitalize on the market's long-term growth potential.
Meat Alternatives Flavours Segmentation
-
1. Application
- 1.1. Commercial
- 1.2. Household
-
2. Type
- 2.1. Liquid Flavours
- 2.2. Powder Flavours
Meat Alternatives Flavours Segmentation By Geography
-
1. North America
- 1.1. United States
- 1.2. Canada
- 1.3. Mexico
-
2. South America
- 2.1. Brazil
- 2.2. Argentina
- 2.3. Rest of South America
-
3. Europe
- 3.1. United Kingdom
- 3.2. Germany
- 3.3. France
- 3.4. Italy
- 3.5. Spain
- 3.6. Russia
- 3.7. Benelux
- 3.8. Nordics
- 3.9. Rest of Europe
-
4. Middle East & Africa
- 4.1. Turkey
- 4.2. Israel
- 4.3. GCC
- 4.4. North Africa
- 4.5. South Africa
- 4.6. Rest of Middle East & Africa
-
5. Asia Pacific
- 5.1. China
- 5.2. India
- 5.3. Japan
- 5.4. South Korea
- 5.5. ASEAN
- 5.6. Oceania
- 5.7. Rest of Asia Pacific

Meat Alternatives Flavours Regional Market Share
Geographic Coverage of Meat Alternatives Flavours
Meat Alternatives Flavours REPORT HIGHLIGHTS
| Aspects | Details |
|---|---|
| Study Period | 2020-2034 |
| Base Year | 2025 |
| Estimated Year | 2026 |
| Forecast Period | 2026-2034 |
| Historical Period | 2020-2025 |
| Growth Rate | CAGR of 4.8% from 2020-2034 |
| Segmentation |
|
Table of Contents
- 1. Introduction
- 1.1. Research Scope
- 1.2. Market Segmentation
- 1.3. Research Objective
- 1.4. Definitions and Assumptions
- 2. Executive Summary
- 2.1. Market Snapshot
- 3. Market Dynamics
- 3.1. Market Drivers
- 3.2. Market Restrains
- 3.3. Market Trends
- 3.4. Market Opportunities
- 4. Market Factor Analysis
- 4.1. Porters Five Forces
- 4.1.1. Bargaining Power of Suppliers
- 4.1.2. Bargaining Power of Buyers
- 4.1.3. Threat of New Entrants
- 4.1.4. Threat of Substitutes
- 4.1.5. Competitive Rivalry
- 4.2. PESTEL analysis
- 4.3. BCG Analysis
- 4.3.1. Stars (High Growth, High Market Share)
- 4.3.2. Cash Cows (Low Growth, High Market Share)
- 4.3.3. Question Mark (High Growth, Low Market Share)
- 4.3.4. Dogs (Low Growth, Low Market Share)
- 4.4. Ansoff Matrix Analysis
- 4.5. Supply Chain Analysis
- 4.6. Regulatory Landscape
- 4.7. Current Market Potential and Opportunity Assessment (TAM–SAM–SOM Framework)
- 4.8. MDP Analyst Note
- 4.1. Porters Five Forces
- 5. Market Analysis, Insights and Forecast 2021-2033
- 5.1. Market Analysis, Insights and Forecast - by Application
- 5.1.1. Commercial
- 5.1.2. Household
- 5.2. Market Analysis, Insights and Forecast - by Type
- 5.2.1. Liquid Flavours
- 5.2.2. Powder Flavours
- 5.3. Market Analysis, Insights and Forecast - by Region
- 5.3.1. North America
- 5.3.2. South America
- 5.3.3. Europe
- 5.3.4. Middle East & Africa
- 5.3.5. Asia Pacific
- 5.1. Market Analysis, Insights and Forecast - by Application
- 6. Global Meat Alternatives Flavours Analysis, Insights and Forecast, 2021-2033
- 6.1. Market Analysis, Insights and Forecast - by Application
- 6.1.1. Commercial
- 6.1.2. Household
- 6.2. Market Analysis, Insights and Forecast - by Type
- 6.2.1. Liquid Flavours
- 6.2.2. Powder Flavours
- 6.1. Market Analysis, Insights and Forecast - by Application
- 7. North America Meat Alternatives Flavours Analysis, Insights and Forecast, 2020-2032
- 7.1. Market Analysis, Insights and Forecast - by Application
- 7.1.1. Commercial
- 7.1.2. Household
- 7.2. Market Analysis, Insights and Forecast - by Type
- 7.2.1. Liquid Flavours
- 7.2.2. Powder Flavours
- 7.1. Market Analysis, Insights and Forecast - by Application
- 8. South America Meat Alternatives Flavours Analysis, Insights and Forecast, 2020-2032
- 8.1. Market Analysis, Insights and Forecast - by Application
- 8.1.1. Commercial
- 8.1.2. Household
- 8.2. Market Analysis, Insights and Forecast - by Type
- 8.2.1. Liquid Flavours
- 8.2.2. Powder Flavours
- 8.1. Market Analysis, Insights and Forecast - by Application
- 9. Europe Meat Alternatives Flavours Analysis, Insights and Forecast, 2020-2032
- 9.1. Market Analysis, Insights and Forecast - by Application
- 9.1.1. Commercial
- 9.1.2. Household
- 9.2. Market Analysis, Insights and Forecast - by Type
- 9.2.1. Liquid Flavours
- 9.2.2. Powder Flavours
- 9.1. Market Analysis, Insights and Forecast - by Application
- 10. Middle East & Africa Meat Alternatives Flavours Analysis, Insights and Forecast, 2020-2032
- 10.1. Market Analysis, Insights and Forecast - by Application
- 10.1.1. Commercial
- 10.1.2. Household
- 10.2. Market Analysis, Insights and Forecast - by Type
- 10.2.1. Liquid Flavours
- 10.2.2. Powder Flavours
- 10.1. Market Analysis, Insights and Forecast - by Application
- 11. Asia Pacific Meat Alternatives Flavours Analysis, Insights and Forecast, 2020-2032
- 11.1. Market Analysis, Insights and Forecast - by Application
- 11.1.1. Commercial
- 11.1.2. Household
- 11.2. Market Analysis, Insights and Forecast - by Type
- 11.2.1. Liquid Flavours
- 11.2.2. Powder Flavours
- 11.1. Market Analysis, Insights and Forecast - by Application
- 12. Competitive Analysis
- 12.1. Company Profiles
- 12.1.1 Givaudan
- 12.1.1.1. Company Overview
- 12.1.1.2. Products
- 12.1.1.3. Company Financials
- 12.1.1.4. SWOT Analysis
- 12.1.2 Firmenich
- 12.1.2.1. Company Overview
- 12.1.2.2. Products
- 12.1.2.3. Company Financials
- 12.1.2.4. SWOT Analysis
- 12.1.3 DSM
- 12.1.3.1. Company Overview
- 12.1.3.2. Products
- 12.1.3.3. Company Financials
- 12.1.3.4. SWOT Analysis
- 12.1.4 T. Hasegawa
- 12.1.4.1. Company Overview
- 12.1.4.2. Products
- 12.1.4.3. Company Financials
- 12.1.4.4. SWOT Analysis
- 12.1.5 IFF
- 12.1.5.1. Company Overview
- 12.1.5.2. Products
- 12.1.5.3. Company Financials
- 12.1.5.4. SWOT Analysis
- 12.1.6 Symrise
- 12.1.6.1. Company Overview
- 12.1.6.2. Products
- 12.1.6.3. Company Financials
- 12.1.6.4. SWOT Analysis
- 12.1.7 Ajinomoto
- 12.1.7.1. Company Overview
- 12.1.7.2. Products
- 12.1.7.3. Company Financials
- 12.1.7.4. SWOT Analysis
- 12.1.8 Takasago
- 12.1.8.1. Company Overview
- 12.1.8.2. Products
- 12.1.8.3. Company Financials
- 12.1.8.4. SWOT Analysis
- 12.1.9 Kerry Group
- 12.1.9.1. Company Overview
- 12.1.9.2. Products
- 12.1.9.3. Company Financials
- 12.1.9.4. SWOT Analysis
- 12.1.10 Wixon
- 12.1.10.1. Company Overview
- 12.1.10.2. Products
- 12.1.10.3. Company Financials
- 12.1.10.4. SWOT Analysis
- 12.1.11 Foodie Flavors
- 12.1.11.1. Company Overview
- 12.1.11.2. Products
- 12.1.11.3. Company Financials
- 12.1.11.4. SWOT Analysis
- 12.1.12 Ohly
- 12.1.12.1. Company Overview
- 12.1.12.2. Products
- 12.1.12.3. Company Financials
- 12.1.12.4. SWOT Analysis
- 12.1.13 Trilogy Flavors
- 12.1.13.1. Company Overview
- 12.1.13.2. Products
- 12.1.13.3. Company Financials
- 12.1.13.4. SWOT Analysis
- 12.1.14 Flavor Products
- 12.1.14.1. Company Overview
- 12.1.14.2. Products
- 12.1.14.3. Company Financials
- 12.1.14.4. SWOT Analysis
- 12.1.15 Synergy Flavors
- 12.1.15.1. Company Overview
- 12.1.15.2. Products
- 12.1.15.3. Company Financials
- 12.1.15.4. SWOT Analysis
- 12.1.16 Flavorjen
- 12.1.16.1. Company Overview
- 12.1.16.2. Products
- 12.1.16.3. Company Financials
- 12.1.16.4. SWOT Analysis
- 12.1.17 RC Fine Foods
- 12.1.17.1. Company Overview
- 12.1.17.2. Products
- 12.1.17.3. Company Financials
- 12.1.17.4. SWOT Analysis
- 12.1.18 Plant-Ex
- 12.1.18.1. Company Overview
- 12.1.18.2. Products
- 12.1.18.3. Company Financials
- 12.1.18.4. SWOT Analysis
- 12.1.19 Mane
- 12.1.19.1. Company Overview
- 12.1.19.2. Products
- 12.1.19.3. Company Financials
- 12.1.19.4. SWOT Analysis
- 12.1.20 Sensient Food Colors
- 12.1.20.1. Company Overview
- 12.1.20.2. Products
- 12.1.20.3. Company Financials
- 12.1.20.4. SWOT Analysis
- 12.1.21 Robertet Canada
- 12.1.21.1. Company Overview
- 12.1.21.2. Products
- 12.1.21.3. Company Financials
- 12.1.21.4. SWOT Analysis
- 12.1.22 Fuchs North America
- 12.1.22.1. Company Overview
- 12.1.22.2. Products
- 12.1.22.3. Company Financials
- 12.1.22.4. SWOT Analysis
- 12.1.23 Bell Flavors & Fragrances
- 12.1.23.1. Company Overview
- 12.1.23.2. Products
- 12.1.23.3. Company Financials
- 12.1.23.4. SWOT Analysis
- 12.1.24 Angel
- 12.1.24.1. Company Overview
- 12.1.24.2. Products
- 12.1.24.3. Company Financials
- 12.1.24.4. SWOT Analysis
- 12.1.1 Givaudan
- 12.2. Market Entropy
- 12.2.1 Company's Key Areas Served
- 12.2.2 Recent Developments
- 12.3. Company Market Share Analysis 2025
- 12.3.1 Top 5 Companies Market Share Analysis
- 12.3.2 Top 3 Companies Market Share Analysis
- 12.4. List of Potential Customers
- 13. Research Methodology
List of Figures
- Figure 1: Global Meat Alternatives Flavours Revenue Breakdown (million, %) by Region 2025 & 2033
- Figure 2: Global Meat Alternatives Flavours Volume Breakdown (K, %) by Region 2025 & 2033
- Figure 3: North America Meat Alternatives Flavours Revenue (million), by Application 2025 & 2033
- Figure 4: North America Meat Alternatives Flavours Volume (K), by Application 2025 & 2033
- Figure 5: North America Meat Alternatives Flavours Revenue Share (%), by Application 2025 & 2033
- Figure 6: North America Meat Alternatives Flavours Volume Share (%), by Application 2025 & 2033
- Figure 7: North America Meat Alternatives Flavours Revenue (million), by Type 2025 & 2033
- Figure 8: North America Meat Alternatives Flavours Volume (K), by Type 2025 & 2033
- Figure 9: North America Meat Alternatives Flavours Revenue Share (%), by Type 2025 & 2033
- Figure 10: North America Meat Alternatives Flavours Volume Share (%), by Type 2025 & 2033
- Figure 11: North America Meat Alternatives Flavours Revenue (million), by Country 2025 & 2033
- Figure 12: North America Meat Alternatives Flavours Volume (K), by Country 2025 & 2033
- Figure 13: North America Meat Alternatives Flavours Revenue Share (%), by Country 2025 & 2033
- Figure 14: North America Meat Alternatives Flavours Volume Share (%), by Country 2025 & 2033
- Figure 15: South America Meat Alternatives Flavours Revenue (million), by Application 2025 & 2033
- Figure 16: South America Meat Alternatives Flavours Volume (K), by Application 2025 & 2033
- Figure 17: South America Meat Alternatives Flavours Revenue Share (%), by Application 2025 & 2033
- Figure 18: South America Meat Alternatives Flavours Volume Share (%), by Application 2025 & 2033
- Figure 19: South America Meat Alternatives Flavours Revenue (million), by Type 2025 & 2033
- Figure 20: South America Meat Alternatives Flavours Volume (K), by Type 2025 & 2033
- Figure 21: South America Meat Alternatives Flavours Revenue Share (%), by Type 2025 & 2033
- Figure 22: South America Meat Alternatives Flavours Volume Share (%), by Type 2025 & 2033
- Figure 23: South America Meat Alternatives Flavours Revenue (million), by Country 2025 & 2033
- Figure 24: South America Meat Alternatives Flavours Volume (K), by Country 2025 & 2033
- Figure 25: South America Meat Alternatives Flavours Revenue Share (%), by Country 2025 & 2033
- Figure 26: South America Meat Alternatives Flavours Volume Share (%), by Country 2025 & 2033
- Figure 27: Europe Meat Alternatives Flavours Revenue (million), by Application 2025 & 2033
- Figure 28: Europe Meat Alternatives Flavours Volume (K), by Application 2025 & 2033
- Figure 29: Europe Meat Alternatives Flavours Revenue Share (%), by Application 2025 & 2033
- Figure 30: Europe Meat Alternatives Flavours Volume Share (%), by Application 2025 & 2033
- Figure 31: Europe Meat Alternatives Flavours Revenue (million), by Type 2025 & 2033
- Figure 32: Europe Meat Alternatives Flavours Volume (K), by Type 2025 & 2033
- Figure 33: Europe Meat Alternatives Flavours Revenue Share (%), by Type 2025 & 2033
- Figure 34: Europe Meat Alternatives Flavours Volume Share (%), by Type 2025 & 2033
- Figure 35: Europe Meat Alternatives Flavours Revenue (million), by Country 2025 & 2033
- Figure 36: Europe Meat Alternatives Flavours Volume (K), by Country 2025 & 2033
- Figure 37: Europe Meat Alternatives Flavours Revenue Share (%), by Country 2025 & 2033
- Figure 38: Europe Meat Alternatives Flavours Volume Share (%), by Country 2025 & 2033
- Figure 39: Middle East & Africa Meat Alternatives Flavours Revenue (million), by Application 2025 & 2033
- Figure 40: Middle East & Africa Meat Alternatives Flavours Volume (K), by Application 2025 & 2033
- Figure 41: Middle East & Africa Meat Alternatives Flavours Revenue Share (%), by Application 2025 & 2033
- Figure 42: Middle East & Africa Meat Alternatives Flavours Volume Share (%), by Application 2025 & 2033
- Figure 43: Middle East & Africa Meat Alternatives Flavours Revenue (million), by Type 2025 & 2033
- Figure 44: Middle East & Africa Meat Alternatives Flavours Volume (K), by Type 2025 & 2033
- Figure 45: Middle East & Africa Meat Alternatives Flavours Revenue Share (%), by Type 2025 & 2033
- Figure 46: Middle East & Africa Meat Alternatives Flavours Volume Share (%), by Type 2025 & 2033
- Figure 47: Middle East & Africa Meat Alternatives Flavours Revenue (million), by Country 2025 & 2033
- Figure 48: Middle East & Africa Meat Alternatives Flavours Volume (K), by Country 2025 & 2033
- Figure 49: Middle East & Africa Meat Alternatives Flavours Revenue Share (%), by Country 2025 & 2033
- Figure 50: Middle East & Africa Meat Alternatives Flavours Volume Share (%), by Country 2025 & 2033
- Figure 51: Asia Pacific Meat Alternatives Flavours Revenue (million), by Application 2025 & 2033
- Figure 52: Asia Pacific Meat Alternatives Flavours Volume (K), by Application 2025 & 2033
- Figure 53: Asia Pacific Meat Alternatives Flavours Revenue Share (%), by Application 2025 & 2033
- Figure 54: Asia Pacific Meat Alternatives Flavours Volume Share (%), by Application 2025 & 2033
- Figure 55: Asia Pacific Meat Alternatives Flavours Revenue (million), by Type 2025 & 2033
- Figure 56: Asia Pacific Meat Alternatives Flavours Volume (K), by Type 2025 & 2033
- Figure 57: Asia Pacific Meat Alternatives Flavours Revenue Share (%), by Type 2025 & 2033
- Figure 58: Asia Pacific Meat Alternatives Flavours Volume Share (%), by Type 2025 & 2033
- Figure 59: Asia Pacific Meat Alternatives Flavours Revenue (million), by Country 2025 & 2033
- Figure 60: Asia Pacific Meat Alternatives Flavours Volume (K), by Country 2025 & 2033
- Figure 61: Asia Pacific Meat Alternatives Flavours Revenue Share (%), by Country 2025 & 2033
- Figure 62: Asia Pacific Meat Alternatives Flavours Volume Share (%), by Country 2025 & 2033
List of Tables
- Table 1: Global Meat Alternatives Flavours Revenue million Forecast, by Application 2020 & 2033
- Table 2: Global Meat Alternatives Flavours Volume K Forecast, by Application 2020 & 2033
- Table 3: Global Meat Alternatives Flavours Revenue million Forecast, by Type 2020 & 2033
- Table 4: Global Meat Alternatives Flavours Volume K Forecast, by Type 2020 & 2033
- Table 5: Global Meat Alternatives Flavours Revenue million Forecast, by Region 2020 & 2033
- Table 6: Global Meat Alternatives Flavours Volume K Forecast, by Region 2020 & 2033
- Table 7: Global Meat Alternatives Flavours Revenue million Forecast, by Application 2020 & 2033
- Table 8: Global Meat Alternatives Flavours Volume K Forecast, by Application 2020 & 2033
- Table 9: Global Meat Alternatives Flavours Revenue million Forecast, by Type 2020 & 2033
- Table 10: Global Meat Alternatives Flavours Volume K Forecast, by Type 2020 & 2033
- Table 11: Global Meat Alternatives Flavours Revenue million Forecast, by Country 2020 & 2033
- Table 12: Global Meat Alternatives Flavours Volume K Forecast, by Country 2020 & 2033
- Table 13: United States Meat Alternatives Flavours Revenue (million) Forecast, by Application 2020 & 2033
- Table 14: United States Meat Alternatives Flavours Volume (K) Forecast, by Application 2020 & 2033
- Table 15: Canada Meat Alternatives Flavours Revenue (million) Forecast, by Application 2020 & 2033
- Table 16: Canada Meat Alternatives Flavours Volume (K) Forecast, by Application 2020 & 2033
- Table 17: Mexico Meat Alternatives Flavours Revenue (million) Forecast, by Application 2020 & 2033
- Table 18: Mexico Meat Alternatives Flavours Volume (K) Forecast, by Application 2020 & 2033
- Table 19: Global Meat Alternatives Flavours Revenue million Forecast, by Application 2020 & 2033
- Table 20: Global Meat Alternatives Flavours Volume K Forecast, by Application 2020 & 2033
- Table 21: Global Meat Alternatives Flavours Revenue million Forecast, by Type 2020 & 2033
- Table 22: Global Meat Alternatives Flavours Volume K Forecast, by Type 2020 & 2033
- Table 23: Global Meat Alternatives Flavours Revenue million Forecast, by Country 2020 & 2033
- Table 24: Global Meat Alternatives Flavours Volume K Forecast, by Country 2020 & 2033
- Table 25: Brazil Meat Alternatives Flavours Revenue (million) Forecast, by Application 2020 & 2033
- Table 26: Brazil Meat Alternatives Flavours Volume (K) Forecast, by Application 2020 & 2033
- Table 27: Argentina Meat Alternatives Flavours Revenue (million) Forecast, by Application 2020 & 2033
- Table 28: Argentina Meat Alternatives Flavours Volume (K) Forecast, by Application 2020 & 2033
- Table 29: Rest of South America Meat Alternatives Flavours Revenue (million) Forecast, by Application 2020 & 2033
- Table 30: Rest of South America Meat Alternatives Flavours Volume (K) Forecast, by Application 2020 & 2033
- Table 31: Global Meat Alternatives Flavours Revenue million Forecast, by Application 2020 & 2033
- Table 32: Global Meat Alternatives Flavours Volume K Forecast, by Application 2020 & 2033
- Table 33: Global Meat Alternatives Flavours Revenue million Forecast, by Type 2020 & 2033
- Table 34: Global Meat Alternatives Flavours Volume K Forecast, by Type 2020 & 2033
- Table 35: Global Meat Alternatives Flavours Revenue million Forecast, by Country 2020 & 2033
- Table 36: Global Meat Alternatives Flavours Volume K Forecast, by Country 2020 & 2033
- Table 37: United Kingdom Meat Alternatives Flavours Revenue (million) Forecast, by Application 2020 & 2033
- Table 38: United Kingdom Meat Alternatives Flavours Volume (K) Forecast, by Application 2020 & 2033
- Table 39: Germany Meat Alternatives Flavours Revenue (million) Forecast, by Application 2020 & 2033
- Table 40: Germany Meat Alternatives Flavours Volume (K) Forecast, by Application 2020 & 2033
- Table 41: France Meat Alternatives Flavours Revenue (million) Forecast, by Application 2020 & 2033
- Table 42: France Meat Alternatives Flavours Volume (K) Forecast, by Application 2020 & 2033
- Table 43: Italy Meat Alternatives Flavours Revenue (million) Forecast, by Application 2020 & 2033
- Table 44: Italy Meat Alternatives Flavours Volume (K) Forecast, by Application 2020 & 2033
- Table 45: Spain Meat Alternatives Flavours Revenue (million) Forecast, by Application 2020 & 2033
- Table 46: Spain Meat Alternatives Flavours Volume (K) Forecast, by Application 2020 & 2033
- Table 47: Russia Meat Alternatives Flavours Revenue (million) Forecast, by Application 2020 & 2033
- Table 48: Russia Meat Alternatives Flavours Volume (K) Forecast, by Application 2020 & 2033
- Table 49: Benelux Meat Alternatives Flavours Revenue (million) Forecast, by Application 2020 & 2033
- Table 50: Benelux Meat Alternatives Flavours Volume (K) Forecast, by Application 2020 & 2033
- Table 51: Nordics Meat Alternatives Flavours Revenue (million) Forecast, by Application 2020 & 2033
- Table 52: Nordics Meat Alternatives Flavours Volume (K) Forecast, by Application 2020 & 2033
- Table 53: Rest of Europe Meat Alternatives Flavours Revenue (million) Forecast, by Application 2020 & 2033
- Table 54: Rest of Europe Meat Alternatives Flavours Volume (K) Forecast, by Application 2020 & 2033
- Table 55: Global Meat Alternatives Flavours Revenue million Forecast, by Application 2020 & 2033
- Table 56: Global Meat Alternatives Flavours Volume K Forecast, by Application 2020 & 2033
- Table 57: Global Meat Alternatives Flavours Revenue million Forecast, by Type 2020 & 2033
- Table 58: Global Meat Alternatives Flavours Volume K Forecast, by Type 2020 & 2033
- Table 59: Global Meat Alternatives Flavours Revenue million Forecast, by Country 2020 & 2033
- Table 60: Global Meat Alternatives Flavours Volume K Forecast, by Country 2020 & 2033
- Table 61: Turkey Meat Alternatives Flavours Revenue (million) Forecast, by Application 2020 & 2033
- Table 62: Turkey Meat Alternatives Flavours Volume (K) Forecast, by Application 2020 & 2033
- Table 63: Israel Meat Alternatives Flavours Revenue (million) Forecast, by Application 2020 & 2033
- Table 64: Israel Meat Alternatives Flavours Volume (K) Forecast, by Application 2020 & 2033
- Table 65: GCC Meat Alternatives Flavours Revenue (million) Forecast, by Application 2020 & 2033
- Table 66: GCC Meat Alternatives Flavours Volume (K) Forecast, by Application 2020 & 2033
- Table 67: North Africa Meat Alternatives Flavours Revenue (million) Forecast, by Application 2020 & 2033
- Table 68: North Africa Meat Alternatives Flavours Volume (K) Forecast, by Application 2020 & 2033
- Table 69: South Africa Meat Alternatives Flavours Revenue (million) Forecast, by Application 2020 & 2033
- Table 70: South Africa Meat Alternatives Flavours Volume (K) Forecast, by Application 2020 & 2033
- Table 71: Rest of Middle East & Africa Meat Alternatives Flavours Revenue (million) Forecast, by Application 2020 & 2033
- Table 72: Rest of Middle East & Africa Meat Alternatives Flavours Volume (K) Forecast, by Application 2020 & 2033
- Table 73: Global Meat Alternatives Flavours Revenue million Forecast, by Application 2020 & 2033
- Table 74: Global Meat Alternatives Flavours Volume K Forecast, by Application 2020 & 2033
- Table 75: Global Meat Alternatives Flavours Revenue million Forecast, by Type 2020 & 2033
- Table 76: Global Meat Alternatives Flavours Volume K Forecast, by Type 2020 & 2033
- Table 77: Global Meat Alternatives Flavours Revenue million Forecast, by Country 2020 & 2033
- Table 78: Global Meat Alternatives Flavours Volume K Forecast, by Country 2020 & 2033
- Table 79: China Meat Alternatives Flavours Revenue (million) Forecast, by Application 2020 & 2033
- Table 80: China Meat Alternatives Flavours Volume (K) Forecast, by Application 2020 & 2033
- Table 81: India Meat Alternatives Flavours Revenue (million) Forecast, by Application 2020 & 2033
- Table 82: India Meat Alternatives Flavours Volume (K) Forecast, by Application 2020 & 2033
- Table 83: Japan Meat Alternatives Flavours Revenue (million) Forecast, by Application 2020 & 2033
- Table 84: Japan Meat Alternatives Flavours Volume (K) Forecast, by Application 2020 & 2033
- Table 85: South Korea Meat Alternatives Flavours Revenue (million) Forecast, by Application 2020 & 2033
- Table 86: South Korea Meat Alternatives Flavours Volume (K) Forecast, by Application 2020 & 2033
- Table 87: ASEAN Meat Alternatives Flavours Revenue (million) Forecast, by Application 2020 & 2033
- Table 88: ASEAN Meat Alternatives Flavours Volume (K) Forecast, by Application 2020 & 2033
- Table 89: Oceania Meat Alternatives Flavours Revenue (million) Forecast, by Application 2020 & 2033
- Table 90: Oceania Meat Alternatives Flavours Volume (K) Forecast, by Application 2020 & 2033
- Table 91: Rest of Asia Pacific Meat Alternatives Flavours Revenue (million) Forecast, by Application 2020 & 2033
- Table 92: Rest of Asia Pacific Meat Alternatives Flavours Volume (K) Forecast, by Application 2020 & 2033
Frequently Asked Questions
1. What is the projected Compound Annual Growth Rate (CAGR) of the Meat Alternatives Flavours?
The projected CAGR is approximately 4.8%.
2. Which companies are prominent players in the Meat Alternatives Flavours?
Key companies in the market include Givaudan, Firmenich, DSM, T. Hasegawa, IFF, Symrise, Ajinomoto, Takasago, Kerry Group, Wixon, Foodie Flavors, Ohly, Trilogy Flavors, Flavor Products, Synergy Flavors, Flavorjen, RC Fine Foods, Plant-Ex, Mane, Sensient Food Colors, Robertet Canada, Fuchs North America, Bell Flavors & Fragrances, Angel.
3. What are the main segments of the Meat Alternatives Flavours?
The market segments include Application, Type.
4. Can you provide details about the market size?
The market size is estimated to be USD 10594.9 million as of 2022.
5. What are some drivers contributing to market growth?
N/A
6. What are the notable trends driving market growth?
N/A
7. Are there any restraints impacting market growth?
N/A
8. Can you provide examples of recent developments in the market?
N/A
9. What pricing options are available for accessing the report?
Pricing options include single-user, multi-user, and enterprise licenses priced at USD 3950.00, USD 5925.00, and USD 7900.00 respectively.
10. Is the market size provided in terms of value or volume?
The market size is provided in terms of value, measured in million and volume, measured in K.
11. Are there any specific market keywords associated with the report?
Yes, the market keyword associated with the report is "Meat Alternatives Flavours," which aids in identifying and referencing the specific market segment covered.
12. How do I determine which pricing option suits my needs best?
The pricing options vary based on user requirements and access needs. Individual users may opt for single-user licenses, while businesses requiring broader access may choose multi-user or enterprise licenses for cost-effective access to the report.
13. Are there any additional resources or data provided in the Meat Alternatives Flavours report?
While the report offers comprehensive insights, it's advisable to review the specific contents or supplementary materials provided to ascertain if additional resources or data are available.
14. How can I stay updated on further developments or reports in the Meat Alternatives Flavours?
To stay informed about further developments, trends, and reports in the Meat Alternatives Flavours, consider subscribing to industry newsletters, following relevant companies and organizations, or regularly checking reputable industry news sources and publications.
Methodology
Step 1 - Identification of Relevant Samples Size from Population Database


Step 2 - Approaches for Defining Global Market Size (Value, Volume* & Price*)

Note*: In applicable scenarios
Step 3 - Data Sources
Primary Research
- Web Analytics
- Survey Reports
- Research Institute
- Latest Research Reports
- Opinion Leaders
Secondary Research
- Annual Reports
- White Paper
- Latest Press Release
- Industry Association
- Paid Database
- Investor Presentations

Step 4 - Data Triangulation
Involves using different sources of information in order to increase the validity of a study
These sources are likely to be stakeholders in a program - participants, other researchers, program staff, other community members, and so on.
Then we put all data in single framework & apply various statistical tools to find out the dynamic on the market.
During the analysis stage, feedback from the stakeholder groups would be compared to determine areas of agreement as well as areas of divergence