

Key Insights
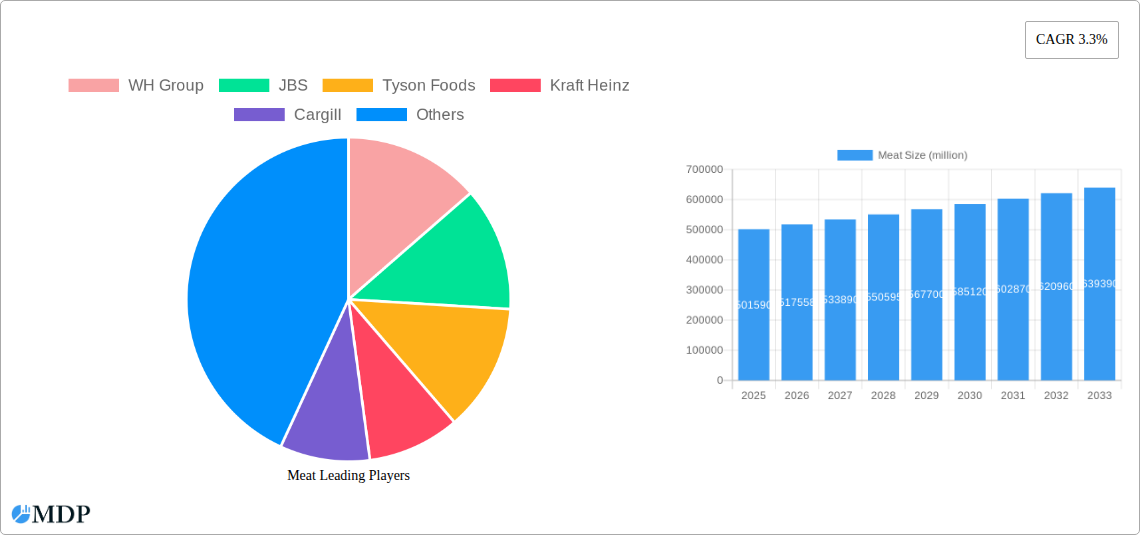
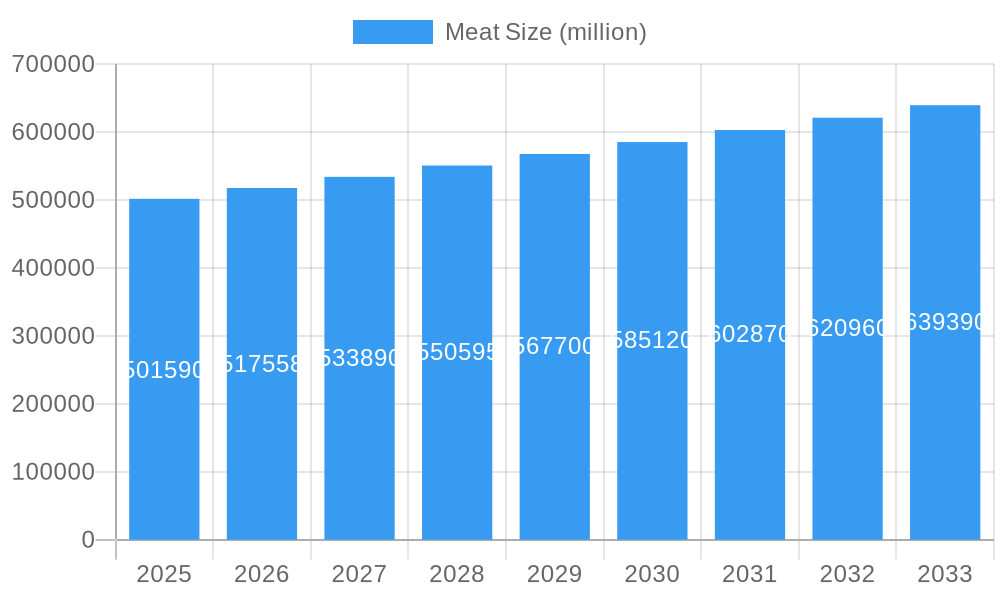
The global meat market, valued at $501.59 billion in 2025, is projected to experience steady growth, exhibiting a compound annual growth rate (CAGR) of 3.3% from 2025 to 2033. This growth is driven by several factors. Rising global populations and increasing per capita meat consumption, particularly in developing economies, are significant contributors. Changing dietary habits and preferences, although showing some movement towards plant-based alternatives, still largely favor meat products. Technological advancements in meat processing and packaging enhance efficiency, shelf life, and product quality, further bolstering market expansion. However, the market faces challenges. Growing concerns surrounding animal welfare and the environmental impact of meat production are prompting consumers to seek more sustainable options, potentially limiting growth in certain segments. Furthermore, fluctuations in feed prices and geopolitical instability can impact production costs and market stability. The competitive landscape is dominated by large multinational corporations, including WH Group, JBS, and Tyson Foods, which leverage their scale and distribution networks to maintain market share. However, the increasing presence of smaller, specialized producers focusing on niche markets, such as organic or sustainably raised meats, presents both opportunities and competitive pressures.
Meat Market Size (In Billion)
The segmentation of the meat market reveals significant variations in growth trajectories. While precise segmental data is unavailable, it's reasonable to assume that processed meat products may show stronger growth initially than fresh meat segments due to convenience and longer shelf-life. However, growing awareness of the health implications associated with processed meats might moderate this growth over the longer term. Regional variations will also be significant, with developing nations likely experiencing higher growth rates than mature markets. North America and Europe, while mature markets, will still contribute significantly to the overall market value due to their high per capita consumption. The forecast period, 2025-2033, will see continued consolidation in the industry, with larger players likely acquiring smaller companies to enhance their market position and expand their product portfolios. Strategic partnerships and investments in innovative technologies are also anticipated as companies strive to meet changing consumer demands and address sustainability concerns.
Meat Company Market Share
Meat Market Report: A Comprehensive Analysis (2019-2033)
This comprehensive report provides an in-depth analysis of the global meat market, offering invaluable insights for industry stakeholders, investors, and strategic decision-makers. With a study period spanning 2019-2033, a base year of 2025, and a forecast period of 2025-2033, this report leverages extensive data analysis to uncover key trends, challenges, and opportunities within this dynamic sector. The report covers over $xx million market size and projects future growth based on thorough research. This report will enable you to make well-informed decisions and gain a competitive edge in the global meat market.
Meat Market Dynamics & Concentration
The global meat market, valued at over $xx million in 2024, exhibits a moderately concentrated landscape dominated by a few major players. WH Group, JBS, Tyson Foods, and Cargill consistently hold significant market share, exceeding xx% collectively. The industry's dynamics are shaped by several key factors:
- Market Concentration: The top 10 players account for approximately xx% of global meat production, indicating a high level of consolidation. Mergers and acquisitions (M&A) activities have further intensified this concentration, with xx major deals recorded between 2019 and 2024.
- Innovation Drivers: Growing consumer demand for convenience, health-conscious options (e.g., leaner meats, plant-based alternatives), and sustainable production practices drives innovation in processing technologies, packaging, and product diversification.
- Regulatory Frameworks: Stringent food safety regulations, environmental concerns, and animal welfare standards significantly impact operational costs and business strategies. Variations in these regulations across different regions add complexity.
- Product Substitutes: The rise of plant-based meat alternatives poses a growing competitive challenge, although meat still dominates overall consumption. Other substitutes include insect-based proteins and lab-grown meat, still at nascent stages.
- End-User Trends: Changing dietary habits, health awareness, and increasing disposable incomes influence meat consumption patterns. Growing demand for processed and convenience meats is observed in many developing economies.
- M&A Activities: The past five years have seen significant M&A activity as larger players consolidate their market share and seek to expand their product portfolios and geographical reach. This trend is expected to continue, driving further industry consolidation.
Meat Industry Trends & Analysis
The global meat market is characterized by a complex interplay of factors that influence its trajectory. From 2019 to 2024, the market exhibited a Compound Annual Growth Rate (CAGR) of xx%, and this trend is anticipated to continue in the forecast period. This growth is attributed to several key factors:
- Market Growth Drivers: Rising global population, increasing urbanization, and evolving dietary preferences in developing economies are driving meat demand. Growing middle classes in many countries are increasing per capita meat consumption.
- Technological Disruptions: Automation in processing plants, advanced traceability systems, and precision livestock farming technologies are improving efficiency, sustainability, and food safety.
- Consumer Preferences: Consumers increasingly prioritize health, sustainability, and ethical sourcing, influencing demand for organic, grass-fed, and locally sourced meat products. This growing demand for transparency leads to a shift towards brands that provide robust traceability and sustainability initiatives.
- Competitive Dynamics: Intense competition among major players necessitates continuous innovation, strategic partnerships, and efficient supply chain management to maintain market share. Price fluctuations, especially in feed costs, have a significant impact on profitability.
Leading Markets & Segments in Meat
While the global meat market offers diverse segments, several regions and segments stand out for their dominant position. The XXX region emerges as the leading market, driven by several factors:
Key Drivers:
- High Meat Consumption: High per capita consumption rates compared to global averages.
- Robust Economy: Strong economic growth, leading to higher disposable incomes and increased purchasing power.
- Favorable Government Policies: Supportive agricultural policies and investments in infrastructure.
- Developed Distribution Network: Efficient logistics and cold chain infrastructure, ensuring product quality and availability.
Dominance Analysis: This region's dominance is attributable to a combination of high demand, favorable regulatory environments, and robust infrastructure. The large and growing population also contributes significantly.
Meat Product Developments
Recent years have witnessed significant innovation in meat products, focusing on convenience, health, and sustainability. Value-added products, such as ready-to-eat meals, marinated meats, and organic options, are gaining popularity. Technological advancements, like plant-based meat alternatives and cellular agriculture, are challenging the traditional meat landscape. These innovations are catering to evolving consumer preferences, creating new market segments and driving competition.
Key Drivers of Meat Growth
Several factors are propelling growth in the meat sector. Technological advancements in animal husbandry and processing are boosting efficiency and output. Economic growth in emerging markets is increasing meat consumption. Favorable government policies and infrastructure development support the sector's expansion.
Challenges in the Meat Market
The meat market faces several challenges. Stringent regulations on food safety and environmental protection increase operational costs. Supply chain disruptions, particularly feed costs, impact production. Intense competition, including from plant-based alternatives, puts pressure on profitability and market share.
Emerging Opportunities in Meat
The future holds several opportunities. Technological breakthroughs in alternative protein sources, such as lab-grown meat, and sustainable farming practices will drive growth. Strategic partnerships, such as collaborations between traditional meat producers and plant-based companies, can create new product categories. Expansion into new markets, particularly in developing economies, presents significant potential for growth.
Leading Players in the Meat Sector
- WH Group
- JBS
- Tyson Foods
- Kraft Heinz
- Cargill
- ConAgra Foods
- BRF SA
- OSI Group
- Toennies
- Charoen Pokphand Group
- Hormel Foods
- Danish Crown
- Nippon Ham
- Seaboard Corporation
- Itoham Foods
- New Hope Group
- Jinluo
- Cremonini
- Yurun Group
Key Milestones in Meat Industry
- 2020: Increased focus on traceability and transparency in response to consumer demand for ethical sourcing.
- 2021: Several major meat companies invested heavily in plant-based alternatives or formed partnerships with plant-based companies.
- 2022: Significant advancements in lab-grown meat technology moved closer to commercialization.
- 2023: Growing adoption of sustainable farming practices and technologies aimed at reducing environmental impact.
- 2024: Increased regulatory scrutiny on antibiotic use in livestock farming.
Strategic Outlook for Meat Market
The meat market's future trajectory points towards continued growth, driven by technological innovation, changing consumer preferences, and expansion into new markets. Companies that can effectively adapt to these trends, embracing sustainability, traceability, and diversification strategies, will be best positioned for success. The strategic focus should be on developing value-added products, strengthening supply chain resilience, and navigating the evolving regulatory landscape.
Meat Segmentation
-
1. Application
- 1.1. Supermarkets/Hypermarkets
- 1.2. Convenience Stores
- 1.3. Independent Retailers
- 1.4. Others
-
2. Type
- 2.1. Pork
- 2.2. Beef
- 2.3. Poultry
- 2.4. Others
Meat Segmentation By Geography
-
1. North America
- 1.1. United States
- 1.2. Canada
- 1.3. Mexico
-
2. South America
- 2.1. Brazil
- 2.2. Argentina
- 2.3. Rest of South America
-
3. Europe
- 3.1. United Kingdom
- 3.2. Germany
- 3.3. France
- 3.4. Italy
- 3.5. Spain
- 3.6. Russia
- 3.7. Benelux
- 3.8. Nordics
- 3.9. Rest of Europe
-
4. Middle East & Africa
- 4.1. Turkey
- 4.2. Israel
- 4.3. GCC
- 4.4. North Africa
- 4.5. South Africa
- 4.6. Rest of Middle East & Africa
-
5. Asia Pacific
- 5.1. China
- 5.2. India
- 5.3. Japan
- 5.4. South Korea
- 5.5. ASEAN
- 5.6. Oceania
- 5.7. Rest of Asia Pacific
Meat Regional Market Share
Geographic Coverage of Meat
Meat REPORT HIGHLIGHTS
| Aspects | Details |
|---|---|
| Study Period | 2020-2034 |
| Base Year | 2025 |
| Estimated Year | 2026 |
| Forecast Period | 2026-2034 |
| Historical Period | 2020-2025 |
| Growth Rate | CAGR of 3.3% from 2020-2034 |
| Segmentation |
|
Table of Contents
- 1. Introduction
- 1.1. Research Scope
- 1.2. Market Segmentation
- 1.3. Research Methodology
- 1.4. Definitions and Assumptions
- 2. Executive Summary
- 2.1. Introduction
- 3. Market Dynamics
- 3.1. Introduction
- 3.2. Market Drivers
- 3.3. Market Restrains
- 3.4. Market Trends
- 4. Market Factor Analysis
- 4.1. Porters Five Forces
- 4.2. Supply/Value Chain
- 4.3. PESTEL analysis
- 4.4. Market Entropy
- 4.5. Patent/Trademark Analysis
- 5. Global Meat Analysis, Insights and Forecast, 2020-2032
- 5.1. Market Analysis, Insights and Forecast - by Application
- 5.1.1. Supermarkets/Hypermarkets
- 5.1.2. Convenience Stores
- 5.1.3. Independent Retailers
- 5.1.4. Others
- 5.2. Market Analysis, Insights and Forecast - by Type
- 5.2.1. Pork
- 5.2.2. Beef
- 5.2.3. Poultry
- 5.2.4. Others
- 5.3. Market Analysis, Insights and Forecast - by Region
- 5.3.1. North America
- 5.3.2. South America
- 5.3.3. Europe
- 5.3.4. Middle East & Africa
- 5.3.5. Asia Pacific
- 5.1. Market Analysis, Insights and Forecast - by Application
- 6. North America Meat Analysis, Insights and Forecast, 2020-2032
- 6.1. Market Analysis, Insights and Forecast - by Application
- 6.1.1. Supermarkets/Hypermarkets
- 6.1.2. Convenience Stores
- 6.1.3. Independent Retailers
- 6.1.4. Others
- 6.2. Market Analysis, Insights and Forecast - by Type
- 6.2.1. Pork
- 6.2.2. Beef
- 6.2.3. Poultry
- 6.2.4. Others
- 6.1. Market Analysis, Insights and Forecast - by Application
- 7. South America Meat Analysis, Insights and Forecast, 2020-2032
- 7.1. Market Analysis, Insights and Forecast - by Application
- 7.1.1. Supermarkets/Hypermarkets
- 7.1.2. Convenience Stores
- 7.1.3. Independent Retailers
- 7.1.4. Others
- 7.2. Market Analysis, Insights and Forecast - by Type
- 7.2.1. Pork
- 7.2.2. Beef
- 7.2.3. Poultry
- 7.2.4. Others
- 7.1. Market Analysis, Insights and Forecast - by Application
- 8. Europe Meat Analysis, Insights and Forecast, 2020-2032
- 8.1. Market Analysis, Insights and Forecast - by Application
- 8.1.1. Supermarkets/Hypermarkets
- 8.1.2. Convenience Stores
- 8.1.3. Independent Retailers
- 8.1.4. Others
- 8.2. Market Analysis, Insights and Forecast - by Type
- 8.2.1. Pork
- 8.2.2. Beef
- 8.2.3. Poultry
- 8.2.4. Others
- 8.1. Market Analysis, Insights and Forecast - by Application
- 9. Middle East & Africa Meat Analysis, Insights and Forecast, 2020-2032
- 9.1. Market Analysis, Insights and Forecast - by Application
- 9.1.1. Supermarkets/Hypermarkets
- 9.1.2. Convenience Stores
- 9.1.3. Independent Retailers
- 9.1.4. Others
- 9.2. Market Analysis, Insights and Forecast - by Type
- 9.2.1. Pork
- 9.2.2. Beef
- 9.2.3. Poultry
- 9.2.4. Others
- 9.1. Market Analysis, Insights and Forecast - by Application
- 10. Asia Pacific Meat Analysis, Insights and Forecast, 2020-2032
- 10.1. Market Analysis, Insights and Forecast - by Application
- 10.1.1. Supermarkets/Hypermarkets
- 10.1.2. Convenience Stores
- 10.1.3. Independent Retailers
- 10.1.4. Others
- 10.2. Market Analysis, Insights and Forecast - by Type
- 10.2.1. Pork
- 10.2.2. Beef
- 10.2.3. Poultry
- 10.2.4. Others
- 10.1. Market Analysis, Insights and Forecast - by Application
- 11. Competitive Analysis
- 11.1. Global Market Share Analysis 2025
- 11.2. Company Profiles
- 11.2.1 WH Group
- 11.2.1.1. Overview
- 11.2.1.2. Products
- 11.2.1.3. SWOT Analysis
- 11.2.1.4. Recent Developments
- 11.2.1.5. Financials (Based on Availability)
- 11.2.2 JBS
- 11.2.2.1. Overview
- 11.2.2.2. Products
- 11.2.2.3. SWOT Analysis
- 11.2.2.4. Recent Developments
- 11.2.2.5. Financials (Based on Availability)
- 11.2.3 Tyson Foods
- 11.2.3.1. Overview
- 11.2.3.2. Products
- 11.2.3.3. SWOT Analysis
- 11.2.3.4. Recent Developments
- 11.2.3.5. Financials (Based on Availability)
- 11.2.4 Kraft Heinz
- 11.2.4.1. Overview
- 11.2.4.2. Products
- 11.2.4.3. SWOT Analysis
- 11.2.4.4. Recent Developments
- 11.2.4.5. Financials (Based on Availability)
- 11.2.5 Cargill
- 11.2.5.1. Overview
- 11.2.5.2. Products
- 11.2.5.3. SWOT Analysis
- 11.2.5.4. Recent Developments
- 11.2.5.5. Financials (Based on Availability)
- 11.2.6 ConAgra Foods
- 11.2.6.1. Overview
- 11.2.6.2. Products
- 11.2.6.3. SWOT Analysis
- 11.2.6.4. Recent Developments
- 11.2.6.5. Financials (Based on Availability)
- 11.2.7 BRF SA
- 11.2.7.1. Overview
- 11.2.7.2. Products
- 11.2.7.3. SWOT Analysis
- 11.2.7.4. Recent Developments
- 11.2.7.5. Financials (Based on Availability)
- 11.2.8 OSI Group
- 11.2.8.1. Overview
- 11.2.8.2. Products
- 11.2.8.3. SWOT Analysis
- 11.2.8.4. Recent Developments
- 11.2.8.5. Financials (Based on Availability)
- 11.2.9 Toennies
- 11.2.9.1. Overview
- 11.2.9.2. Products
- 11.2.9.3. SWOT Analysis
- 11.2.9.4. Recent Developments
- 11.2.9.5. Financials (Based on Availability)
- 11.2.10 Charoen Pokphand Group
- 11.2.10.1. Overview
- 11.2.10.2. Products
- 11.2.10.3. SWOT Analysis
- 11.2.10.4. Recent Developments
- 11.2.10.5. Financials (Based on Availability)
- 11.2.11 Hormel Foods
- 11.2.11.1. Overview
- 11.2.11.2. Products
- 11.2.11.3. SWOT Analysis
- 11.2.11.4. Recent Developments
- 11.2.11.5. Financials (Based on Availability)
- 11.2.12 Danish Crown
- 11.2.12.1. Overview
- 11.2.12.2. Products
- 11.2.12.3. SWOT Analysis
- 11.2.12.4. Recent Developments
- 11.2.12.5. Financials (Based on Availability)
- 11.2.13 Nippon Ham
- 11.2.13.1. Overview
- 11.2.13.2. Products
- 11.2.13.3. SWOT Analysis
- 11.2.13.4. Recent Developments
- 11.2.13.5. Financials (Based on Availability)
- 11.2.14 Seaboard Corporation
- 11.2.14.1. Overview
- 11.2.14.2. Products
- 11.2.14.3. SWOT Analysis
- 11.2.14.4. Recent Developments
- 11.2.14.5. Financials (Based on Availability)
- 11.2.15 Itoham Foods
- 11.2.15.1. Overview
- 11.2.15.2. Products
- 11.2.15.3. SWOT Analysis
- 11.2.15.4. Recent Developments
- 11.2.15.5. Financials (Based on Availability)
- 11.2.16 New Hope Group
- 11.2.16.1. Overview
- 11.2.16.2. Products
- 11.2.16.3. SWOT Analysis
- 11.2.16.4. Recent Developments
- 11.2.16.5. Financials (Based on Availability)
- 11.2.17 Jinluo
- 11.2.17.1. Overview
- 11.2.17.2. Products
- 11.2.17.3. SWOT Analysis
- 11.2.17.4. Recent Developments
- 11.2.17.5. Financials (Based on Availability)
- 11.2.18 Cremonini
- 11.2.18.1. Overview
- 11.2.18.2. Products
- 11.2.18.3. SWOT Analysis
- 11.2.18.4. Recent Developments
- 11.2.18.5. Financials (Based on Availability)
- 11.2.19 Yurun Group
- 11.2.19.1. Overview
- 11.2.19.2. Products
- 11.2.19.3. SWOT Analysis
- 11.2.19.4. Recent Developments
- 11.2.19.5. Financials (Based on Availability)
- 11.2.1 WH Group
List of Figures
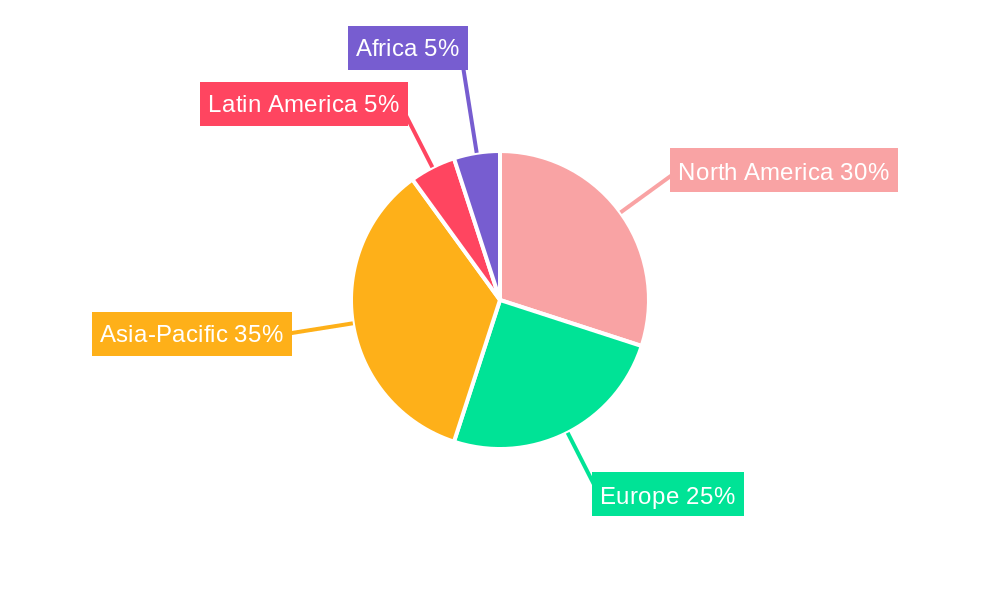
- Figure 1: Global Meat Revenue Breakdown (million, %) by Region 2025 & 2033
- Figure 2: North America Meat Revenue (million), by Application 2025 & 2033
- Figure 3: North America Meat Revenue Share (%), by Application 2025 & 2033
- Figure 4: North America Meat Revenue (million), by Type 2025 & 2033
- Figure 5: North America Meat Revenue Share (%), by Type 2025 & 2033
- Figure 6: North America Meat Revenue (million), by Country 2025 & 2033
- Figure 7: North America Meat Revenue Share (%), by Country 2025 & 2033
- Figure 8: South America Meat Revenue (million), by Application 2025 & 2033
- Figure 9: South America Meat Revenue Share (%), by Application 2025 & 2033
- Figure 10: South America Meat Revenue (million), by Type 2025 & 2033
- Figure 11: South America Meat Revenue Share (%), by Type 2025 & 2033
- Figure 12: South America Meat Revenue (million), by Country 2025 & 2033
- Figure 13: South America Meat Revenue Share (%), by Country 2025 & 2033
- Figure 14: Europe Meat Revenue (million), by Application 2025 & 2033
- Figure 15: Europe Meat Revenue Share (%), by Application 2025 & 2033
- Figure 16: Europe Meat Revenue (million), by Type 2025 & 2033
- Figure 17: Europe Meat Revenue Share (%), by Type 2025 & 2033
- Figure 18: Europe Meat Revenue (million), by Country 2025 & 2033
- Figure 19: Europe Meat Revenue Share (%), by Country 2025 & 2033
- Figure 20: Middle East & Africa Meat Revenue (million), by Application 2025 & 2033
- Figure 21: Middle East & Africa Meat Revenue Share (%), by Application 2025 & 2033
- Figure 22: Middle East & Africa Meat Revenue (million), by Type 2025 & 2033
- Figure 23: Middle East & Africa Meat Revenue Share (%), by Type 2025 & 2033
- Figure 24: Middle East & Africa Meat Revenue (million), by Country 2025 & 2033
- Figure 25: Middle East & Africa Meat Revenue Share (%), by Country 2025 & 2033
- Figure 26: Asia Pacific Meat Revenue (million), by Application 2025 & 2033
- Figure 27: Asia Pacific Meat Revenue Share (%), by Application 2025 & 2033
- Figure 28: Asia Pacific Meat Revenue (million), by Type 2025 & 2033
- Figure 29: Asia Pacific Meat Revenue Share (%), by Type 2025 & 2033
- Figure 30: Asia Pacific Meat Revenue (million), by Country 2025 & 2033
- Figure 31: Asia Pacific Meat Revenue Share (%), by Country 2025 & 2033
List of Tables
- Table 1: Global Meat Revenue million Forecast, by Application 2020 & 2033
- Table 2: Global Meat Revenue million Forecast, by Type 2020 & 2033
- Table 3: Global Meat Revenue million Forecast, by Region 2020 & 2033
- Table 4: Global Meat Revenue million Forecast, by Application 2020 & 2033
- Table 5: Global Meat Revenue million Forecast, by Type 2020 & 2033
- Table 6: Global Meat Revenue million Forecast, by Country 2020 & 2033
- Table 7: United States Meat Revenue (million) Forecast, by Application 2020 & 2033
- Table 8: Canada Meat Revenue (million) Forecast, by Application 2020 & 2033
- Table 9: Mexico Meat Revenue (million) Forecast, by Application 2020 & 2033
- Table 10: Global Meat Revenue million Forecast, by Application 2020 & 2033
- Table 11: Global Meat Revenue million Forecast, by Type 2020 & 2033
- Table 12: Global Meat Revenue million Forecast, by Country 2020 & 2033
- Table 13: Brazil Meat Revenue (million) Forecast, by Application 2020 & 2033
- Table 14: Argentina Meat Revenue (million) Forecast, by Application 2020 & 2033
- Table 15: Rest of South America Meat Revenue (million) Forecast, by Application 2020 & 2033
- Table 16: Global Meat Revenue million Forecast, by Application 2020 & 2033
- Table 17: Global Meat Revenue million Forecast, by Type 2020 & 2033
- Table 18: Global Meat Revenue million Forecast, by Country 2020 & 2033
- Table 19: United Kingdom Meat Revenue (million) Forecast, by Application 2020 & 2033
- Table 20: Germany Meat Revenue (million) Forecast, by Application 2020 & 2033
- Table 21: France Meat Revenue (million) Forecast, by Application 2020 & 2033
- Table 22: Italy Meat Revenue (million) Forecast, by Application 2020 & 2033
- Table 23: Spain Meat Revenue (million) Forecast, by Application 2020 & 2033
- Table 24: Russia Meat Revenue (million) Forecast, by Application 2020 & 2033
- Table 25: Benelux Meat Revenue (million) Forecast, by Application 2020 & 2033
- Table 26: Nordics Meat Revenue (million) Forecast, by Application 2020 & 2033
- Table 27: Rest of Europe Meat Revenue (million) Forecast, by Application 2020 & 2033
- Table 28: Global Meat Revenue million Forecast, by Application 2020 & 2033
- Table 29: Global Meat Revenue million Forecast, by Type 2020 & 2033
- Table 30: Global Meat Revenue million Forecast, by Country 2020 & 2033
- Table 31: Turkey Meat Revenue (million) Forecast, by Application 2020 & 2033
- Table 32: Israel Meat Revenue (million) Forecast, by Application 2020 & 2033
- Table 33: GCC Meat Revenue (million) Forecast, by Application 2020 & 2033
- Table 34: North Africa Meat Revenue (million) Forecast, by Application 2020 & 2033
- Table 35: South Africa Meat Revenue (million) Forecast, by Application 2020 & 2033
- Table 36: Rest of Middle East & Africa Meat Revenue (million) Forecast, by Application 2020 & 2033
- Table 37: Global Meat Revenue million Forecast, by Application 2020 & 2033
- Table 38: Global Meat Revenue million Forecast, by Type 2020 & 2033
- Table 39: Global Meat Revenue million Forecast, by Country 2020 & 2033
- Table 40: China Meat Revenue (million) Forecast, by Application 2020 & 2033
- Table 41: India Meat Revenue (million) Forecast, by Application 2020 & 2033
- Table 42: Japan Meat Revenue (million) Forecast, by Application 2020 & 2033
- Table 43: South Korea Meat Revenue (million) Forecast, by Application 2020 & 2033
- Table 44: ASEAN Meat Revenue (million) Forecast, by Application 2020 & 2033
- Table 45: Oceania Meat Revenue (million) Forecast, by Application 2020 & 2033
- Table 46: Rest of Asia Pacific Meat Revenue (million) Forecast, by Application 2020 & 2033
Frequently Asked Questions
1. What is the projected Compound Annual Growth Rate (CAGR) of the Meat?
The projected CAGR is approximately 3.3%.
2. Which companies are prominent players in the Meat?
Key companies in the market include WH Group, JBS, Tyson Foods, Kraft Heinz, Cargill, ConAgra Foods, BRF SA, OSI Group, Toennies, Charoen Pokphand Group, Hormel Foods, Danish Crown, Nippon Ham, Seaboard Corporation, Itoham Foods, New Hope Group, Jinluo, Cremonini, Yurun Group.
3. What are the main segments of the Meat?
The market segments include Application, Type.
4. Can you provide details about the market size?
The market size is estimated to be USD 501590 million as of 2022.
5. What are some drivers contributing to market growth?
N/A
6. What are the notable trends driving market growth?
N/A
7. Are there any restraints impacting market growth?
N/A
8. Can you provide examples of recent developments in the market?
N/A
9. What pricing options are available for accessing the report?
Pricing options include single-user, multi-user, and enterprise licenses priced at USD 4250.00, USD 6375.00, and USD 8500.00 respectively.
10. Is the market size provided in terms of value or volume?
The market size is provided in terms of value, measured in million.
11. Are there any specific market keywords associated with the report?
Yes, the market keyword associated with the report is "Meat," which aids in identifying and referencing the specific market segment covered.
12. How do I determine which pricing option suits my needs best?
The pricing options vary based on user requirements and access needs. Individual users may opt for single-user licenses, while businesses requiring broader access may choose multi-user or enterprise licenses for cost-effective access to the report.
13. Are there any additional resources or data provided in the Meat report?
While the report offers comprehensive insights, it's advisable to review the specific contents or supplementary materials provided to ascertain if additional resources or data are available.
14. How can I stay updated on further developments or reports in the Meat?
To stay informed about further developments, trends, and reports in the Meat, consider subscribing to industry newsletters, following relevant companies and organizations, or regularly checking reputable industry news sources and publications.
Methodology
Step 1 - Identification of Relevant Samples Size from Population Database


Step 2 - Approaches for Defining Global Market Size (Value, Volume* & Price*)

Note*: In applicable scenarios
Step 3 - Data Sources
Primary Research
- Web Analytics
- Survey Reports
- Research Institute
- Latest Research Reports
- Opinion Leaders
Secondary Research
- Annual Reports
- White Paper
- Latest Press Release
- Industry Association
- Paid Database
- Investor Presentations

Step 4 - Data Triangulation
Involves using different sources of information in order to increase the validity of a study
These sources are likely to be stakeholders in a program - participants, other researchers, program staff, other community members, and so on.
Then we put all data in single framework & apply various statistical tools to find out the dynamic on the market.
During the analysis stage, feedback from the stakeholder groups would be compared to determine areas of agreement as well as areas of divergence