

Key Insights
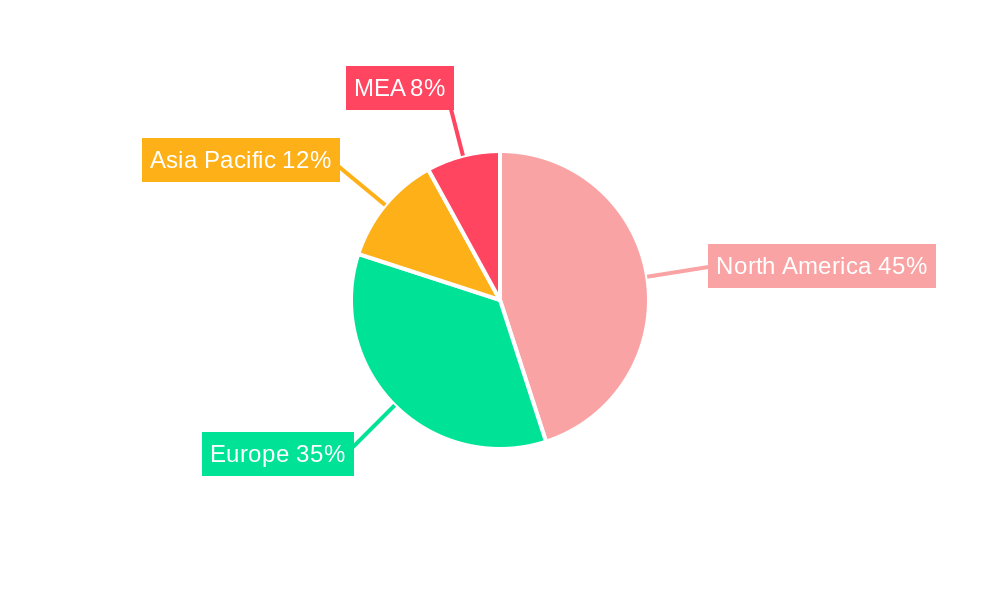
The MEA C-arms market, while smaller than its North American or European counterparts, exhibits significant growth potential driven by increasing healthcare infrastructure development and rising prevalence of cardiovascular diseases and other conditions requiring minimally invasive procedures. The region's burgeoning medical tourism industry also contributes to market expansion, attracting patients seeking advanced imaging technology. Considering the global C-arms market's 5.46% CAGR and the growing demand for sophisticated medical equipment in rapidly developing economies like Saudi Arabia and the UAE, we can reasonably project a moderate growth trajectory for the MEA region. Factors such as increasing government healthcare spending and initiatives to improve healthcare access are key drivers. However, challenges remain, including relatively lower healthcare expenditure per capita compared to developed nations and uneven distribution of healthcare resources across the region. This disparity may lead to localized variations in market growth, with concentrated expansion in wealthier, more developed areas within MEA. The segment dominated by mobile C-arms is likely to see faster growth due to its portability and flexibility, particularly in settings with limited infrastructure. Cardiology and oncology applications represent the largest segments, driven by the increasing incidence of related diseases within the region.
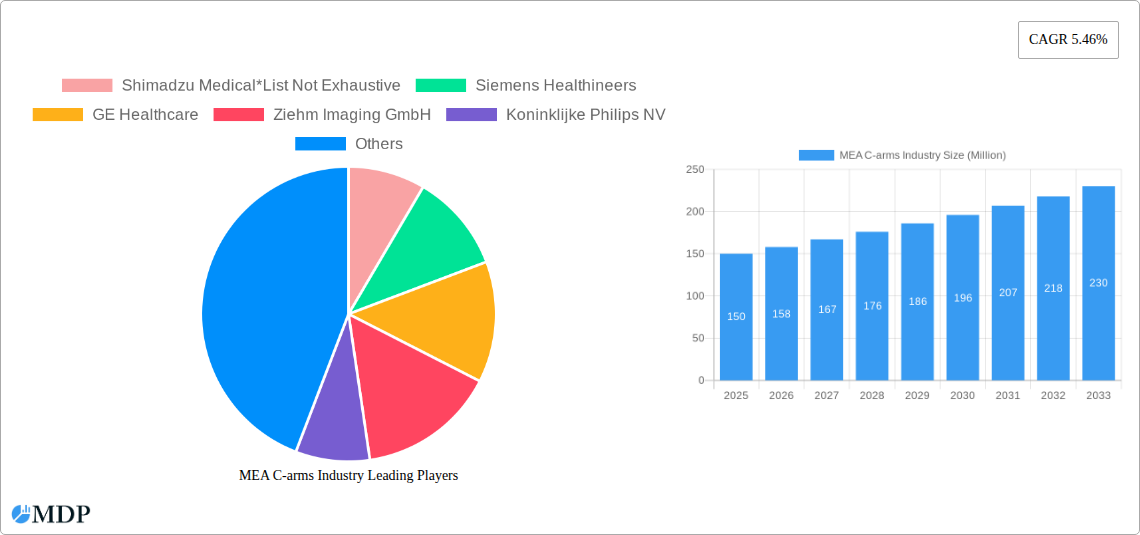
The competitive landscape in the MEA C-arms market is characterized by a mix of multinational corporations and local distributors. Major players like Siemens Healthineers, GE Healthcare, and Philips are likely to maintain a strong presence, leveraging their established brand reputation and technological expertise. However, regional players and distributors will also play a crucial role in catering to specific market needs and ensuring product accessibility across diverse healthcare settings within the MEA region. The market will likely see increased competition and a focus on providing cost-effective solutions to meet the varied needs and budgetary constraints prevalent in the region. Strategic partnerships and collaborations among international and regional players will further shape the MEA C-arms market's competitive dynamics.
MEA C-arms Industry Market Report: 2019-2033
Unlocking Growth Opportunities in the Middle East & Africa C-arms Market
This comprehensive report provides an in-depth analysis of the MEA C-arms industry, offering invaluable insights for stakeholders seeking to navigate this dynamic market. Covering the period 2019-2033, with a focus on 2025, this report meticulously examines market dynamics, key players, technological advancements, and future growth potential. With a detailed segmentation analysis by type (Fixed and Mobile C-arms) and application (Cardiology, Oncology, Neurology, and Other Applications), this report is an essential resource for strategic decision-making. The market is projected to reach XX Million by 2033, exhibiting a CAGR of XX% during the forecast period (2025-2033).
MEA C-arms Industry Market Dynamics & Concentration
The MEA C-arms market is characterized by moderate concentration, with key players like Shimadzu Medical, Siemens Healthineers, GE Healthcare, Ziehm Imaging GmbH, Koninklijke Philips NV, Canon Medical Systems Corporation, Hologic Corporation, and OrthoScan Inc. holding significant market share. However, the market also presents opportunities for smaller, specialized players to carve out niches. Market share dynamics are influenced by factors such as technological innovation, regulatory approvals, and strategic partnerships. The estimated market size in 2025 is XX Million. M&A activity in the sector has been relatively low in recent years, with approximately xx deals recorded between 2019 and 2024. Regulatory frameworks, while varying across MEA countries, are generally geared towards ensuring patient safety and the efficacy of medical devices. The increasing adoption of minimally invasive procedures and the growing prevalence of chronic diseases are significant drivers of market growth. Substitutes for C-arms are limited, primarily focusing on alternative imaging modalities like ultrasound, but these often lack the comprehensive capabilities of C-arms. End-user trends indicate a preference for advanced functionalities, such as improved image quality, ease of use, and integration with other medical imaging systems.
MEA C-arms Industry Industry Trends & Analysis
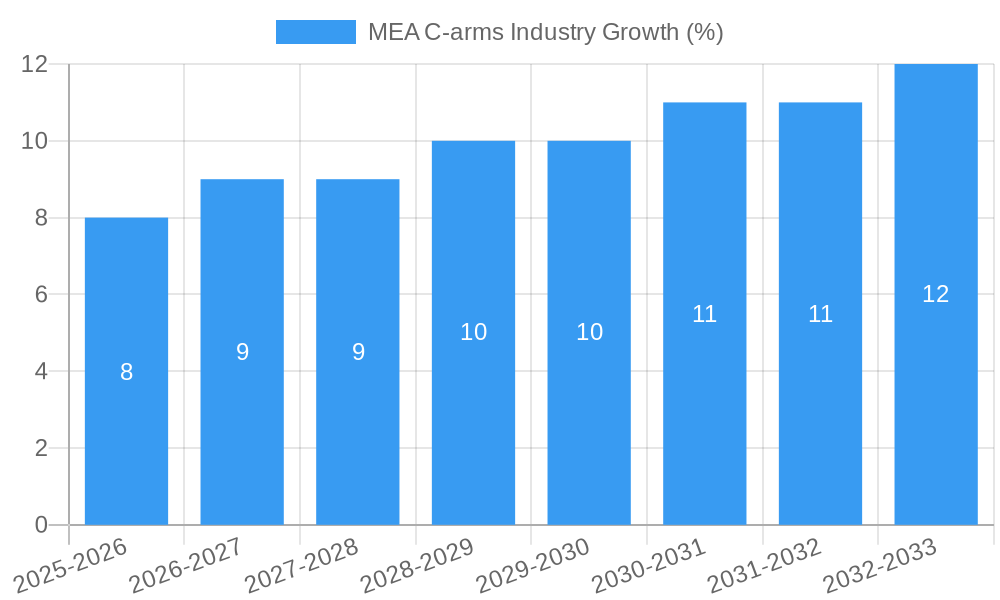
The MEA C-arms market is experiencing robust growth fueled by several key factors. Technological advancements, such as the integration of AI and improved image processing capabilities, are driving market penetration and improving diagnostic accuracy. The increasing prevalence of cardiovascular diseases, cancer, and neurological disorders across the region is boosting demand for C-arms in various clinical settings. Consumer preferences are shifting towards portable and mobile C-arms for enhanced flexibility and ease of use in various operating environments. The competitive landscape is characterized by both intense rivalry among established players and the emergence of new entrants with innovative solutions. Market growth is projected to be driven by factors such as increasing healthcare expenditure, rising awareness of advanced medical technologies, and favorable government initiatives aimed at improving healthcare infrastructure. The market exhibits a strong CAGR of XX% during the historical period (2019-2024) and is anticipated to maintain a similar growth trajectory in the forecast period.
Leading Markets & Segments in MEA C-arms Industry
The MEA C-arms market exhibits significant variations in growth rates across different regions and segments. While specific country-level data is proprietary and not displayed here, the report will offer a comprehensive analysis of the market by segment.
By Type: Mobile C-arms are witnessing higher growth compared to fixed C-arms due to their enhanced portability and flexibility. The preference for mobile systems is driven by the increasing demand for point-of-care diagnostics and the need for flexible deployment across various clinical settings within hospitals and even outside in rural areas.
By Application: Cardiology remains the largest application segment, driven by the high prevalence of cardiovascular diseases. Oncology and neurology are also significant application areas showing high growth rates due to increasing incidences of cancer and neurological disorders, and ongoing advancements in minimally invasive surgical techniques.
Key drivers include:
- Expanding Healthcare Infrastructure: Government investments in healthcare are propelling market growth in several key countries.
- Rising Healthcare Expenditure: Increased disposable incomes and greater private healthcare insurance coverage are further boosting the market.
- Technological Advancements: Continuous innovations in C-arm technology are improving image quality and diagnostic accuracy.
MEA C-arms Industry Product Developments
Recent product developments focus on miniaturization, improved image quality (enhanced resolution, reduced radiation dose), and enhanced integration with other medical imaging systems. Wireless capabilities and advanced software features are becoming increasingly common, improving workflow efficiency and facilitating remote diagnostics. The introduction of AI-powered image analysis tools is also enhancing diagnostic accuracy and reducing the time required for image interpretation. These advancements cater to the increasing demand for improved patient care and streamlined clinical workflows.
Key Drivers of MEA C-arms Industry Growth
The growth of the MEA C-arms market is driven by several converging factors:
- Technological Advancements: Miniaturization, improved image quality, and AI integration are enhancing the capabilities of C-arms.
- Rising Prevalence of Chronic Diseases: Cardiovascular diseases, cancer, and neurological disorders are driving demand for advanced diagnostic and interventional tools.
- Increasing Healthcare Expenditure: Greater government and private investment in healthcare is expanding access to advanced medical technologies.
- Favorable Regulatory Environment: Supportive regulatory frameworks are accelerating market penetration.
Challenges in the MEA C-arms Industry Market
The MEA C-arms market faces several challenges:
- High Initial Investment Costs: The high purchase price of C-arms can pose a barrier to adoption, particularly in resource-constrained settings.
- Stringent Regulatory Approvals: The lengthy regulatory approval process can delay product launches and market entry.
- Competition from Alternative Imaging Modalities: Ultrasound and other imaging technologies offer alternative, though often less comprehensive, diagnostic options.
- Supply Chain Disruptions: Global supply chain disruptions can impact the availability and pricing of C-arms and their components. Quantifiable impacts may lead to increased costs and potentially delay projects.
Emerging Opportunities in MEA C-arms Industry
Significant opportunities exist for growth in the MEA C-arms market:
- Expansion into Underserved Markets: Reaching remote and underserved areas through mobile C-arm solutions can unlock significant market potential.
- Strategic Partnerships and Joint Ventures: Collaboration among technology providers, healthcare providers, and government agencies can facilitate market penetration and adoption.
- Technological Innovation: Developing innovative C-arm solutions that address the specific needs of the MEA region can create significant market differentiation.
Leading Players in the MEA C-arms Industry Sector
- Shimadzu Medical
- Siemens Healthineers
- GE Healthcare
- Ziehm Imaging GmbH
- Koninklijke Philips NV
- Canon Medical Systems Corporation
- Hologic Corporation
- OrthoScan Inc
Key Milestones in MEA C-arms Industry Industry
- 2020: Introduction of a new mobile C-arm system with improved image quality by Siemens Healthineers.
- 2022: Regulatory approval of a new AI-powered image analysis tool for C-arms in key MEA markets.
- 2023: Partnership between a leading C-arm manufacturer and a major healthcare provider to expand access to advanced C-arm technology. (Specific details withheld for confidentiality).
Strategic Outlook for MEA C-arms Industry Market
The MEA C-arms market is poised for substantial growth driven by rising healthcare spending, technological advancements, and the increasing prevalence of chronic diseases. Strategic opportunities exist for companies that focus on developing innovative, affordable, and accessible C-arm solutions tailored to the specific needs of the MEA region. Expanding distribution networks, forging strategic partnerships, and leveraging digital technologies to enhance after-sales service will be key for success in this dynamic market. Furthermore, focusing on training and education to build capacity among healthcare professionals will be crucial for widespread adoption and utilization of this technology.
MEA C-arms Industry Segmentation
-
1. Type
- 1.1. Fixed C-Arms
- 1.2. Mobile C-Arms
-
2. Application
- 2.1. Cardiology
- 2.2. Oncology
- 2.3. Neurology
- 2.4. Other Applications
-
3. Geography
-
3.1. Middle-East and Africa
- 3.1.1. GCC
- 3.1.2. South Africa
- 3.1.3. Rest of Middle-East and Africa
-
3.1. Middle-East and Africa
MEA C-arms Industry Segmentation By Geography
-
1. Middle East and Africa
- 1.1. GCC
- 1.2. South Africa
- 1.3. Rest of Middle East and Africa
MEA C-arms Industry REPORT HIGHLIGHTS
| Aspects | Details |
|---|---|
| Study Period | 2019-2033 |
| Base Year | 2024 |
| Estimated Year | 2025 |
| Forecast Period | 2025-2033 |
| Historical Period | 2019-2024 |
| Growth Rate | CAGR of 5.46% from 2019-2033 |
| Segmentation |
|
Table of Contents
- 1. Introduction
- 1.1. Research Scope
- 1.2. Market Segmentation
- 1.3. Research Methodology
- 1.4. Definitions and Assumptions
- 2. Executive Summary
- 2.1. Introduction
- 3. Market Dynamics
- 3.1. Introduction
- 3.2. Market Drivers
- 3.2.1. ; Rising Geriatric Population and Increasing Burden of Chronic Diseases; Increasing Demand for Healthcare Infrastructure in the Region
- 3.3. Market Restrains
- 3.3.1. ; Increasing use of Refurbished Devices
- 3.4. Market Trends
- 3.4.1. The Mini C-Arm Segment is Expected to Show Better Growth over the Forecast period
- 4. Market Factor Analysis
- 4.1. Porters Five Forces
- 4.2. Supply/Value Chain
- 4.3. PESTEL analysis
- 4.4. Market Entropy
- 4.5. Patent/Trademark Analysis
- 5. Global MEA C-arms Industry Analysis, Insights and Forecast, 2019-2031
- 5.1. Market Analysis, Insights and Forecast - by Type
- 5.1.1. Fixed C-Arms
- 5.1.2. Mobile C-Arms
- 5.2. Market Analysis, Insights and Forecast - by Application
- 5.2.1. Cardiology
- 5.2.2. Oncology
- 5.2.3. Neurology
- 5.2.4. Other Applications
- 5.3. Market Analysis, Insights and Forecast - by Geography
- 5.3.1. Middle-East and Africa
- 5.3.1.1. GCC
- 5.3.1.2. South Africa
- 5.3.1.3. Rest of Middle-East and Africa
- 5.3.1. Middle-East and Africa
- 5.4. Market Analysis, Insights and Forecast - by Region
- 5.4.1. Middle East and Africa
- 5.1. Market Analysis, Insights and Forecast - by Type
- 6. North America MEA C-arms Industry Analysis, Insights and Forecast, 2019-2031
- 6.1. Market Analysis, Insights and Forecast - By Country/Sub-region
- 6.1.1 United States
- 6.1.2 Canada
- 6.1.3 Mexico
- 7. Europe MEA C-arms Industry Analysis, Insights and Forecast, 2019-2031
- 7.1. Market Analysis, Insights and Forecast - By Country/Sub-region
- 7.1.1 Germany
- 7.1.2 United Kingdom
- 7.1.3 France
- 7.1.4 Spain
- 7.1.5 Italy
- 7.1.6 Spain
- 7.1.7 Belgium
- 7.1.8 Netherland
- 7.1.9 Nordics
- 7.1.10 Rest of Europe
- 8. Asia Pacific MEA C-arms Industry Analysis, Insights and Forecast, 2019-2031
- 8.1. Market Analysis, Insights and Forecast - By Country/Sub-region
- 8.1.1 China
- 8.1.2 Japan
- 8.1.3 India
- 8.1.4 South Korea
- 8.1.5 Southeast Asia
- 8.1.6 Australia
- 8.1.7 Indonesia
- 8.1.8 Phillipes
- 8.1.9 Singapore
- 8.1.10 Thailandc
- 8.1.11 Rest of Asia Pacific
- 9. South America MEA C-arms Industry Analysis, Insights and Forecast, 2019-2031
- 9.1. Market Analysis, Insights and Forecast - By Country/Sub-region
- 9.1.1 Brazil
- 9.1.2 Argentina
- 9.1.3 Peru
- 9.1.4 Chile
- 9.1.5 Colombia
- 9.1.6 Ecuador
- 9.1.7 Venezuela
- 9.1.8 Rest of South America
- 10. North America MEA C-arms Industry Analysis, Insights and Forecast, 2019-2031
- 10.1. Market Analysis, Insights and Forecast - By Country/Sub-region
- 10.1.1 United States
- 10.1.2 Canada
- 10.1.3 Mexico
- 11. MEA MEA C-arms Industry Analysis, Insights and Forecast, 2019-2031
- 11.1. Market Analysis, Insights and Forecast - By Country/Sub-region
- 11.1.1 United Arab Emirates
- 11.1.2 Saudi Arabia
- 11.1.3 South Africa
- 11.1.4 Rest of Middle East and Africa
- 12. Competitive Analysis
- 12.1. Global Market Share Analysis 2024
- 12.2. Company Profiles
- 12.2.1 Shimadzu Medical*List Not Exhaustive
- 12.2.1.1. Overview
- 12.2.1.2. Products
- 12.2.1.3. SWOT Analysis
- 12.2.1.4. Recent Developments
- 12.2.1.5. Financials (Based on Availability)
- 12.2.2 Siemens Healthineers
- 12.2.2.1. Overview
- 12.2.2.2. Products
- 12.2.2.3. SWOT Analysis
- 12.2.2.4. Recent Developments
- 12.2.2.5. Financials (Based on Availability)
- 12.2.3 GE Healthcare
- 12.2.3.1. Overview
- 12.2.3.2. Products
- 12.2.3.3. SWOT Analysis
- 12.2.3.4. Recent Developments
- 12.2.3.5. Financials (Based on Availability)
- 12.2.4 Ziehm Imaging GmbH
- 12.2.4.1. Overview
- 12.2.4.2. Products
- 12.2.4.3. SWOT Analysis
- 12.2.4.4. Recent Developments
- 12.2.4.5. Financials (Based on Availability)
- 12.2.5 Koninklijke Philips NV
- 12.2.5.1. Overview
- 12.2.5.2. Products
- 12.2.5.3. SWOT Analysis
- 12.2.5.4. Recent Developments
- 12.2.5.5. Financials (Based on Availability)
- 12.2.6 Canon Medical Systems Corporation
- 12.2.6.1. Overview
- 12.2.6.2. Products
- 12.2.6.3. SWOT Analysis
- 12.2.6.4. Recent Developments
- 12.2.6.5. Financials (Based on Availability)
- 12.2.7 Hologic Corporation
- 12.2.7.1. Overview
- 12.2.7.2. Products
- 12.2.7.3. SWOT Analysis
- 12.2.7.4. Recent Developments
- 12.2.7.5. Financials (Based on Availability)
- 12.2.8 OrthoScan Inc
- 12.2.8.1. Overview
- 12.2.8.2. Products
- 12.2.8.3. SWOT Analysis
- 12.2.8.4. Recent Developments
- 12.2.8.5. Financials (Based on Availability)
- 12.2.1 Shimadzu Medical*List Not Exhaustive
List of Figures
- Figure 1: Global MEA C-arms Industry Revenue Breakdown (Million, %) by Region 2024 & 2032
- Figure 2: North America MEA C-arms Industry Revenue (Million), by Country 2024 & 2032
- Figure 3: North America MEA C-arms Industry Revenue Share (%), by Country 2024 & 2032
- Figure 4: Europe MEA C-arms Industry Revenue (Million), by Country 2024 & 2032
- Figure 5: Europe MEA C-arms Industry Revenue Share (%), by Country 2024 & 2032
- Figure 6: Asia Pacific MEA C-arms Industry Revenue (Million), by Country 2024 & 2032
- Figure 7: Asia Pacific MEA C-arms Industry Revenue Share (%), by Country 2024 & 2032
- Figure 8: South America MEA C-arms Industry Revenue (Million), by Country 2024 & 2032
- Figure 9: South America MEA C-arms Industry Revenue Share (%), by Country 2024 & 2032
- Figure 10: North America MEA C-arms Industry Revenue (Million), by Country 2024 & 2032
- Figure 11: North America MEA C-arms Industry Revenue Share (%), by Country 2024 & 2032
- Figure 12: MEA MEA C-arms Industry Revenue (Million), by Country 2024 & 2032
- Figure 13: MEA MEA C-arms Industry Revenue Share (%), by Country 2024 & 2032
- Figure 14: Middle East and Africa MEA C-arms Industry Revenue (Million), by Type 2024 & 2032
- Figure 15: Middle East and Africa MEA C-arms Industry Revenue Share (%), by Type 2024 & 2032
- Figure 16: Middle East and Africa MEA C-arms Industry Revenue (Million), by Application 2024 & 2032
- Figure 17: Middle East and Africa MEA C-arms Industry Revenue Share (%), by Application 2024 & 2032
- Figure 18: Middle East and Africa MEA C-arms Industry Revenue (Million), by Geography 2024 & 2032
- Figure 19: Middle East and Africa MEA C-arms Industry Revenue Share (%), by Geography 2024 & 2032
- Figure 20: Middle East and Africa MEA C-arms Industry Revenue (Million), by Country 2024 & 2032
- Figure 21: Middle East and Africa MEA C-arms Industry Revenue Share (%), by Country 2024 & 2032
List of Tables
- Table 1: Global MEA C-arms Industry Revenue Million Forecast, by Region 2019 & 2032
- Table 2: Global MEA C-arms Industry Revenue Million Forecast, by Type 2019 & 2032
- Table 3: Global MEA C-arms Industry Revenue Million Forecast, by Application 2019 & 2032
- Table 4: Global MEA C-arms Industry Revenue Million Forecast, by Geography 2019 & 2032
- Table 5: Global MEA C-arms Industry Revenue Million Forecast, by Region 2019 & 2032
- Table 6: Global MEA C-arms Industry Revenue Million Forecast, by Country 2019 & 2032
- Table 7: United States MEA C-arms Industry Revenue (Million) Forecast, by Application 2019 & 2032
- Table 8: Canada MEA C-arms Industry Revenue (Million) Forecast, by Application 2019 & 2032
- Table 9: Mexico MEA C-arms Industry Revenue (Million) Forecast, by Application 2019 & 2032
- Table 10: Global MEA C-arms Industry Revenue Million Forecast, by Country 2019 & 2032
- Table 11: Germany MEA C-arms Industry Revenue (Million) Forecast, by Application 2019 & 2032
- Table 12: United Kingdom MEA C-arms Industry Revenue (Million) Forecast, by Application 2019 & 2032
- Table 13: France MEA C-arms Industry Revenue (Million) Forecast, by Application 2019 & 2032
- Table 14: Spain MEA C-arms Industry Revenue (Million) Forecast, by Application 2019 & 2032
- Table 15: Italy MEA C-arms Industry Revenue (Million) Forecast, by Application 2019 & 2032
- Table 16: Spain MEA C-arms Industry Revenue (Million) Forecast, by Application 2019 & 2032
- Table 17: Belgium MEA C-arms Industry Revenue (Million) Forecast, by Application 2019 & 2032
- Table 18: Netherland MEA C-arms Industry Revenue (Million) Forecast, by Application 2019 & 2032
- Table 19: Nordics MEA C-arms Industry Revenue (Million) Forecast, by Application 2019 & 2032
- Table 20: Rest of Europe MEA C-arms Industry Revenue (Million) Forecast, by Application 2019 & 2032
- Table 21: Global MEA C-arms Industry Revenue Million Forecast, by Country 2019 & 2032
- Table 22: China MEA C-arms Industry Revenue (Million) Forecast, by Application 2019 & 2032
- Table 23: Japan MEA C-arms Industry Revenue (Million) Forecast, by Application 2019 & 2032
- Table 24: India MEA C-arms Industry Revenue (Million) Forecast, by Application 2019 & 2032
- Table 25: South Korea MEA C-arms Industry Revenue (Million) Forecast, by Application 2019 & 2032
- Table 26: Southeast Asia MEA C-arms Industry Revenue (Million) Forecast, by Application 2019 & 2032
- Table 27: Australia MEA C-arms Industry Revenue (Million) Forecast, by Application 2019 & 2032
- Table 28: Indonesia MEA C-arms Industry Revenue (Million) Forecast, by Application 2019 & 2032
- Table 29: Phillipes MEA C-arms Industry Revenue (Million) Forecast, by Application 2019 & 2032
- Table 30: Singapore MEA C-arms Industry Revenue (Million) Forecast, by Application 2019 & 2032
- Table 31: Thailandc MEA C-arms Industry Revenue (Million) Forecast, by Application 2019 & 2032
- Table 32: Rest of Asia Pacific MEA C-arms Industry Revenue (Million) Forecast, by Application 2019 & 2032
- Table 33: Global MEA C-arms Industry Revenue Million Forecast, by Country 2019 & 2032
- Table 34: Brazil MEA C-arms Industry Revenue (Million) Forecast, by Application 2019 & 2032
- Table 35: Argentina MEA C-arms Industry Revenue (Million) Forecast, by Application 2019 & 2032
- Table 36: Peru MEA C-arms Industry Revenue (Million) Forecast, by Application 2019 & 2032
- Table 37: Chile MEA C-arms Industry Revenue (Million) Forecast, by Application 2019 & 2032
- Table 38: Colombia MEA C-arms Industry Revenue (Million) Forecast, by Application 2019 & 2032
- Table 39: Ecuador MEA C-arms Industry Revenue (Million) Forecast, by Application 2019 & 2032
- Table 40: Venezuela MEA C-arms Industry Revenue (Million) Forecast, by Application 2019 & 2032
- Table 41: Rest of South America MEA C-arms Industry Revenue (Million) Forecast, by Application 2019 & 2032
- Table 42: Global MEA C-arms Industry Revenue Million Forecast, by Country 2019 & 2032
- Table 43: United States MEA C-arms Industry Revenue (Million) Forecast, by Application 2019 & 2032
- Table 44: Canada MEA C-arms Industry Revenue (Million) Forecast, by Application 2019 & 2032
- Table 45: Mexico MEA C-arms Industry Revenue (Million) Forecast, by Application 2019 & 2032
- Table 46: Global MEA C-arms Industry Revenue Million Forecast, by Country 2019 & 2032
- Table 47: United Arab Emirates MEA C-arms Industry Revenue (Million) Forecast, by Application 2019 & 2032
- Table 48: Saudi Arabia MEA C-arms Industry Revenue (Million) Forecast, by Application 2019 & 2032
- Table 49: South Africa MEA C-arms Industry Revenue (Million) Forecast, by Application 2019 & 2032
- Table 50: Rest of Middle East and Africa MEA C-arms Industry Revenue (Million) Forecast, by Application 2019 & 2032
- Table 51: Global MEA C-arms Industry Revenue Million Forecast, by Type 2019 & 2032
- Table 52: Global MEA C-arms Industry Revenue Million Forecast, by Application 2019 & 2032
- Table 53: Global MEA C-arms Industry Revenue Million Forecast, by Geography 2019 & 2032
- Table 54: Global MEA C-arms Industry Revenue Million Forecast, by Country 2019 & 2032
- Table 55: GCC MEA C-arms Industry Revenue (Million) Forecast, by Application 2019 & 2032
- Table 56: South Africa MEA C-arms Industry Revenue (Million) Forecast, by Application 2019 & 2032
- Table 57: Rest of Middle East and Africa MEA C-arms Industry Revenue (Million) Forecast, by Application 2019 & 2032
Frequently Asked Questions
1. What is the projected Compound Annual Growth Rate (CAGR) of the MEA C-arms Industry?
The projected CAGR is approximately 5.46%.
2. Which companies are prominent players in the MEA C-arms Industry?
Key companies in the market include Shimadzu Medical*List Not Exhaustive, Siemens Healthineers, GE Healthcare, Ziehm Imaging GmbH, Koninklijke Philips NV, Canon Medical Systems Corporation, Hologic Corporation, OrthoScan Inc.
3. What are the main segments of the MEA C-arms Industry?
The market segments include Type, Application, Geography.
4. Can you provide details about the market size?
The market size is estimated to be USD 95.49 Million as of 2022.
5. What are some drivers contributing to market growth?
; Rising Geriatric Population and Increasing Burden of Chronic Diseases; Increasing Demand for Healthcare Infrastructure in the Region.
6. What are the notable trends driving market growth?
The Mini C-Arm Segment is Expected to Show Better Growth over the Forecast period.
7. Are there any restraints impacting market growth?
; Increasing use of Refurbished Devices.
8. Can you provide examples of recent developments in the market?
N/A
9. What pricing options are available for accessing the report?
Pricing options include single-user, multi-user, and enterprise licenses priced at USD 4750, USD 5250, and USD 8750 respectively.
10. Is the market size provided in terms of value or volume?
The market size is provided in terms of value, measured in Million.
11. Are there any specific market keywords associated with the report?
Yes, the market keyword associated with the report is "MEA C-arms Industry," which aids in identifying and referencing the specific market segment covered.
12. How do I determine which pricing option suits my needs best?
The pricing options vary based on user requirements and access needs. Individual users may opt for single-user licenses, while businesses requiring broader access may choose multi-user or enterprise licenses for cost-effective access to the report.
13. Are there any additional resources or data provided in the MEA C-arms Industry report?
While the report offers comprehensive insights, it's advisable to review the specific contents or supplementary materials provided to ascertain if additional resources or data are available.
14. How can I stay updated on further developments or reports in the MEA C-arms Industry?
To stay informed about further developments, trends, and reports in the MEA C-arms Industry, consider subscribing to industry newsletters, following relevant companies and organizations, or regularly checking reputable industry news sources and publications.
Methodology
Step 1 - Identification of Relevant Samples Size from Population Database


Step 2 - Approaches for Defining Global Market Size (Value, Volume* & Price*)

Note*: In applicable scenarios
Step 3 - Data Sources
Primary Research
- Web Analytics
- Survey Reports
- Research Institute
- Latest Research Reports
- Opinion Leaders
Secondary Research
- Annual Reports
- White Paper
- Latest Press Release
- Industry Association
- Paid Database
- Investor Presentations

Step 4 - Data Triangulation
Involves using different sources of information in order to increase the validity of a study
These sources are likely to be stakeholders in a program - participants, other researchers, program staff, other community members, and so on.
Then we put all data in single framework & apply various statistical tools to find out the dynamic on the market.
During the analysis stage, feedback from the stakeholder groups would be compared to determine areas of agreement as well as areas of divergence
