

Key Insights
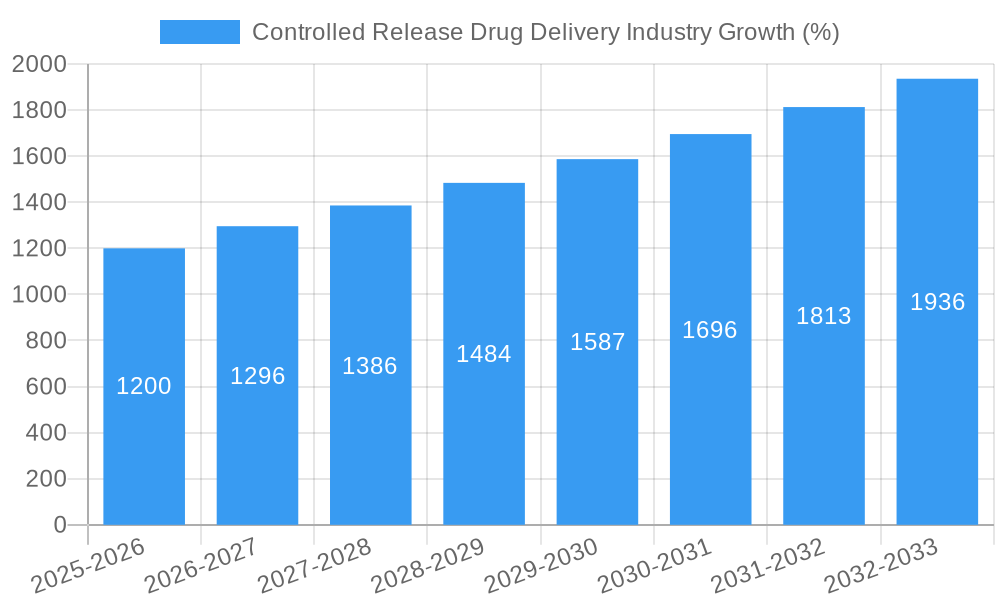
The controlled release drug delivery market is experiencing robust growth, projected to reach a significant size by 2033. A compound annual growth rate (CAGR) of 8% from 2025 to 2033 indicates a substantial expansion driven by several key factors. The increasing prevalence of chronic diseases necessitating long-term medication regimens fuels demand for controlled release formulations offering improved patient compliance and therapeutic efficacy. Technological advancements, such as microencapsulation, transdermal patches, and targeted drug delivery systems, are revolutionizing the industry, providing more precise and efficient drug administration. The rise in demand for convenient and patient-friendly dosage forms like inhalers and patches further contributes to market expansion. While regulatory hurdles and high research and development costs pose certain challenges, the overall market outlook remains positive, with significant growth opportunities across various segments and geographical regions.
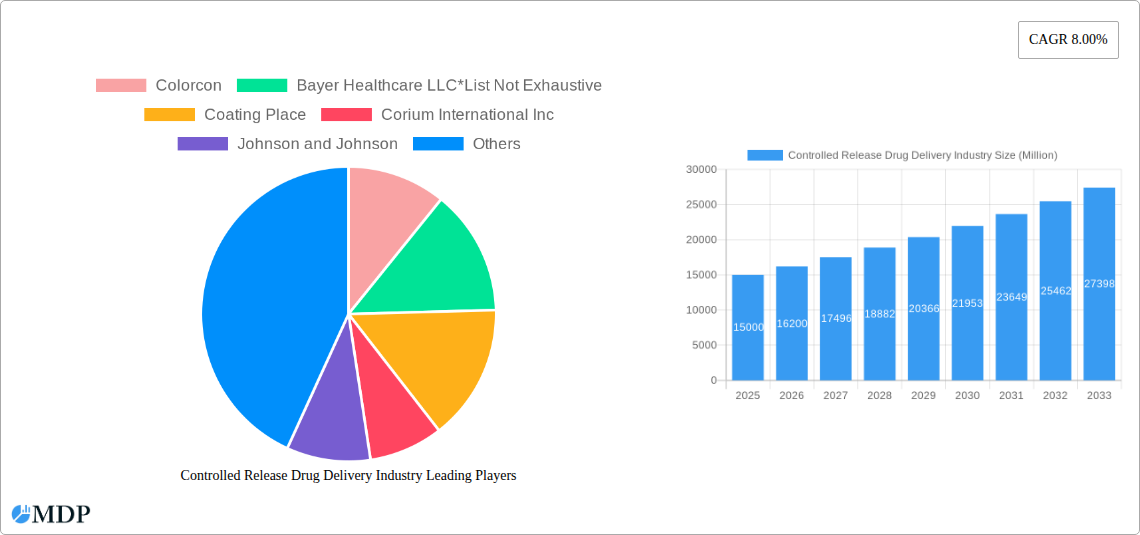
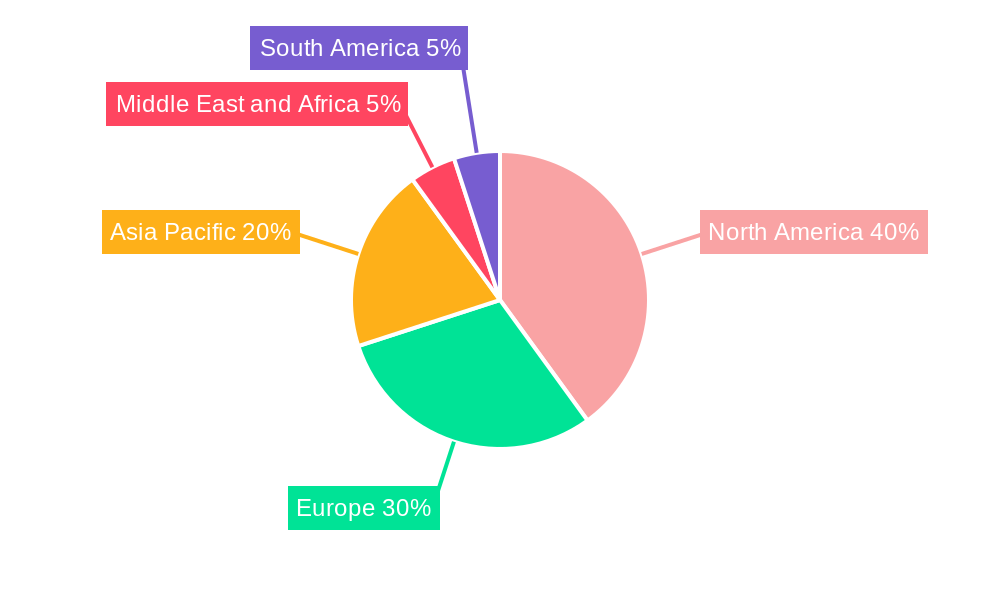
North America currently dominates the market, driven by high healthcare expenditure and a large patient population with chronic conditions. However, the Asia-Pacific region is expected to witness the fastest growth, propelled by rising healthcare infrastructure investments, increasing awareness of advanced drug delivery systems, and a burgeoning pharmaceutical industry. The market segmentation by technology (microencapsulation, transdermal, targeted delivery) and application (inhalers, injectables, patches) allows for a granular understanding of specific market dynamics. Major players like Colorcon, Bayer, Johnson & Johnson, and Merck & Co. are actively involved in developing innovative products and expanding their market presence through strategic collaborations and acquisitions. The continued focus on improving drug efficacy, reducing side effects, and enhancing patient convenience will remain key drivers for future market growth. The market will see consistent expansion and development of new, more effective, and convenient controlled release technologies throughout the forecast period.
Controlled Release Drug Delivery Industry: Market Analysis & Forecast 2019-2033
This comprehensive report provides a detailed analysis of the Controlled Release Drug Delivery industry, offering invaluable insights for stakeholders, investors, and industry professionals. With a study period spanning 2019-2033, a base year of 2025, and a forecast period of 2025-2033, this report unveils the market's dynamics, growth drivers, challenges, and future opportunities. The market is projected to reach xx Million by 2033, exhibiting a CAGR of xx% during the forecast period.
Controlled Release Drug Delivery Industry Market Dynamics & Concentration
The controlled release drug delivery market is characterized by a moderately concentrated landscape, with several key players holding significant market share. The market's dynamics are shaped by several factors, including continuous innovation in drug delivery technologies, stringent regulatory frameworks, the emergence of biosimilar and generic drugs which act as product substitutes, evolving end-user preferences toward personalized medicine, and a steady stream of mergers and acquisitions (M&A) activities.
- Market Concentration: The top five players account for approximately xx% of the global market share in 2025, indicating a moderately consolidated market. However, the presence of numerous smaller players and start-ups suggests a competitive environment.
- Innovation Drivers: The demand for improved drug efficacy, reduced side effects, and enhanced patient compliance fuels innovation in areas such as targeted drug delivery, microencapsulation, and implantable devices.
- Regulatory Frameworks: Stringent regulatory approvals and guidelines influence the market's growth trajectory, creating both opportunities and challenges for companies.
- Product Substitutes: The rise of biosimilars and generics exerts competitive pressure on innovator products, prompting the development of novel drug delivery systems to differentiate offerings.
- End-User Trends: Increasing prevalence of chronic diseases globally, along with a growing demand for convenient and effective drug delivery systems, are major drivers of market growth.
- M&A Activities: The industry witnesses frequent mergers and acquisitions, indicating strategic consolidation and efforts to expand product portfolios and market reach. An estimated xx M&A deals were recorded between 2019 and 2024.
Controlled Release Drug Delivery Industry Industry Trends & Analysis
The controlled release drug delivery market is experiencing robust growth, driven by several key trends. The increasing prevalence of chronic diseases like diabetes, cardiovascular diseases, and cancer significantly contributes to the market's expansion. Technological advancements, such as the development of advanced biomaterials and novel drug delivery systems, further accelerate market growth. Consumer preferences are shifting towards personalized medicine and improved patient outcomes, which are driving the demand for tailored drug delivery solutions. The competitive landscape is characterized by intense rivalry among established players and emerging companies, leading to continuous innovation and product differentiation. The market's growth is further fueled by favorable government policies and increasing healthcare spending globally. The market is expected to witness significant expansion in emerging economies due to increasing healthcare awareness and improving infrastructure. The projected CAGR of xx% indicates substantial market growth during the forecast period, with significant market penetration expected in key therapeutic areas.
Leading Markets & Segments in Controlled Release Drug Delivery Industry
The North American region currently dominates the controlled release drug delivery market, followed by Europe and Asia Pacific. Several factors contribute to this dominance, including robust healthcare infrastructure, substantial R&D investments, and high adoption rates of advanced drug delivery technologies.
By Technology:
- Microencapsulation: This segment is the largest, fueled by its versatility and suitability for various drug types. Key drivers include cost-effectiveness and ease of manufacturing.
- Transdermal: The transdermal segment benefits from its convenience and improved patient compliance, driving steady market growth.
- Targeted Delivery: This segment shows high growth potential due to its ability to improve drug efficacy and reduce side effects, attracting significant R&D investment.
- Other Technologies: This segment encompasses emerging technologies like implantable devices and inhalers, showing promising growth prospects.
By Application:
- Metered Dose Inhalers (MDIs): This segment dominates due to the widespread prevalence of respiratory diseases.
- Injectable: The injectable segment benefits from its high bioavailability and suitability for various therapeutic applications.
- Transdermal and Ocular Patches: These segments showcase growth driven by enhanced patient compliance and ease of administration.
- Other Applications: This segment includes various niche applications like implants and oral controlled-release formulations.
Key drivers for regional dominance include robust healthcare infrastructure, favorable regulatory environments, strong R&D investments, and high per capita healthcare spending. North America's advanced healthcare infrastructure and high adoption of new technologies contribute significantly to its leading market position.
Controlled Release Drug Delivery Industry Product Developments
Recent product innovations focus on enhancing drug efficacy, improving patient compliance, and reducing side effects. The development of novel biomaterials, advanced drug delivery systems, and personalized drug delivery solutions are shaping the competitive landscape. Companies are focusing on developing products with improved targeting capabilities, extended release profiles, and reduced invasiveness. These developments are driven by technological advances and the growing demand for safer and more effective drug delivery options that meet diverse patient needs.
Key Drivers of Controlled Release Drug Delivery Industry Growth
The controlled-release drug delivery market is driven by several key factors:
- Technological advancements: Innovations in biomaterials, microencapsulation techniques, and targeted delivery systems are fueling growth.
- Increasing prevalence of chronic diseases: The rising incidence of chronic conditions necessitates advanced drug delivery solutions for better treatment outcomes.
- Favorable regulatory environment: Supportive regulations promote innovation and accelerate the approval process for new drug delivery systems.
Challenges in the Controlled Release Drug Delivery Industry Market
The industry faces several challenges:
- Stringent regulatory hurdles: The complexities of regulatory approval processes increase development costs and time-to-market.
- Supply chain complexities: Securing reliable supplies of raw materials and manufacturing capacity poses a challenge.
- Intense competition: The presence of numerous established and emerging players creates a highly competitive market.
Emerging Opportunities in Controlled Release Drug Delivery Industry
Emerging opportunities include the development of personalized drug delivery systems, the expansion into new therapeutic areas, and strategic partnerships to leverage technological advancements and market access. Technological breakthroughs in areas such as nanotechnology and gene therapy promise to revolutionize drug delivery, opening up new avenues for growth.
Leading Players in the Controlled Release Drug Delivery Industry Sector
- Colorcon
- Bayer Healthcare LLC
- Coating Place
- Corium International Inc
- Johnson and Johnson
- Merck and Co Inc
- Lonza
- Adare Pharma Solutions
- GlaxoSmithKline PLC
Key Milestones in Controlled Release Drug Delivery Industry Industry
- June 2022: A research study at the University of Michigan demonstrated a novel drug microencapsulation method for peptide drugs, improving controlled release capabilities. This advancement is expected to significantly impact peptide drug therapies.
- March 2022: Evonik launched Eudratec SoluFlow, a microparticle technology enhancing the solubility of active pharmaceutical ingredients (APIs). This addresses the solubility issues of over 70% of new small molecules, creating opportunities in various therapeutic areas.
Strategic Outlook for Controlled Release Drug Delivery Industry Market
The future of the controlled release drug delivery market looks promising, driven by continuous technological innovation, the growing prevalence of chronic diseases, and the increasing demand for personalized medicine. Strategic partnerships, collaborations, and R&D investments will play a crucial role in shaping the market's future. Companies focusing on innovation, efficient manufacturing processes, and strong regulatory compliance are poised for significant growth in this dynamic and evolving market.
Controlled Release Drug Delivery Industry Segmentation
-
1. Technology
- 1.1. Micro Encapsulation
- 1.2. Transdermal
- 1.3. Targeted Delivery
- 1.4. Other Technologies
-
2. Application
- 2.1. Metered Dose Inhalers
- 2.2. Injectable
- 2.3. Transdermal and Ocular Patches
- 2.4. Other Applications
Controlled Release Drug Delivery Industry Segmentation By Geography
-
1. North America
- 1.1. United States
- 1.2. Canada
- 1.3. Mexico
-
2. Europe
- 2.1. Germany
- 2.2. United Kingdom
- 2.3. France
- 2.4. Italy
- 2.5. Spain
- 2.6. Rest of Europe
-
3. Asia Pacific
- 3.1. China
- 3.2. Japan
- 3.3. India
- 3.4. Australia
- 3.5. South Korea
- 3.6. Rest of Asia Pacific
-
4. Middle East and Africa
- 4.1. GCC
- 4.2. South Africa
- 4.3. Rest of Middle East and Africa
-
5. South America
- 5.1. Brazil
- 5.2. Argentina
- 5.3. Rest of South America
Controlled Release Drug Delivery Industry REPORT HIGHLIGHTS
| Aspects | Details |
|---|---|
| Study Period | 2019-2033 |
| Base Year | 2024 |
| Estimated Year | 2025 |
| Forecast Period | 2025-2033 |
| Historical Period | 2019-2024 |
| Growth Rate | CAGR of 8.00% from 2019-2033 |
| Segmentation |
|
Table of Contents
- 1. Introduction
- 1.1. Research Scope
- 1.2. Market Segmentation
- 1.3. Research Methodology
- 1.4. Definitions and Assumptions
- 2. Executive Summary
- 2.1. Introduction
- 3. Market Dynamics
- 3.1. Introduction
- 3.2. Market Drivers
- 3.2.1. Rise in Incidence of Chronic diseases; Growing Geriatric and Pediatric Population
- 3.3. Market Restrains
- 3.3.1. Higher Cost Compared to the Conventional Method
- 3.4. Market Trends
- 3.4.1. The Targeted Delivery Segment is Expected to Hold a Major Market Share in the Controlled Release Drug Delivery Market.
- 4. Market Factor Analysis
- 4.1. Porters Five Forces
- 4.2. Supply/Value Chain
- 4.3. PESTEL analysis
- 4.4. Market Entropy
- 4.5. Patent/Trademark Analysis
- 5. Global Controlled Release Drug Delivery Industry Analysis, Insights and Forecast, 2019-2031
- 5.1. Market Analysis, Insights and Forecast - by Technology
- 5.1.1. Micro Encapsulation
- 5.1.2. Transdermal
- 5.1.3. Targeted Delivery
- 5.1.4. Other Technologies
- 5.2. Market Analysis, Insights and Forecast - by Application
- 5.2.1. Metered Dose Inhalers
- 5.2.2. Injectable
- 5.2.3. Transdermal and Ocular Patches
- 5.2.4. Other Applications
- 5.3. Market Analysis, Insights and Forecast - by Region
- 5.3.1. North America
- 5.3.2. Europe
- 5.3.3. Asia Pacific
- 5.3.4. Middle East and Africa
- 5.3.5. South America
- 5.1. Market Analysis, Insights and Forecast - by Technology
- 6. North America Controlled Release Drug Delivery Industry Analysis, Insights and Forecast, 2019-2031
- 6.1. Market Analysis, Insights and Forecast - by Technology
- 6.1.1. Micro Encapsulation
- 6.1.2. Transdermal
- 6.1.3. Targeted Delivery
- 6.1.4. Other Technologies
- 6.2. Market Analysis, Insights and Forecast - by Application
- 6.2.1. Metered Dose Inhalers
- 6.2.2. Injectable
- 6.2.3. Transdermal and Ocular Patches
- 6.2.4. Other Applications
- 6.1. Market Analysis, Insights and Forecast - by Technology
- 7. Europe Controlled Release Drug Delivery Industry Analysis, Insights and Forecast, 2019-2031
- 7.1. Market Analysis, Insights and Forecast - by Technology
- 7.1.1. Micro Encapsulation
- 7.1.2. Transdermal
- 7.1.3. Targeted Delivery
- 7.1.4. Other Technologies
- 7.2. Market Analysis, Insights and Forecast - by Application
- 7.2.1. Metered Dose Inhalers
- 7.2.2. Injectable
- 7.2.3. Transdermal and Ocular Patches
- 7.2.4. Other Applications
- 7.1. Market Analysis, Insights and Forecast - by Technology
- 8. Asia Pacific Controlled Release Drug Delivery Industry Analysis, Insights and Forecast, 2019-2031
- 8.1. Market Analysis, Insights and Forecast - by Technology
- 8.1.1. Micro Encapsulation
- 8.1.2. Transdermal
- 8.1.3. Targeted Delivery
- 8.1.4. Other Technologies
- 8.2. Market Analysis, Insights and Forecast - by Application
- 8.2.1. Metered Dose Inhalers
- 8.2.2. Injectable
- 8.2.3. Transdermal and Ocular Patches
- 8.2.4. Other Applications
- 8.1. Market Analysis, Insights and Forecast - by Technology
- 9. Middle East and Africa Controlled Release Drug Delivery Industry Analysis, Insights and Forecast, 2019-2031
- 9.1. Market Analysis, Insights and Forecast - by Technology
- 9.1.1. Micro Encapsulation
- 9.1.2. Transdermal
- 9.1.3. Targeted Delivery
- 9.1.4. Other Technologies
- 9.2. Market Analysis, Insights and Forecast - by Application
- 9.2.1. Metered Dose Inhalers
- 9.2.2. Injectable
- 9.2.3. Transdermal and Ocular Patches
- 9.2.4. Other Applications
- 9.1. Market Analysis, Insights and Forecast - by Technology
- 10. South America Controlled Release Drug Delivery Industry Analysis, Insights and Forecast, 2019-2031
- 10.1. Market Analysis, Insights and Forecast - by Technology
- 10.1.1. Micro Encapsulation
- 10.1.2. Transdermal
- 10.1.3. Targeted Delivery
- 10.1.4. Other Technologies
- 10.2. Market Analysis, Insights and Forecast - by Application
- 10.2.1. Metered Dose Inhalers
- 10.2.2. Injectable
- 10.2.3. Transdermal and Ocular Patches
- 10.2.4. Other Applications
- 10.1. Market Analysis, Insights and Forecast - by Technology
- 11. North America Controlled Release Drug Delivery Industry Analysis, Insights and Forecast, 2019-2031
- 11.1. Market Analysis, Insights and Forecast - By Country/Sub-region
- 11.1.1 United States
- 11.1.2 Canada
- 11.1.3 Mexico
- 12. Europe Controlled Release Drug Delivery Industry Analysis, Insights and Forecast, 2019-2031
- 12.1. Market Analysis, Insights and Forecast - By Country/Sub-region
- 12.1.1 Germany
- 12.1.2 United Kingdom
- 12.1.3 France
- 12.1.4 Italy
- 12.1.5 Spain
- 12.1.6 Rest of Europe
- 13. Asia Pacific Controlled Release Drug Delivery Industry Analysis, Insights and Forecast, 2019-2031
- 13.1. Market Analysis, Insights and Forecast - By Country/Sub-region
- 13.1.1 China
- 13.1.2 Japan
- 13.1.3 India
- 13.1.4 Australia
- 13.1.5 South Korea
- 13.1.6 Rest of Asia Pacific
- 14. Middle East and Africa Controlled Release Drug Delivery Industry Analysis, Insights and Forecast, 2019-2031
- 14.1. Market Analysis, Insights and Forecast - By Country/Sub-region
- 14.1.1 GCC
- 14.1.2 South Africa
- 14.1.3 Rest of Middle East and Africa
- 15. South America Controlled Release Drug Delivery Industry Analysis, Insights and Forecast, 2019-2031
- 15.1. Market Analysis, Insights and Forecast - By Country/Sub-region
- 15.1.1 Brazil
- 15.1.2 Argentina
- 15.1.3 Rest of South America
- 16. Competitive Analysis
- 16.1. Global Market Share Analysis 2024
- 16.2. Company Profiles
- 16.2.1 Colorcon
- 16.2.1.1. Overview
- 16.2.1.2. Products
- 16.2.1.3. SWOT Analysis
- 16.2.1.4. Recent Developments
- 16.2.1.5. Financials (Based on Availability)
- 16.2.2 Bayer Healthcare LLC*List Not Exhaustive
- 16.2.2.1. Overview
- 16.2.2.2. Products
- 16.2.2.3. SWOT Analysis
- 16.2.2.4. Recent Developments
- 16.2.2.5. Financials (Based on Availability)
- 16.2.3 Coating Place
- 16.2.3.1. Overview
- 16.2.3.2. Products
- 16.2.3.3. SWOT Analysis
- 16.2.3.4. Recent Developments
- 16.2.3.5. Financials (Based on Availability)
- 16.2.4 Corium International Inc
- 16.2.4.1. Overview
- 16.2.4.2. Products
- 16.2.4.3. SWOT Analysis
- 16.2.4.4. Recent Developments
- 16.2.4.5. Financials (Based on Availability)
- 16.2.5 Johnson and Johnson
- 16.2.5.1. Overview
- 16.2.5.2. Products
- 16.2.5.3. SWOT Analysis
- 16.2.5.4. Recent Developments
- 16.2.5.5. Financials (Based on Availability)
- 16.2.6 Merck and Co Inc
- 16.2.6.1. Overview
- 16.2.6.2. Products
- 16.2.6.3. SWOT Analysis
- 16.2.6.4. Recent Developments
- 16.2.6.5. Financials (Based on Availability)
- 16.2.7 Lonza
- 16.2.7.1. Overview
- 16.2.7.2. Products
- 16.2.7.3. SWOT Analysis
- 16.2.7.4. Recent Developments
- 16.2.7.5. Financials (Based on Availability)
- 16.2.8 Adare Pharma Solutions
- 16.2.8.1. Overview
- 16.2.8.2. Products
- 16.2.8.3. SWOT Analysis
- 16.2.8.4. Recent Developments
- 16.2.8.5. Financials (Based on Availability)
- 16.2.9 GlaxoSmithKline PLC
- 16.2.9.1. Overview
- 16.2.9.2. Products
- 16.2.9.3. SWOT Analysis
- 16.2.9.4. Recent Developments
- 16.2.9.5. Financials (Based on Availability)
- 16.2.1 Colorcon
List of Figures
- Figure 1: Global Controlled Release Drug Delivery Industry Revenue Breakdown (Million, %) by Region 2024 & 2032
- Figure 2: North America Controlled Release Drug Delivery Industry Revenue (Million), by Country 2024 & 2032
- Figure 3: North America Controlled Release Drug Delivery Industry Revenue Share (%), by Country 2024 & 2032
- Figure 4: Europe Controlled Release Drug Delivery Industry Revenue (Million), by Country 2024 & 2032
- Figure 5: Europe Controlled Release Drug Delivery Industry Revenue Share (%), by Country 2024 & 2032
- Figure 6: Asia Pacific Controlled Release Drug Delivery Industry Revenue (Million), by Country 2024 & 2032
- Figure 7: Asia Pacific Controlled Release Drug Delivery Industry Revenue Share (%), by Country 2024 & 2032
- Figure 8: Middle East and Africa Controlled Release Drug Delivery Industry Revenue (Million), by Country 2024 & 2032
- Figure 9: Middle East and Africa Controlled Release Drug Delivery Industry Revenue Share (%), by Country 2024 & 2032
- Figure 10: South America Controlled Release Drug Delivery Industry Revenue (Million), by Country 2024 & 2032
- Figure 11: South America Controlled Release Drug Delivery Industry Revenue Share (%), by Country 2024 & 2032
- Figure 12: North America Controlled Release Drug Delivery Industry Revenue (Million), by Technology 2024 & 2032
- Figure 13: North America Controlled Release Drug Delivery Industry Revenue Share (%), by Technology 2024 & 2032
- Figure 14: North America Controlled Release Drug Delivery Industry Revenue (Million), by Application 2024 & 2032
- Figure 15: North America Controlled Release Drug Delivery Industry Revenue Share (%), by Application 2024 & 2032
- Figure 16: North America Controlled Release Drug Delivery Industry Revenue (Million), by Country 2024 & 2032
- Figure 17: North America Controlled Release Drug Delivery Industry Revenue Share (%), by Country 2024 & 2032
- Figure 18: Europe Controlled Release Drug Delivery Industry Revenue (Million), by Technology 2024 & 2032
- Figure 19: Europe Controlled Release Drug Delivery Industry Revenue Share (%), by Technology 2024 & 2032
- Figure 20: Europe Controlled Release Drug Delivery Industry Revenue (Million), by Application 2024 & 2032
- Figure 21: Europe Controlled Release Drug Delivery Industry Revenue Share (%), by Application 2024 & 2032
- Figure 22: Europe Controlled Release Drug Delivery Industry Revenue (Million), by Country 2024 & 2032
- Figure 23: Europe Controlled Release Drug Delivery Industry Revenue Share (%), by Country 2024 & 2032
- Figure 24: Asia Pacific Controlled Release Drug Delivery Industry Revenue (Million), by Technology 2024 & 2032
- Figure 25: Asia Pacific Controlled Release Drug Delivery Industry Revenue Share (%), by Technology 2024 & 2032
- Figure 26: Asia Pacific Controlled Release Drug Delivery Industry Revenue (Million), by Application 2024 & 2032
- Figure 27: Asia Pacific Controlled Release Drug Delivery Industry Revenue Share (%), by Application 2024 & 2032
- Figure 28: Asia Pacific Controlled Release Drug Delivery Industry Revenue (Million), by Country 2024 & 2032
- Figure 29: Asia Pacific Controlled Release Drug Delivery Industry Revenue Share (%), by Country 2024 & 2032
- Figure 30: Middle East and Africa Controlled Release Drug Delivery Industry Revenue (Million), by Technology 2024 & 2032
- Figure 31: Middle East and Africa Controlled Release Drug Delivery Industry Revenue Share (%), by Technology 2024 & 2032
- Figure 32: Middle East and Africa Controlled Release Drug Delivery Industry Revenue (Million), by Application 2024 & 2032
- Figure 33: Middle East and Africa Controlled Release Drug Delivery Industry Revenue Share (%), by Application 2024 & 2032
- Figure 34: Middle East and Africa Controlled Release Drug Delivery Industry Revenue (Million), by Country 2024 & 2032
- Figure 35: Middle East and Africa Controlled Release Drug Delivery Industry Revenue Share (%), by Country 2024 & 2032
- Figure 36: South America Controlled Release Drug Delivery Industry Revenue (Million), by Technology 2024 & 2032
- Figure 37: South America Controlled Release Drug Delivery Industry Revenue Share (%), by Technology 2024 & 2032
- Figure 38: South America Controlled Release Drug Delivery Industry Revenue (Million), by Application 2024 & 2032
- Figure 39: South America Controlled Release Drug Delivery Industry Revenue Share (%), by Application 2024 & 2032
- Figure 40: South America Controlled Release Drug Delivery Industry Revenue (Million), by Country 2024 & 2032
- Figure 41: South America Controlled Release Drug Delivery Industry Revenue Share (%), by Country 2024 & 2032
List of Tables
- Table 1: Global Controlled Release Drug Delivery Industry Revenue Million Forecast, by Region 2019 & 2032
- Table 2: Global Controlled Release Drug Delivery Industry Revenue Million Forecast, by Technology 2019 & 2032
- Table 3: Global Controlled Release Drug Delivery Industry Revenue Million Forecast, by Application 2019 & 2032
- Table 4: Global Controlled Release Drug Delivery Industry Revenue Million Forecast, by Region 2019 & 2032
- Table 5: Global Controlled Release Drug Delivery Industry Revenue Million Forecast, by Country 2019 & 2032
- Table 6: United States Controlled Release Drug Delivery Industry Revenue (Million) Forecast, by Application 2019 & 2032
- Table 7: Canada Controlled Release Drug Delivery Industry Revenue (Million) Forecast, by Application 2019 & 2032
- Table 8: Mexico Controlled Release Drug Delivery Industry Revenue (Million) Forecast, by Application 2019 & 2032
- Table 9: Global Controlled Release Drug Delivery Industry Revenue Million Forecast, by Country 2019 & 2032
- Table 10: Germany Controlled Release Drug Delivery Industry Revenue (Million) Forecast, by Application 2019 & 2032
- Table 11: United Kingdom Controlled Release Drug Delivery Industry Revenue (Million) Forecast, by Application 2019 & 2032
- Table 12: France Controlled Release Drug Delivery Industry Revenue (Million) Forecast, by Application 2019 & 2032
- Table 13: Italy Controlled Release Drug Delivery Industry Revenue (Million) Forecast, by Application 2019 & 2032
- Table 14: Spain Controlled Release Drug Delivery Industry Revenue (Million) Forecast, by Application 2019 & 2032
- Table 15: Rest of Europe Controlled Release Drug Delivery Industry Revenue (Million) Forecast, by Application 2019 & 2032
- Table 16: Global Controlled Release Drug Delivery Industry Revenue Million Forecast, by Country 2019 & 2032
- Table 17: China Controlled Release Drug Delivery Industry Revenue (Million) Forecast, by Application 2019 & 2032
- Table 18: Japan Controlled Release Drug Delivery Industry Revenue (Million) Forecast, by Application 2019 & 2032
- Table 19: India Controlled Release Drug Delivery Industry Revenue (Million) Forecast, by Application 2019 & 2032
- Table 20: Australia Controlled Release Drug Delivery Industry Revenue (Million) Forecast, by Application 2019 & 2032
- Table 21: South Korea Controlled Release Drug Delivery Industry Revenue (Million) Forecast, by Application 2019 & 2032
- Table 22: Rest of Asia Pacific Controlled Release Drug Delivery Industry Revenue (Million) Forecast, by Application 2019 & 2032
- Table 23: Global Controlled Release Drug Delivery Industry Revenue Million Forecast, by Country 2019 & 2032
- Table 24: GCC Controlled Release Drug Delivery Industry Revenue (Million) Forecast, by Application 2019 & 2032
- Table 25: South Africa Controlled Release Drug Delivery Industry Revenue (Million) Forecast, by Application 2019 & 2032
- Table 26: Rest of Middle East and Africa Controlled Release Drug Delivery Industry Revenue (Million) Forecast, by Application 2019 & 2032
- Table 27: Global Controlled Release Drug Delivery Industry Revenue Million Forecast, by Country 2019 & 2032
- Table 28: Brazil Controlled Release Drug Delivery Industry Revenue (Million) Forecast, by Application 2019 & 2032
- Table 29: Argentina Controlled Release Drug Delivery Industry Revenue (Million) Forecast, by Application 2019 & 2032
- Table 30: Rest of South America Controlled Release Drug Delivery Industry Revenue (Million) Forecast, by Application 2019 & 2032
- Table 31: Global Controlled Release Drug Delivery Industry Revenue Million Forecast, by Technology 2019 & 2032
- Table 32: Global Controlled Release Drug Delivery Industry Revenue Million Forecast, by Application 2019 & 2032
- Table 33: Global Controlled Release Drug Delivery Industry Revenue Million Forecast, by Country 2019 & 2032
- Table 34: United States Controlled Release Drug Delivery Industry Revenue (Million) Forecast, by Application 2019 & 2032
- Table 35: Canada Controlled Release Drug Delivery Industry Revenue (Million) Forecast, by Application 2019 & 2032
- Table 36: Mexico Controlled Release Drug Delivery Industry Revenue (Million) Forecast, by Application 2019 & 2032
- Table 37: Global Controlled Release Drug Delivery Industry Revenue Million Forecast, by Technology 2019 & 2032
- Table 38: Global Controlled Release Drug Delivery Industry Revenue Million Forecast, by Application 2019 & 2032
- Table 39: Global Controlled Release Drug Delivery Industry Revenue Million Forecast, by Country 2019 & 2032
- Table 40: Germany Controlled Release Drug Delivery Industry Revenue (Million) Forecast, by Application 2019 & 2032
- Table 41: United Kingdom Controlled Release Drug Delivery Industry Revenue (Million) Forecast, by Application 2019 & 2032
- Table 42: France Controlled Release Drug Delivery Industry Revenue (Million) Forecast, by Application 2019 & 2032
- Table 43: Italy Controlled Release Drug Delivery Industry Revenue (Million) Forecast, by Application 2019 & 2032
- Table 44: Spain Controlled Release Drug Delivery Industry Revenue (Million) Forecast, by Application 2019 & 2032
- Table 45: Rest of Europe Controlled Release Drug Delivery Industry Revenue (Million) Forecast, by Application 2019 & 2032
- Table 46: Global Controlled Release Drug Delivery Industry Revenue Million Forecast, by Technology 2019 & 2032
- Table 47: Global Controlled Release Drug Delivery Industry Revenue Million Forecast, by Application 2019 & 2032
- Table 48: Global Controlled Release Drug Delivery Industry Revenue Million Forecast, by Country 2019 & 2032
- Table 49: China Controlled Release Drug Delivery Industry Revenue (Million) Forecast, by Application 2019 & 2032
- Table 50: Japan Controlled Release Drug Delivery Industry Revenue (Million) Forecast, by Application 2019 & 2032
- Table 51: India Controlled Release Drug Delivery Industry Revenue (Million) Forecast, by Application 2019 & 2032
- Table 52: Australia Controlled Release Drug Delivery Industry Revenue (Million) Forecast, by Application 2019 & 2032
- Table 53: South Korea Controlled Release Drug Delivery Industry Revenue (Million) Forecast, by Application 2019 & 2032
- Table 54: Rest of Asia Pacific Controlled Release Drug Delivery Industry Revenue (Million) Forecast, by Application 2019 & 2032
- Table 55: Global Controlled Release Drug Delivery Industry Revenue Million Forecast, by Technology 2019 & 2032
- Table 56: Global Controlled Release Drug Delivery Industry Revenue Million Forecast, by Application 2019 & 2032
- Table 57: Global Controlled Release Drug Delivery Industry Revenue Million Forecast, by Country 2019 & 2032
- Table 58: GCC Controlled Release Drug Delivery Industry Revenue (Million) Forecast, by Application 2019 & 2032
- Table 59: South Africa Controlled Release Drug Delivery Industry Revenue (Million) Forecast, by Application 2019 & 2032
- Table 60: Rest of Middle East and Africa Controlled Release Drug Delivery Industry Revenue (Million) Forecast, by Application 2019 & 2032
- Table 61: Global Controlled Release Drug Delivery Industry Revenue Million Forecast, by Technology 2019 & 2032
- Table 62: Global Controlled Release Drug Delivery Industry Revenue Million Forecast, by Application 2019 & 2032
- Table 63: Global Controlled Release Drug Delivery Industry Revenue Million Forecast, by Country 2019 & 2032
- Table 64: Brazil Controlled Release Drug Delivery Industry Revenue (Million) Forecast, by Application 2019 & 2032
- Table 65: Argentina Controlled Release Drug Delivery Industry Revenue (Million) Forecast, by Application 2019 & 2032
- Table 66: Rest of South America Controlled Release Drug Delivery Industry Revenue (Million) Forecast, by Application 2019 & 2032
Frequently Asked Questions
1. What is the projected Compound Annual Growth Rate (CAGR) of the Controlled Release Drug Delivery Industry?
The projected CAGR is approximately 8.00%.
2. Which companies are prominent players in the Controlled Release Drug Delivery Industry?
Key companies in the market include Colorcon, Bayer Healthcare LLC*List Not Exhaustive, Coating Place, Corium International Inc, Johnson and Johnson, Merck and Co Inc, Lonza, Adare Pharma Solutions, GlaxoSmithKline PLC.
3. What are the main segments of the Controlled Release Drug Delivery Industry?
The market segments include Technology, Application.
4. Can you provide details about the market size?
The market size is estimated to be USD XX Million as of 2022.
5. What are some drivers contributing to market growth?
Rise in Incidence of Chronic diseases; Growing Geriatric and Pediatric Population.
6. What are the notable trends driving market growth?
The Targeted Delivery Segment is Expected to Hold a Major Market Share in the Controlled Release Drug Delivery Market..
7. Are there any restraints impacting market growth?
Higher Cost Compared to the Conventional Method.
8. Can you provide examples of recent developments in the market?
June 2022: A research study was conducted at the University of Michigan that demonstrated a new method of drug microencapsulation, allowing several peptide drugs to be slowly released into the body.
9. What pricing options are available for accessing the report?
Pricing options include single-user, multi-user, and enterprise licenses priced at USD 4750, USD 5250, and USD 8750 respectively.
10. Is the market size provided in terms of value or volume?
The market size is provided in terms of value, measured in Million.
11. Are there any specific market keywords associated with the report?
Yes, the market keyword associated with the report is "Controlled Release Drug Delivery Industry," which aids in identifying and referencing the specific market segment covered.
12. How do I determine which pricing option suits my needs best?
The pricing options vary based on user requirements and access needs. Individual users may opt for single-user licenses, while businesses requiring broader access may choose multi-user or enterprise licenses for cost-effective access to the report.
13. Are there any additional resources or data provided in the Controlled Release Drug Delivery Industry report?
While the report offers comprehensive insights, it's advisable to review the specific contents or supplementary materials provided to ascertain if additional resources or data are available.
14. How can I stay updated on further developments or reports in the Controlled Release Drug Delivery Industry?
To stay informed about further developments, trends, and reports in the Controlled Release Drug Delivery Industry, consider subscribing to industry newsletters, following relevant companies and organizations, or regularly checking reputable industry news sources and publications.
Methodology
Step 1 - Identification of Relevant Samples Size from Population Database


Step 2 - Approaches for Defining Global Market Size (Value, Volume* & Price*)

Note*: In applicable scenarios
Step 3 - Data Sources
Primary Research
- Web Analytics
- Survey Reports
- Research Institute
- Latest Research Reports
- Opinion Leaders
Secondary Research
- Annual Reports
- White Paper
- Latest Press Release
- Industry Association
- Paid Database
- Investor Presentations

Step 4 - Data Triangulation
Involves using different sources of information in order to increase the validity of a study
These sources are likely to be stakeholders in a program - participants, other researchers, program staff, other community members, and so on.
Then we put all data in single framework & apply various statistical tools to find out the dynamic on the market.
During the analysis stage, feedback from the stakeholder groups would be compared to determine areas of agreement as well as areas of divergence
