

Key Insights
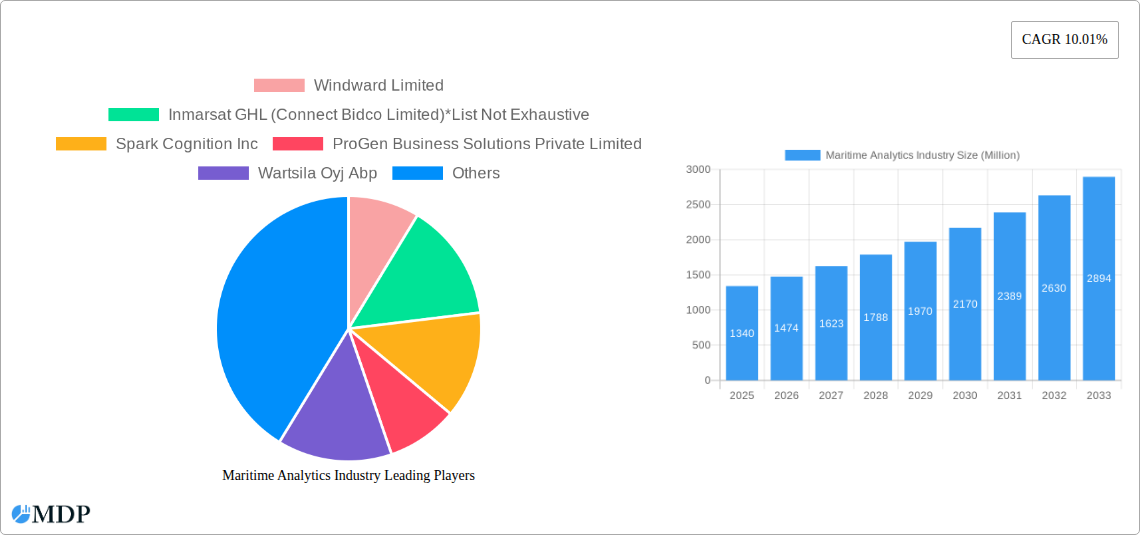
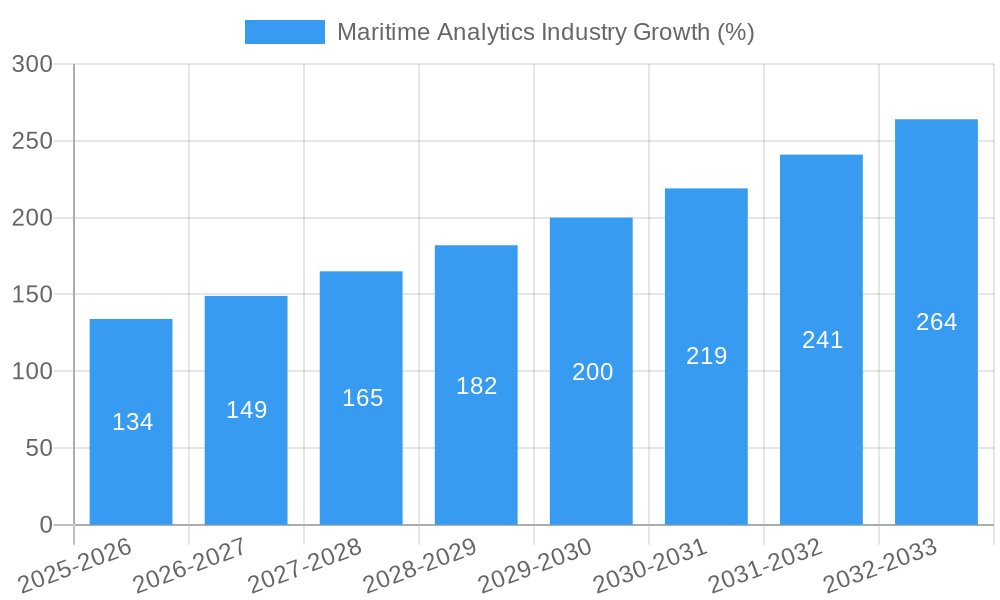
The maritime analytics market, valued at $1.34 billion in 2025, is projected to experience robust growth, driven by the increasing need for operational efficiency and safety within the shipping industry. A Compound Annual Growth Rate (CAGR) of 10.01% is anticipated from 2025 to 2033, indicating a significant expansion of the market. This growth is fueled by several key factors. The adoption of predictive and prescriptive maintenance significantly reduces downtime and repair costs, leading to substantial operational savings. Furthermore, advancements in voyage optimization technologies, utilizing real-time data analysis, are enabling shipping companies to reduce fuel consumption and improve delivery times. Fleet management solutions, powered by maritime analytics, enhance overall fleet efficiency and safety by providing comprehensive monitoring and analysis capabilities. The government sector's growing emphasis on regulatory compliance and environmental sustainability is also driving market growth, pushing for the adoption of advanced analytics solutions. The diverse range of applications, from optimizing cargo handling to enhancing cybersecurity, further contributes to the expansion of this dynamic market.
The key players in the maritime analytics market are leveraging advanced technologies like AI and machine learning to offer increasingly sophisticated solutions. This includes companies such as Windward, Inmarsat, Spark Cognition, and Wartsila, all striving to capitalize on the burgeoning demand for data-driven insights in the maritime sector. The market is segmented by end-user (government and commercial) and application (predictive and prescriptive maintenance, voyage operations, fleet management, and others). Geographic distribution is expected to be diversified, with North America and Europe holding significant market shares initially, followed by increasing adoption in the Asia-Pacific region driven by the growth of shipping activity in this area. Competition is likely to intensify as technology evolves and new entrants emerge, further shaping the future landscape of the maritime analytics industry.
Maritime Analytics Industry: A Comprehensive Market Report (2019-2033)
This comprehensive report provides an in-depth analysis of the Maritime Analytics industry, projecting a market value of xx Million by 2033. The study covers the period from 2019 to 2033, with a base year of 2025 and a forecast period from 2025 to 2033. This report is essential for industry stakeholders, investors, and anyone seeking to understand the dynamics and future potential of this rapidly evolving sector. Gain actionable insights into market trends, key players, and emerging opportunities to make informed strategic decisions.
Maritime Analytics Industry Market Dynamics & Concentration
The Maritime Analytics market is experiencing significant growth fueled by increasing demand for enhanced operational efficiency, safety, and regulatory compliance within the shipping industry. Market concentration is moderate, with several key players holding substantial market share but with room for further consolidation. Innovation in areas such as AI, machine learning, and IoT is driving significant advancements, while stringent regulatory frameworks concerning emissions and safety standards continue to shape industry practices. Product substitutes, while limited, include traditional manual methods and less sophisticated data analysis techniques, although their use is rapidly declining. The shift towards digitalization is also evident in evolving end-user trends, with both government and commercial sectors increasingly adopting sophisticated analytics solutions. M&A activity remains moderate, reflecting a consolidating market with xx major deals recorded in the historical period (2019-2024), indicating a strategic focus on acquiring specialized technologies and expanding market reach. Several companies have achieved notable market penetration. For example, Wartsila, with a market share exceeding 20%, showcases the potential for significant growth in the sector.
- Market Concentration: Moderate, with key players holding significant but not dominant shares.
- Innovation Drivers: AI, Machine Learning, IoT, Big Data Analytics.
- Regulatory Frameworks: IMO regulations, emission standards, safety compliance.
- Product Substitutes: Traditional manual methods, basic data analysis techniques.
- End-User Trends: Increasing adoption by both government and commercial sectors.
- M&A Activity: xx deals recorded between 2019-2024, reflecting a consolidating market.
Maritime Analytics Industry Industry Trends & Analysis
The Maritime Analytics market is projected to exhibit a Compound Annual Growth Rate (CAGR) of xx% during the forecast period (2025-2033). This growth is primarily driven by several key factors: the increasing adoption of digital technologies across the maritime sector, stringent environmental regulations pushing for greater efficiency, the growing demand for predictive maintenance to minimize downtime and operational costs, and the need for enhanced security and safety measures. Technological disruptions, particularly in AI and machine learning, are revolutionizing data analysis and prediction capabilities, leading to improved decision-making and operational optimization. Consumer preferences are shifting towards integrated solutions that offer comprehensive data insights and seamless integration with existing systems. Competitive dynamics are characterized by a mix of established players and emerging innovators, leading to continuous product development and improvement. Market penetration of advanced analytics solutions is growing steadily, with a significant increase expected in the coming years, particularly within the commercial shipping sector.
Leading Markets & Segments in Maritime Analytics Industry
The global Maritime Analytics market is witnessing substantial growth across various segments. While specific market share data by region and segment requires further research (xx Million), based on preliminary findings, the commercial sector is expected to lead the market share within the End-User segment, driven by the need for cost optimization and efficiency enhancements. Within Applications, the Fleet Management segment is likely to dominate, given the widespread deployment of analytics solutions for tracking, monitoring, and optimizing vessel performance. Furthermore, predictive maintenance remains a crucial application, pushing growth in this segment.
Key Drivers by Segment:
- Commercial (End-User): Cost optimization, efficiency improvements, competitive advantage.
- Government (End-User): Regulatory compliance, port security, environmental monitoring.
- Fleet Management (Application): Real-time tracking, route optimization, fuel efficiency.
- Predictive & Prescriptive Maintenance (Application): Reduced downtime, cost savings, extended lifespan.
Dominance Analysis: The commercial sector's dominance stems from a greater financial incentive to adopt analytics, while fleet management's prevalence is driven by its wide applicability across various vessel types and operational contexts.
Maritime Analytics Industry Product Developments
Recent product developments in the Maritime Analytics industry have focused on enhancing the integration of AI and machine learning capabilities into existing solutions. This allows for more accurate predictive modelling, more efficient data analysis, and the provision of more actionable insights for vessel operators and fleet managers. This integration also contributes to improved decision-making, enhanced safety, and optimized operational processes. The market is seeing a trend towards cloud-based solutions that offer greater scalability, accessibility, and cost-effectiveness. The development of user-friendly interfaces and intuitive dashboards enhances adoption across the industry. These developments significantly improve the market fit of Maritime Analytics solutions, addressing the evolving needs of a technologically advancing shipping industry.
Key Drivers of Maritime Analytics Industry Growth
Several factors contribute to the robust growth of the Maritime Analytics industry. Technological advancements, especially in AI and machine learning, are enhancing the accuracy and efficiency of analytics. Stringent environmental regulations, demanding fuel efficiency and reduced emissions, necessitate the adoption of optimized operations supported by analytics. Finally, the increasing focus on safety and security within the maritime sector fuels demand for sophisticated analytics solutions to prevent incidents and enhance response capabilities. The combination of these factors positions the Maritime Analytics market for continued expansion.
Challenges in the Maritime Analytics Industry Market
The Maritime Analytics market faces challenges, including the high cost of implementation and integration of advanced systems, the need for robust cybersecurity measures to protect sensitive data, and the potential for data silos within organizations hindering comprehensive analysis. Furthermore, ensuring reliable connectivity across diverse geographical areas and maintaining data quality from numerous sources presents significant obstacles. Competition from established players and new entrants also creates pressure. The impact of these factors is reflected in a slightly slower adoption rate compared to projections initially made, a delay estimated at xx%.
Emerging Opportunities in Maritime Analytics Industry
Several opportunities exist for growth in the Maritime Analytics industry. Emerging technologies such as blockchain technology can further enhance security and transparency in data management. The development of specialized analytics for niche segments within the maritime sector, such as cruise lines or offshore wind energy operations, holds significant potential. Strategic partnerships between technology providers and shipping companies facilitate greater adoption and integration of solutions. Expansion into new geographical markets, particularly in developing economies, also presents substantial opportunities for growth.
Leading Players in the Maritime Analytics Industry Sector
- Windward Limited (Windward Limited)
- Inmarsat GHL (Connect Bidco Limited)
- Spark Cognition Inc
- ProGen Business Solutions Private Limited
- Wartsila Oyj Abp (Wartsila Oyj Abp)
- Amplify Mindware Private Limited
- ABB Limited (ABB Limited)
- Prisma Electronics SA (Laros)
- U-Ming Marine Transport Corporation
- Spire Global Inc (Spire Global Inc)
Key Milestones in Maritime Analytics Industry Industry
- January 2022: NAVTOR acquired Ingenium Marine and Tres Solutions, strengthening its e-Navigation and performance suite.
- March 2022: U-Ming Marine Transport Corporation launched the M.V. Cemtex Excellence, showcasing advanced digital operating systems.
- May 2022: Wärtsilä developed and received orders for over 70 hybrid vessels, demonstrating significant market adoption of their technology.
Strategic Outlook for Maritime Analytics Industry Market
The Maritime Analytics market presents significant long-term growth potential driven by continuous technological advancements, escalating demand for operational efficiency, and increasing regulatory pressures. Strategic opportunities lie in developing innovative solutions that address specific industry needs, fostering strategic partnerships to enhance market penetration, and investing in research and development to maintain a competitive edge. The market's future trajectory is bright, with a strong emphasis on innovation and collaboration to meet the evolving challenges and opportunities within the global maritime sector.
Maritime Analytics Industry Segmentation
-
1. Application
- 1.1. Predictive and Prescriptive Maintenance
- 1.2. Voyage Operations
- 1.3. Fleet Management
- 1.4. Other Applications
-
2. End-User
- 2.1. Government
- 2.2. Commercial
Maritime Analytics Industry Segmentation By Geography
- 1. North America
- 2. Europe
- 3. Asia Pacific
- 4. Rest of the World

Maritime Analytics Industry REPORT HIGHLIGHTS
| Aspects | Details |
|---|---|
| Study Period | 2019-2033 |
| Base Year | 2024 |
| Estimated Year | 2025 |
| Forecast Period | 2025-2033 |
| Historical Period | 2019-2024 |
| Growth Rate | CAGR of 10.01% from 2019-2033 |
| Segmentation |
|
Table of Contents
- 1. Introduction
- 1.1. Research Scope
- 1.2. Market Segmentation
- 1.3. Research Methodology
- 1.4. Definitions and Assumptions
- 2. Executive Summary
- 2.1. Introduction
- 3. Market Dynamics
- 3.1. Introduction
- 3.2. Market Drivers
- 3.2.1. Increasing Penetration of Digitization in the Maritime Industry; Increase in Seaborne Trade
- 3.3. Market Restrains
- 3.3.1. High Installation Cost; Lack of Uninterrupted and Seamless Internet Connectivity
- 3.4. Market Trends
- 3.4.1. Government Segment is Expected to Drive the Market
- 4. Market Factor Analysis
- 4.1. Porters Five Forces
- 4.2. Supply/Value Chain
- 4.3. PESTEL analysis
- 4.4. Market Entropy
- 4.5. Patent/Trademark Analysis
- 5. Global Maritime Analytics Industry Analysis, Insights and Forecast, 2019-2031
- 5.1. Market Analysis, Insights and Forecast - by Application
- 5.1.1. Predictive and Prescriptive Maintenance
- 5.1.2. Voyage Operations
- 5.1.3. Fleet Management
- 5.1.4. Other Applications
- 5.2. Market Analysis, Insights and Forecast - by End-User
- 5.2.1. Government
- 5.2.2. Commercial
- 5.3. Market Analysis, Insights and Forecast - by Region
- 5.3.1. North America
- 5.3.2. Europe
- 5.3.3. Asia Pacific
- 5.3.4. Rest of the World
- 5.1. Market Analysis, Insights and Forecast - by Application
- 6. North America Maritime Analytics Industry Analysis, Insights and Forecast, 2019-2031
- 6.1. Market Analysis, Insights and Forecast - by Application
- 6.1.1. Predictive and Prescriptive Maintenance
- 6.1.2. Voyage Operations
- 6.1.3. Fleet Management
- 6.1.4. Other Applications
- 6.2. Market Analysis, Insights and Forecast - by End-User
- 6.2.1. Government
- 6.2.2. Commercial
- 6.1. Market Analysis, Insights and Forecast - by Application
- 7. Europe Maritime Analytics Industry Analysis, Insights and Forecast, 2019-2031
- 7.1. Market Analysis, Insights and Forecast - by Application
- 7.1.1. Predictive and Prescriptive Maintenance
- 7.1.2. Voyage Operations
- 7.1.3. Fleet Management
- 7.1.4. Other Applications
- 7.2. Market Analysis, Insights and Forecast - by End-User
- 7.2.1. Government
- 7.2.2. Commercial
- 7.1. Market Analysis, Insights and Forecast - by Application
- 8. Asia Pacific Maritime Analytics Industry Analysis, Insights and Forecast, 2019-2031
- 8.1. Market Analysis, Insights and Forecast - by Application
- 8.1.1. Predictive and Prescriptive Maintenance
- 8.1.2. Voyage Operations
- 8.1.3. Fleet Management
- 8.1.4. Other Applications
- 8.2. Market Analysis, Insights and Forecast - by End-User
- 8.2.1. Government
- 8.2.2. Commercial
- 8.1. Market Analysis, Insights and Forecast - by Application
- 9. Rest of the World Maritime Analytics Industry Analysis, Insights and Forecast, 2019-2031
- 9.1. Market Analysis, Insights and Forecast - by Application
- 9.1.1. Predictive and Prescriptive Maintenance
- 9.1.2. Voyage Operations
- 9.1.3. Fleet Management
- 9.1.4. Other Applications
- 9.2. Market Analysis, Insights and Forecast - by End-User
- 9.2.1. Government
- 9.2.2. Commercial
- 9.1. Market Analysis, Insights and Forecast - by Application
- 10. North America Maritime Analytics Industry Analysis, Insights and Forecast, 2019-2031
- 10.1. Market Analysis, Insights and Forecast - By Country/Sub-region
- 10.1.1.
- 11. Europe Maritime Analytics Industry Analysis, Insights and Forecast, 2019-2031
- 11.1. Market Analysis, Insights and Forecast - By Country/Sub-region
- 11.1.1.
- 12. Asia Pacific Maritime Analytics Industry Analysis, Insights and Forecast, 2019-2031
- 12.1. Market Analysis, Insights and Forecast - By Country/Sub-region
- 12.1.1.
- 13. Rest of the World Maritime Analytics Industry Analysis, Insights and Forecast, 2019-2031
- 13.1. Market Analysis, Insights and Forecast - By Country/Sub-region
- 13.1.1.
- 14. Competitive Analysis
- 14.1. Global Market Share Analysis 2024
- 14.2. Company Profiles
- 14.2.1 Windward Limited
- 14.2.1.1. Overview
- 14.2.1.2. Products
- 14.2.1.3. SWOT Analysis
- 14.2.1.4. Recent Developments
- 14.2.1.5. Financials (Based on Availability)
- 14.2.2 Inmarsat GHL (Connect Bidco Limited)*List Not Exhaustive
- 14.2.2.1. Overview
- 14.2.2.2. Products
- 14.2.2.3. SWOT Analysis
- 14.2.2.4. Recent Developments
- 14.2.2.5. Financials (Based on Availability)
- 14.2.3 Spark Cognition Inc
- 14.2.3.1. Overview
- 14.2.3.2. Products
- 14.2.3.3. SWOT Analysis
- 14.2.3.4. Recent Developments
- 14.2.3.5. Financials (Based on Availability)
- 14.2.4 ProGen Business Solutions Private Limited
- 14.2.4.1. Overview
- 14.2.4.2. Products
- 14.2.4.3. SWOT Analysis
- 14.2.4.4. Recent Developments
- 14.2.4.5. Financials (Based on Availability)
- 14.2.5 Wartsila Oyj Abp
- 14.2.5.1. Overview
- 14.2.5.2. Products
- 14.2.5.3. SWOT Analysis
- 14.2.5.4. Recent Developments
- 14.2.5.5. Financials (Based on Availability)
- 14.2.6 Amplify Mindware Private Limited
- 14.2.6.1. Overview
- 14.2.6.2. Products
- 14.2.6.3. SWOT Analysis
- 14.2.6.4. Recent Developments
- 14.2.6.5. Financials (Based on Availability)
- 14.2.7 ABB Limited
- 14.2.7.1. Overview
- 14.2.7.2. Products
- 14.2.7.3. SWOT Analysis
- 14.2.7.4. Recent Developments
- 14.2.7.5. Financials (Based on Availability)
- 14.2.8 Prisma Electronics SA (Laros)
- 14.2.8.1. Overview
- 14.2.8.2. Products
- 14.2.8.3. SWOT Analysis
- 14.2.8.4. Recent Developments
- 14.2.8.5. Financials (Based on Availability)
- 14.2.9 U-Ming Marine Transport Corporation
- 14.2.9.1. Overview
- 14.2.9.2. Products
- 14.2.9.3. SWOT Analysis
- 14.2.9.4. Recent Developments
- 14.2.9.5. Financials (Based on Availability)
- 14.2.10 Spire Global Inc
- 14.2.10.1. Overview
- 14.2.10.2. Products
- 14.2.10.3. SWOT Analysis
- 14.2.10.4. Recent Developments
- 14.2.10.5. Financials (Based on Availability)
- 14.2.1 Windward Limited
List of Figures
- Figure 1: Global Maritime Analytics Industry Revenue Breakdown (Million, %) by Region 2024 & 2032
- Figure 2: North America Maritime Analytics Industry Revenue (Million), by Country 2024 & 2032
- Figure 3: North America Maritime Analytics Industry Revenue Share (%), by Country 2024 & 2032
- Figure 4: Europe Maritime Analytics Industry Revenue (Million), by Country 2024 & 2032
- Figure 5: Europe Maritime Analytics Industry Revenue Share (%), by Country 2024 & 2032
- Figure 6: Asia Pacific Maritime Analytics Industry Revenue (Million), by Country 2024 & 2032
- Figure 7: Asia Pacific Maritime Analytics Industry Revenue Share (%), by Country 2024 & 2032
- Figure 8: Rest of the World Maritime Analytics Industry Revenue (Million), by Country 2024 & 2032
- Figure 9: Rest of the World Maritime Analytics Industry Revenue Share (%), by Country 2024 & 2032
- Figure 10: North America Maritime Analytics Industry Revenue (Million), by Application 2024 & 2032
- Figure 11: North America Maritime Analytics Industry Revenue Share (%), by Application 2024 & 2032
- Figure 12: North America Maritime Analytics Industry Revenue (Million), by End-User 2024 & 2032
- Figure 13: North America Maritime Analytics Industry Revenue Share (%), by End-User 2024 & 2032
- Figure 14: North America Maritime Analytics Industry Revenue (Million), by Country 2024 & 2032
- Figure 15: North America Maritime Analytics Industry Revenue Share (%), by Country 2024 & 2032
- Figure 16: Europe Maritime Analytics Industry Revenue (Million), by Application 2024 & 2032
- Figure 17: Europe Maritime Analytics Industry Revenue Share (%), by Application 2024 & 2032
- Figure 18: Europe Maritime Analytics Industry Revenue (Million), by End-User 2024 & 2032
- Figure 19: Europe Maritime Analytics Industry Revenue Share (%), by End-User 2024 & 2032
- Figure 20: Europe Maritime Analytics Industry Revenue (Million), by Country 2024 & 2032
- Figure 21: Europe Maritime Analytics Industry Revenue Share (%), by Country 2024 & 2032
- Figure 22: Asia Pacific Maritime Analytics Industry Revenue (Million), by Application 2024 & 2032
- Figure 23: Asia Pacific Maritime Analytics Industry Revenue Share (%), by Application 2024 & 2032
- Figure 24: Asia Pacific Maritime Analytics Industry Revenue (Million), by End-User 2024 & 2032
- Figure 25: Asia Pacific Maritime Analytics Industry Revenue Share (%), by End-User 2024 & 2032
- Figure 26: Asia Pacific Maritime Analytics Industry Revenue (Million), by Country 2024 & 2032
- Figure 27: Asia Pacific Maritime Analytics Industry Revenue Share (%), by Country 2024 & 2032
- Figure 28: Rest of the World Maritime Analytics Industry Revenue (Million), by Application 2024 & 2032
- Figure 29: Rest of the World Maritime Analytics Industry Revenue Share (%), by Application 2024 & 2032
- Figure 30: Rest of the World Maritime Analytics Industry Revenue (Million), by End-User 2024 & 2032
- Figure 31: Rest of the World Maritime Analytics Industry Revenue Share (%), by End-User 2024 & 2032
- Figure 32: Rest of the World Maritime Analytics Industry Revenue (Million), by Country 2024 & 2032
- Figure 33: Rest of the World Maritime Analytics Industry Revenue Share (%), by Country 2024 & 2032
List of Tables
- Table 1: Global Maritime Analytics Industry Revenue Million Forecast, by Region 2019 & 2032
- Table 2: Global Maritime Analytics Industry Revenue Million Forecast, by Application 2019 & 2032
- Table 3: Global Maritime Analytics Industry Revenue Million Forecast, by End-User 2019 & 2032
- Table 4: Global Maritime Analytics Industry Revenue Million Forecast, by Region 2019 & 2032
- Table 5: Global Maritime Analytics Industry Revenue Million Forecast, by Country 2019 & 2032
- Table 6: Maritime Analytics Industry Revenue (Million) Forecast, by Application 2019 & 2032
- Table 7: Global Maritime Analytics Industry Revenue Million Forecast, by Country 2019 & 2032
- Table 8: Maritime Analytics Industry Revenue (Million) Forecast, by Application 2019 & 2032
- Table 9: Global Maritime Analytics Industry Revenue Million Forecast, by Country 2019 & 2032
- Table 10: Maritime Analytics Industry Revenue (Million) Forecast, by Application 2019 & 2032
- Table 11: Global Maritime Analytics Industry Revenue Million Forecast, by Country 2019 & 2032
- Table 12: Maritime Analytics Industry Revenue (Million) Forecast, by Application 2019 & 2032
- Table 13: Global Maritime Analytics Industry Revenue Million Forecast, by Application 2019 & 2032
- Table 14: Global Maritime Analytics Industry Revenue Million Forecast, by End-User 2019 & 2032
- Table 15: Global Maritime Analytics Industry Revenue Million Forecast, by Country 2019 & 2032
- Table 16: Global Maritime Analytics Industry Revenue Million Forecast, by Application 2019 & 2032
- Table 17: Global Maritime Analytics Industry Revenue Million Forecast, by End-User 2019 & 2032
- Table 18: Global Maritime Analytics Industry Revenue Million Forecast, by Country 2019 & 2032
- Table 19: Global Maritime Analytics Industry Revenue Million Forecast, by Application 2019 & 2032
- Table 20: Global Maritime Analytics Industry Revenue Million Forecast, by End-User 2019 & 2032
- Table 21: Global Maritime Analytics Industry Revenue Million Forecast, by Country 2019 & 2032
- Table 22: Global Maritime Analytics Industry Revenue Million Forecast, by Application 2019 & 2032
- Table 23: Global Maritime Analytics Industry Revenue Million Forecast, by End-User 2019 & 2032
- Table 24: Global Maritime Analytics Industry Revenue Million Forecast, by Country 2019 & 2032
Frequently Asked Questions
1. What is the projected Compound Annual Growth Rate (CAGR) of the Maritime Analytics Industry?
The projected CAGR is approximately 10.01%.
2. Which companies are prominent players in the Maritime Analytics Industry?
Key companies in the market include Windward Limited, Inmarsat GHL (Connect Bidco Limited)*List Not Exhaustive, Spark Cognition Inc, ProGen Business Solutions Private Limited, Wartsila Oyj Abp, Amplify Mindware Private Limited, ABB Limited, Prisma Electronics SA (Laros), U-Ming Marine Transport Corporation, Spire Global Inc.
3. What are the main segments of the Maritime Analytics Industry?
The market segments include Application, End-User.
4. Can you provide details about the market size?
The market size is estimated to be USD 1.34 Million as of 2022.
5. What are some drivers contributing to market growth?
Increasing Penetration of Digitization in the Maritime Industry; Increase in Seaborne Trade.
6. What are the notable trends driving market growth?
Government Segment is Expected to Drive the Market.
7. Are there any restraints impacting market growth?
High Installation Cost; Lack of Uninterrupted and Seamless Internet Connectivity.
8. Can you provide examples of recent developments in the market?
May 2022 - Wartsila had developed and received orders for 70 vessels, and this number is still rising. The company currently holds a market share of over 20% and has installed batteries with a combined capacity that exceeds 100 MWh. Hybrid vessels are more sophisticated than diesel-mechanical or fully electric vessels since their propulsion systems often mix engines and batteries.
9. What pricing options are available for accessing the report?
Pricing options include single-user, multi-user, and enterprise licenses priced at USD 4750, USD 5250, and USD 8750 respectively.
10. Is the market size provided in terms of value or volume?
The market size is provided in terms of value, measured in Million.
11. Are there any specific market keywords associated with the report?
Yes, the market keyword associated with the report is "Maritime Analytics Industry," which aids in identifying and referencing the specific market segment covered.
12. How do I determine which pricing option suits my needs best?
The pricing options vary based on user requirements and access needs. Individual users may opt for single-user licenses, while businesses requiring broader access may choose multi-user or enterprise licenses for cost-effective access to the report.
13. Are there any additional resources or data provided in the Maritime Analytics Industry report?
While the report offers comprehensive insights, it's advisable to review the specific contents or supplementary materials provided to ascertain if additional resources or data are available.
14. How can I stay updated on further developments or reports in the Maritime Analytics Industry?
To stay informed about further developments, trends, and reports in the Maritime Analytics Industry, consider subscribing to industry newsletters, following relevant companies and organizations, or regularly checking reputable industry news sources and publications.
Methodology
Step 1 - Identification of Relevant Samples Size from Population Database


Step 2 - Approaches for Defining Global Market Size (Value, Volume* & Price*)

Note*: In applicable scenarios
Step 3 - Data Sources
Primary Research
- Web Analytics
- Survey Reports
- Research Institute
- Latest Research Reports
- Opinion Leaders
Secondary Research
- Annual Reports
- White Paper
- Latest Press Release
- Industry Association
- Paid Database
- Investor Presentations

Step 4 - Data Triangulation
Involves using different sources of information in order to increase the validity of a study
These sources are likely to be stakeholders in a program - participants, other researchers, program staff, other community members, and so on.
Then we put all data in single framework & apply various statistical tools to find out the dynamic on the market.
During the analysis stage, feedback from the stakeholder groups would be compared to determine areas of agreement as well as areas of divergence
