

Key Insights
The marine LiDAR sensor market is poised for substantial expansion, propelled by an escalating demand for precise bathymetric data across diverse sectors. Key growth drivers include the imperative for accurate seabed mapping for offshore renewable energy projects (wind and wave power), comprehensive coastal zone management, and critical underwater infrastructure inspections. Technological advancements, featuring miniaturized, highly efficient LiDAR sensors with enhanced accuracy and range, are also significantly contributing to market growth. The synergistic integration of LiDAR with artificial intelligence and machine learning for advanced data processing and analysis further amplifies its utility and market appeal. Despite potential restraints like high initial investment and data processing complexities, the market outlook remains exceptionally positive.
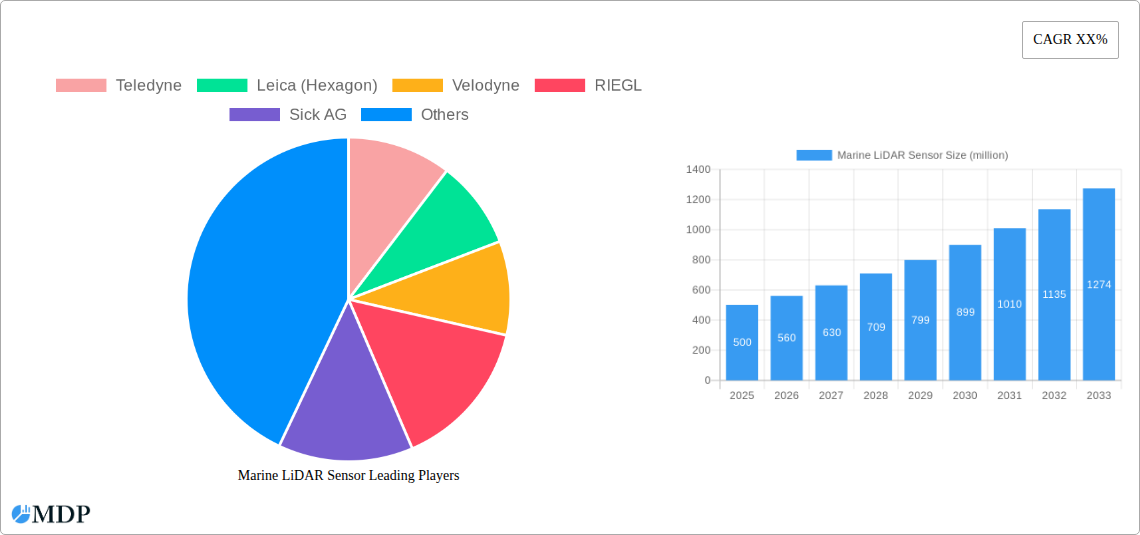
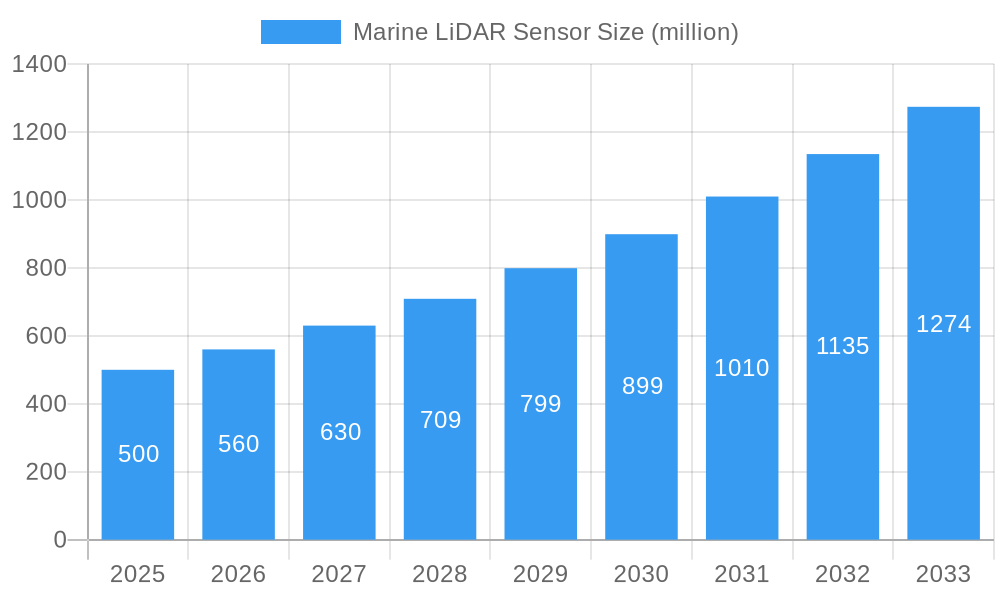
Marine LiDAR Sensor Market Size (In Million)
Competition within the marine LiDAR sensor market is intense, with leading companies such as Teledyne, Leica (Hexagon), Velodyne, RIEGL, Sick AG, Topcon Positioning Systems, and Trimble Inc. shaping the industry. Continuous innovation from these established players, alongside the emergence of new entrants and ongoing technological breakthroughs, will further intensify competition and foster market innovation. Geographically, the market is expected to see significant activity in regions with robust maritime operations and substantial investments in offshore infrastructure, with North America and Europe leading, followed by robust growth in the Asia-Pacific. This comprehensive market analysis covers the period from 2019 to 2033, providing critical insights into historical trends and future projections. The projected Compound Annual Growth Rate (CAGR) is estimated at 16.1%, with the market size expected to reach $465.29 million by the base year 2025.
Marine LiDAR Sensor Company Market Share
Marine LiDAR Sensor Market Report: 2019-2033
This comprehensive report provides an in-depth analysis of the global Marine LiDAR Sensor market, projecting a market value exceeding $XX million by 2033. The study covers market dynamics, leading players, technological advancements, and future growth opportunities, offering invaluable insights for industry stakeholders, investors, and researchers. The report analyzes the historical period (2019-2024), base year (2025), and forecasts the market from 2025 to 2033.
Marine LiDAR Sensor Market Dynamics & Concentration
The global marine LiDAR sensor market is experiencing significant growth, driven by increasing demand for high-precision bathymetric surveys, coastal zone management, and offshore renewable energy development. Market concentration is moderate, with several key players holding significant shares. However, the market is also witnessing the emergence of smaller, specialized companies offering niche solutions. Innovation is a crucial driver, with continuous advancements in sensor technology, data processing, and integration capabilities leading to improved accuracy and efficiency. Regulatory frameworks, particularly concerning data privacy and environmental regulations, play a vital role. Product substitutes, such as sonar systems, exist but offer less detailed data. End-user trends show a preference for integrated systems that combine LiDAR with other sensors for comprehensive data acquisition. The market has seen a moderate number of M&A activities (xx deals in the last five years), reflecting consolidation efforts and strategic expansion.
- Market Share: Teledyne, Leica (Hexagon), and Velodyne collectively hold an estimated xx% market share in 2025.
- M&A Activity: The historical period saw xx mergers and acquisitions, primarily focused on technological integration and market expansion.
- Innovation Drivers: Miniaturization, improved accuracy, real-time processing capabilities, and enhanced data visualization are key driving forces.
Marine LiDAR Sensor Industry Trends & Analysis
The marine LiDAR sensor market is projected to witness a Compound Annual Growth Rate (CAGR) of xx% during the forecast period (2025-2033). Several factors contribute to this growth, including the expanding offshore wind energy sector, increasing investment in coastal infrastructure projects, and the rising demand for precise hydrographic surveys for maritime safety. Technological disruptions, like the development of solid-state LiDAR, are enhancing the market's efficiency and cost-effectiveness. Consumer preferences lean towards higher accuracy, improved data processing speed, and seamless integration with other surveying equipment. Competitive dynamics are characterized by both technological innovation and strategic partnerships. Market penetration of LiDAR sensors in niche applications, such as underwater archaeology and marine biology research, is also increasing steadily.
Leading Markets & Segments in Marine LiDAR Sensor
The North American region dominates the marine LiDAR sensor market, driven primarily by significant investments in coastal infrastructure projects and the expansion of offshore wind farms. Within North America, the US holds the largest market share due to robust government support and a well-developed hydrographic surveying industry.
- Key Drivers in North America:
- High Government investment in coastal infrastructure.
- Rapid growth of offshore wind energy.
- Stringent environmental regulations driving demand for precise surveys.
- Dominance Analysis: The high concentration of key players and substantial investment in R&D within the region have resulted in North America's leading position.
Marine LiDAR Sensor Product Developments
Recent product developments focus on enhancing accuracy, reducing size and weight, and improving data processing speeds. The introduction of solid-state LiDAR technology offers significant advantages in terms of reliability, cost-effectiveness, and maintenance. Applications are expanding beyond traditional bathymetric surveying to encompass areas like autonomous navigation, underwater mapping, and environmental monitoring. The competitive advantage lies in delivering integrated solutions that provide efficient and accurate data acquisition and processing, catering to specific customer needs.
Key Drivers of Marine LiDAR Sensor Growth
Technological advancements, particularly in solid-state LiDAR, are significantly boosting market growth. Increased government funding for infrastructure projects, particularly in coastal areas and offshore wind energy, fuels demand. Favorable regulatory policies supporting the adoption of advanced surveying technologies further contribute to market expansion. Finally, the growing need for accurate data for marine resource management and environmental monitoring is a key driver.
Challenges in the Marine LiDAR Sensor Market
The high initial investment cost of LiDAR systems can be a barrier to entry for smaller companies. Supply chain disruptions, especially regarding specialized components, can impact market supply and pricing. Intense competition from established players and emerging companies puts pressure on profit margins. Finally, evolving regulatory landscapes and environmental compliance requirements pose challenges for manufacturers and end-users.
Emerging Opportunities in Marine LiDAR Sensor
The integration of AI and machine learning in data processing promises to significantly improve efficiency and accuracy. Strategic partnerships between sensor manufacturers and data processing companies create synergistic opportunities. Market expansion into developing economies, particularly in Asia and South America, presents significant growth potential. The increasing demand for precise underwater mapping for various purposes will drive innovation and expansion.
Leading Players in the Marine LiDAR Sensor Sector
- Teledyne
- Leica (Hexagon)
- Velodyne
- RIEGL
- Sick AG
- Topcon Positioning Systems, Inc.
- Trimble Inc. (Geospatial)
- Zhejiang University
Key Milestones in Marine LiDAR Sensor Industry
- 2020: Introduction of the first commercially available solid-state marine LiDAR sensor by [Company Name].
- 2022: Strategic partnership between [Company A] and [Company B] for integrated data processing solutions.
- 2023: New regulatory framework implemented in [Region] impacting the adoption of LiDAR technology. (Further milestones to be added based on specific data)
Strategic Outlook for Marine LiDAR Sensor Market
The marine LiDAR sensor market is poised for continued strong growth, driven by technological advancements and increasing demand across various sectors. Strategic opportunities exist in developing innovative solutions for specific applications, expanding into new geographical markets, and fostering collaborative partnerships. Focusing on cost-effective and user-friendly systems will be key to capturing market share. The long-term market potential is significant, indicating a prosperous outlook for both established players and emerging companies in this dynamic sector.
Marine LiDAR Sensor Segmentation
-
1. Application
- 1.1. Military
- 1.2. Commercial
- 1.3. Industrial
- 1.4. Other
-
2. Types
- 2.1. Bathymetric LiDAR
- 2.2. Topographic LiDAR
Marine LiDAR Sensor Segmentation By Geography
-
1. North America
- 1.1. United States
- 1.2. Canada
- 1.3. Mexico
-
2. South America
- 2.1. Brazil
- 2.2. Argentina
- 2.3. Rest of South America
-
3. Europe
- 3.1. United Kingdom
- 3.2. Germany
- 3.3. France
- 3.4. Italy
- 3.5. Spain
- 3.6. Russia
- 3.7. Benelux
- 3.8. Nordics
- 3.9. Rest of Europe
-
4. Middle East & Africa
- 4.1. Turkey
- 4.2. Israel
- 4.3. GCC
- 4.4. North Africa
- 4.5. South Africa
- 4.6. Rest of Middle East & Africa
-
5. Asia Pacific
- 5.1. China
- 5.2. India
- 5.3. Japan
- 5.4. South Korea
- 5.5. ASEAN
- 5.6. Oceania
- 5.7. Rest of Asia Pacific

Marine LiDAR Sensor Regional Market Share
Geographic Coverage of Marine LiDAR Sensor
Marine LiDAR Sensor REPORT HIGHLIGHTS
| Aspects | Details |
|---|---|
| Study Period | 2020-2034 |
| Base Year | 2025 |
| Estimated Year | 2026 |
| Forecast Period | 2026-2034 |
| Historical Period | 2020-2025 |
| Growth Rate | CAGR of 16.1% from 2020-2034 |
| Segmentation |
|
Table of Contents
- 1. Introduction
- 1.1. Research Scope
- 1.2. Market Segmentation
- 1.3. Research Objective
- 1.4. Definitions and Assumptions
- 2. Executive Summary
- 2.1. Market Snapshot
- 3. Market Dynamics
- 3.1. Market Drivers
- 3.2. Market Restrains
- 3.3. Market Trends
- 3.4. Market Opportunities
- 4. Market Factor Analysis
- 4.1. Porters Five Forces
- 4.1.1. Bargaining Power of Suppliers
- 4.1.2. Bargaining Power of Buyers
- 4.1.3. Threat of New Entrants
- 4.1.4. Threat of Substitutes
- 4.1.5. Competitive Rivalry
- 4.2. PESTEL analysis
- 4.3. BCG Analysis
- 4.3.1. Stars (High Growth, High Market Share)
- 4.3.2. Cash Cows (Low Growth, High Market Share)
- 4.3.3. Question Mark (High Growth, Low Market Share)
- 4.3.4. Dogs (Low Growth, Low Market Share)
- 4.4. Ansoff Matrix Analysis
- 4.5. Supply Chain Analysis
- 4.6. Regulatory Landscape
- 4.7. Current Market Potential and Opportunity Assessment (TAM–SAM–SOM Framework)
- 4.8. MDP Analyst Note
- 4.1. Porters Five Forces
- 5. Market Analysis, Insights and Forecast 2021-2033
- 5.1. Market Analysis, Insights and Forecast - by Application
- 5.1.1. Military
- 5.1.2. Commercial
- 5.1.3. Industrial
- 5.1.4. Other
- 5.2. Market Analysis, Insights and Forecast - by Types
- 5.2.1. Bathymetric LiDAR
- 5.2.2. Topographic LiDAR
- 5.3. Market Analysis, Insights and Forecast - by Region
- 5.3.1. North America
- 5.3.2. South America
- 5.3.3. Europe
- 5.3.4. Middle East & Africa
- 5.3.5. Asia Pacific
- 5.1. Market Analysis, Insights and Forecast - by Application
- 6. Global Marine LiDAR Sensor Analysis, Insights and Forecast, 2021-2033
- 6.1. Market Analysis, Insights and Forecast - by Application
- 6.1.1. Military
- 6.1.2. Commercial
- 6.1.3. Industrial
- 6.1.4. Other
- 6.2. Market Analysis, Insights and Forecast - by Types
- 6.2.1. Bathymetric LiDAR
- 6.2.2. Topographic LiDAR
- 6.1. Market Analysis, Insights and Forecast - by Application
- 7. North America Marine LiDAR Sensor Analysis, Insights and Forecast, 2020-2032
- 7.1. Market Analysis, Insights and Forecast - by Application
- 7.1.1. Military
- 7.1.2. Commercial
- 7.1.3. Industrial
- 7.1.4. Other
- 7.2. Market Analysis, Insights and Forecast - by Types
- 7.2.1. Bathymetric LiDAR
- 7.2.2. Topographic LiDAR
- 7.1. Market Analysis, Insights and Forecast - by Application
- 8. South America Marine LiDAR Sensor Analysis, Insights and Forecast, 2020-2032
- 8.1. Market Analysis, Insights and Forecast - by Application
- 8.1.1. Military
- 8.1.2. Commercial
- 8.1.3. Industrial
- 8.1.4. Other
- 8.2. Market Analysis, Insights and Forecast - by Types
- 8.2.1. Bathymetric LiDAR
- 8.2.2. Topographic LiDAR
- 8.1. Market Analysis, Insights and Forecast - by Application
- 9. Europe Marine LiDAR Sensor Analysis, Insights and Forecast, 2020-2032
- 9.1. Market Analysis, Insights and Forecast - by Application
- 9.1.1. Military
- 9.1.2. Commercial
- 9.1.3. Industrial
- 9.1.4. Other
- 9.2. Market Analysis, Insights and Forecast - by Types
- 9.2.1. Bathymetric LiDAR
- 9.2.2. Topographic LiDAR
- 9.1. Market Analysis, Insights and Forecast - by Application
- 10. Middle East & Africa Marine LiDAR Sensor Analysis, Insights and Forecast, 2020-2032
- 10.1. Market Analysis, Insights and Forecast - by Application
- 10.1.1. Military
- 10.1.2. Commercial
- 10.1.3. Industrial
- 10.1.4. Other
- 10.2. Market Analysis, Insights and Forecast - by Types
- 10.2.1. Bathymetric LiDAR
- 10.2.2. Topographic LiDAR
- 10.1. Market Analysis, Insights and Forecast - by Application
- 11. Asia Pacific Marine LiDAR Sensor Analysis, Insights and Forecast, 2020-2032
- 11.1. Market Analysis, Insights and Forecast - by Application
- 11.1.1. Military
- 11.1.2. Commercial
- 11.1.3. Industrial
- 11.1.4. Other
- 11.2. Market Analysis, Insights and Forecast - by Types
- 11.2.1. Bathymetric LiDAR
- 11.2.2. Topographic LiDAR
- 11.1. Market Analysis, Insights and Forecast - by Application
- 12. Competitive Analysis
- 12.1. Company Profiles
- 12.1.1 Teledyne
- 12.1.1.1. Company Overview
- 12.1.1.2. Products
- 12.1.1.3. Company Financials
- 12.1.1.4. SWOT Analysis
- 12.1.2 Leica (Hexagon)
- 12.1.2.1. Company Overview
- 12.1.2.2. Products
- 12.1.2.3. Company Financials
- 12.1.2.4. SWOT Analysis
- 12.1.3 Velodyne
- 12.1.3.1. Company Overview
- 12.1.3.2. Products
- 12.1.3.3. Company Financials
- 12.1.3.4. SWOT Analysis
- 12.1.4 RIEGL
- 12.1.4.1. Company Overview
- 12.1.4.2. Products
- 12.1.4.3. Company Financials
- 12.1.4.4. SWOT Analysis
- 12.1.5 Sick AG
- 12.1.5.1. Company Overview
- 12.1.5.2. Products
- 12.1.5.3. Company Financials
- 12.1.5.4. SWOT Analysis
- 12.1.6 Topcon Positioning Systems
- 12.1.6.1. Company Overview
- 12.1.6.2. Products
- 12.1.6.3. Company Financials
- 12.1.6.4. SWOT Analysis
- 12.1.7 Inc.
- 12.1.7.1. Company Overview
- 12.1.7.2. Products
- 12.1.7.3. Company Financials
- 12.1.7.4. SWOT Analysis
- 12.1.8 Trimble Inc. (Geospatial)
- 12.1.8.1. Company Overview
- 12.1.8.2. Products
- 12.1.8.3. Company Financials
- 12.1.8.4. SWOT Analysis
- 12.1.9 Zhejiang University
- 12.1.9.1. Company Overview
- 12.1.9.2. Products
- 12.1.9.3. Company Financials
- 12.1.9.4. SWOT Analysis
- 12.1.1 Teledyne
- 12.2. Market Entropy
- 12.2.1 Company's Key Areas Served
- 12.2.2 Recent Developments
- 12.3. Company Market Share Analysis 2025
- 12.3.1 Top 5 Companies Market Share Analysis
- 12.3.2 Top 3 Companies Market Share Analysis
- 12.4. List of Potential Customers
- 13. Research Methodology
List of Figures
- Figure 1: Global Marine LiDAR Sensor Revenue Breakdown (million, %) by Region 2025 & 2033
- Figure 2: Global Marine LiDAR Sensor Volume Breakdown (K, %) by Region 2025 & 2033
- Figure 3: North America Marine LiDAR Sensor Revenue (million), by Application 2025 & 2033
- Figure 4: North America Marine LiDAR Sensor Volume (K), by Application 2025 & 2033
- Figure 5: North America Marine LiDAR Sensor Revenue Share (%), by Application 2025 & 2033
- Figure 6: North America Marine LiDAR Sensor Volume Share (%), by Application 2025 & 2033
- Figure 7: North America Marine LiDAR Sensor Revenue (million), by Types 2025 & 2033
- Figure 8: North America Marine LiDAR Sensor Volume (K), by Types 2025 & 2033
- Figure 9: North America Marine LiDAR Sensor Revenue Share (%), by Types 2025 & 2033
- Figure 10: North America Marine LiDAR Sensor Volume Share (%), by Types 2025 & 2033
- Figure 11: North America Marine LiDAR Sensor Revenue (million), by Country 2025 & 2033
- Figure 12: North America Marine LiDAR Sensor Volume (K), by Country 2025 & 2033
- Figure 13: North America Marine LiDAR Sensor Revenue Share (%), by Country 2025 & 2033
- Figure 14: North America Marine LiDAR Sensor Volume Share (%), by Country 2025 & 2033
- Figure 15: South America Marine LiDAR Sensor Revenue (million), by Application 2025 & 2033
- Figure 16: South America Marine LiDAR Sensor Volume (K), by Application 2025 & 2033
- Figure 17: South America Marine LiDAR Sensor Revenue Share (%), by Application 2025 & 2033
- Figure 18: South America Marine LiDAR Sensor Volume Share (%), by Application 2025 & 2033
- Figure 19: South America Marine LiDAR Sensor Revenue (million), by Types 2025 & 2033
- Figure 20: South America Marine LiDAR Sensor Volume (K), by Types 2025 & 2033
- Figure 21: South America Marine LiDAR Sensor Revenue Share (%), by Types 2025 & 2033
- Figure 22: South America Marine LiDAR Sensor Volume Share (%), by Types 2025 & 2033
- Figure 23: South America Marine LiDAR Sensor Revenue (million), by Country 2025 & 2033
- Figure 24: South America Marine LiDAR Sensor Volume (K), by Country 2025 & 2033
- Figure 25: South America Marine LiDAR Sensor Revenue Share (%), by Country 2025 & 2033
- Figure 26: South America Marine LiDAR Sensor Volume Share (%), by Country 2025 & 2033
- Figure 27: Europe Marine LiDAR Sensor Revenue (million), by Application 2025 & 2033
- Figure 28: Europe Marine LiDAR Sensor Volume (K), by Application 2025 & 2033
- Figure 29: Europe Marine LiDAR Sensor Revenue Share (%), by Application 2025 & 2033
- Figure 30: Europe Marine LiDAR Sensor Volume Share (%), by Application 2025 & 2033
- Figure 31: Europe Marine LiDAR Sensor Revenue (million), by Types 2025 & 2033
- Figure 32: Europe Marine LiDAR Sensor Volume (K), by Types 2025 & 2033
- Figure 33: Europe Marine LiDAR Sensor Revenue Share (%), by Types 2025 & 2033
- Figure 34: Europe Marine LiDAR Sensor Volume Share (%), by Types 2025 & 2033
- Figure 35: Europe Marine LiDAR Sensor Revenue (million), by Country 2025 & 2033
- Figure 36: Europe Marine LiDAR Sensor Volume (K), by Country 2025 & 2033
- Figure 37: Europe Marine LiDAR Sensor Revenue Share (%), by Country 2025 & 2033
- Figure 38: Europe Marine LiDAR Sensor Volume Share (%), by Country 2025 & 2033
- Figure 39: Middle East & Africa Marine LiDAR Sensor Revenue (million), by Application 2025 & 2033
- Figure 40: Middle East & Africa Marine LiDAR Sensor Volume (K), by Application 2025 & 2033
- Figure 41: Middle East & Africa Marine LiDAR Sensor Revenue Share (%), by Application 2025 & 2033
- Figure 42: Middle East & Africa Marine LiDAR Sensor Volume Share (%), by Application 2025 & 2033
- Figure 43: Middle East & Africa Marine LiDAR Sensor Revenue (million), by Types 2025 & 2033
- Figure 44: Middle East & Africa Marine LiDAR Sensor Volume (K), by Types 2025 & 2033
- Figure 45: Middle East & Africa Marine LiDAR Sensor Revenue Share (%), by Types 2025 & 2033
- Figure 46: Middle East & Africa Marine LiDAR Sensor Volume Share (%), by Types 2025 & 2033
- Figure 47: Middle East & Africa Marine LiDAR Sensor Revenue (million), by Country 2025 & 2033
- Figure 48: Middle East & Africa Marine LiDAR Sensor Volume (K), by Country 2025 & 2033
- Figure 49: Middle East & Africa Marine LiDAR Sensor Revenue Share (%), by Country 2025 & 2033
- Figure 50: Middle East & Africa Marine LiDAR Sensor Volume Share (%), by Country 2025 & 2033
- Figure 51: Asia Pacific Marine LiDAR Sensor Revenue (million), by Application 2025 & 2033
- Figure 52: Asia Pacific Marine LiDAR Sensor Volume (K), by Application 2025 & 2033
- Figure 53: Asia Pacific Marine LiDAR Sensor Revenue Share (%), by Application 2025 & 2033
- Figure 54: Asia Pacific Marine LiDAR Sensor Volume Share (%), by Application 2025 & 2033
- Figure 55: Asia Pacific Marine LiDAR Sensor Revenue (million), by Types 2025 & 2033
- Figure 56: Asia Pacific Marine LiDAR Sensor Volume (K), by Types 2025 & 2033
- Figure 57: Asia Pacific Marine LiDAR Sensor Revenue Share (%), by Types 2025 & 2033
- Figure 58: Asia Pacific Marine LiDAR Sensor Volume Share (%), by Types 2025 & 2033
- Figure 59: Asia Pacific Marine LiDAR Sensor Revenue (million), by Country 2025 & 2033
- Figure 60: Asia Pacific Marine LiDAR Sensor Volume (K), by Country 2025 & 2033
- Figure 61: Asia Pacific Marine LiDAR Sensor Revenue Share (%), by Country 2025 & 2033
- Figure 62: Asia Pacific Marine LiDAR Sensor Volume Share (%), by Country 2025 & 2033
List of Tables
- Table 1: Global Marine LiDAR Sensor Revenue million Forecast, by Application 2020 & 2033
- Table 2: Global Marine LiDAR Sensor Volume K Forecast, by Application 2020 & 2033
- Table 3: Global Marine LiDAR Sensor Revenue million Forecast, by Types 2020 & 2033
- Table 4: Global Marine LiDAR Sensor Volume K Forecast, by Types 2020 & 2033
- Table 5: Global Marine LiDAR Sensor Revenue million Forecast, by Region 2020 & 2033
- Table 6: Global Marine LiDAR Sensor Volume K Forecast, by Region 2020 & 2033
- Table 7: Global Marine LiDAR Sensor Revenue million Forecast, by Application 2020 & 2033
- Table 8: Global Marine LiDAR Sensor Volume K Forecast, by Application 2020 & 2033
- Table 9: Global Marine LiDAR Sensor Revenue million Forecast, by Types 2020 & 2033
- Table 10: Global Marine LiDAR Sensor Volume K Forecast, by Types 2020 & 2033
- Table 11: Global Marine LiDAR Sensor Revenue million Forecast, by Country 2020 & 2033
- Table 12: Global Marine LiDAR Sensor Volume K Forecast, by Country 2020 & 2033
- Table 13: United States Marine LiDAR Sensor Revenue (million) Forecast, by Application 2020 & 2033
- Table 14: United States Marine LiDAR Sensor Volume (K) Forecast, by Application 2020 & 2033
- Table 15: Canada Marine LiDAR Sensor Revenue (million) Forecast, by Application 2020 & 2033
- Table 16: Canada Marine LiDAR Sensor Volume (K) Forecast, by Application 2020 & 2033
- Table 17: Mexico Marine LiDAR Sensor Revenue (million) Forecast, by Application 2020 & 2033
- Table 18: Mexico Marine LiDAR Sensor Volume (K) Forecast, by Application 2020 & 2033
- Table 19: Global Marine LiDAR Sensor Revenue million Forecast, by Application 2020 & 2033
- Table 20: Global Marine LiDAR Sensor Volume K Forecast, by Application 2020 & 2033
- Table 21: Global Marine LiDAR Sensor Revenue million Forecast, by Types 2020 & 2033
- Table 22: Global Marine LiDAR Sensor Volume K Forecast, by Types 2020 & 2033
- Table 23: Global Marine LiDAR Sensor Revenue million Forecast, by Country 2020 & 2033
- Table 24: Global Marine LiDAR Sensor Volume K Forecast, by Country 2020 & 2033
- Table 25: Brazil Marine LiDAR Sensor Revenue (million) Forecast, by Application 2020 & 2033
- Table 26: Brazil Marine LiDAR Sensor Volume (K) Forecast, by Application 2020 & 2033
- Table 27: Argentina Marine LiDAR Sensor Revenue (million) Forecast, by Application 2020 & 2033
- Table 28: Argentina Marine LiDAR Sensor Volume (K) Forecast, by Application 2020 & 2033
- Table 29: Rest of South America Marine LiDAR Sensor Revenue (million) Forecast, by Application 2020 & 2033
- Table 30: Rest of South America Marine LiDAR Sensor Volume (K) Forecast, by Application 2020 & 2033
- Table 31: Global Marine LiDAR Sensor Revenue million Forecast, by Application 2020 & 2033
- Table 32: Global Marine LiDAR Sensor Volume K Forecast, by Application 2020 & 2033
- Table 33: Global Marine LiDAR Sensor Revenue million Forecast, by Types 2020 & 2033
- Table 34: Global Marine LiDAR Sensor Volume K Forecast, by Types 2020 & 2033
- Table 35: Global Marine LiDAR Sensor Revenue million Forecast, by Country 2020 & 2033
- Table 36: Global Marine LiDAR Sensor Volume K Forecast, by Country 2020 & 2033
- Table 37: United Kingdom Marine LiDAR Sensor Revenue (million) Forecast, by Application 2020 & 2033
- Table 38: United Kingdom Marine LiDAR Sensor Volume (K) Forecast, by Application 2020 & 2033
- Table 39: Germany Marine LiDAR Sensor Revenue (million) Forecast, by Application 2020 & 2033
- Table 40: Germany Marine LiDAR Sensor Volume (K) Forecast, by Application 2020 & 2033
- Table 41: France Marine LiDAR Sensor Revenue (million) Forecast, by Application 2020 & 2033
- Table 42: France Marine LiDAR Sensor Volume (K) Forecast, by Application 2020 & 2033
- Table 43: Italy Marine LiDAR Sensor Revenue (million) Forecast, by Application 2020 & 2033
- Table 44: Italy Marine LiDAR Sensor Volume (K) Forecast, by Application 2020 & 2033
- Table 45: Spain Marine LiDAR Sensor Revenue (million) Forecast, by Application 2020 & 2033
- Table 46: Spain Marine LiDAR Sensor Volume (K) Forecast, by Application 2020 & 2033
- Table 47: Russia Marine LiDAR Sensor Revenue (million) Forecast, by Application 2020 & 2033
- Table 48: Russia Marine LiDAR Sensor Volume (K) Forecast, by Application 2020 & 2033
- Table 49: Benelux Marine LiDAR Sensor Revenue (million) Forecast, by Application 2020 & 2033
- Table 50: Benelux Marine LiDAR Sensor Volume (K) Forecast, by Application 2020 & 2033
- Table 51: Nordics Marine LiDAR Sensor Revenue (million) Forecast, by Application 2020 & 2033
- Table 52: Nordics Marine LiDAR Sensor Volume (K) Forecast, by Application 2020 & 2033
- Table 53: Rest of Europe Marine LiDAR Sensor Revenue (million) Forecast, by Application 2020 & 2033
- Table 54: Rest of Europe Marine LiDAR Sensor Volume (K) Forecast, by Application 2020 & 2033
- Table 55: Global Marine LiDAR Sensor Revenue million Forecast, by Application 2020 & 2033
- Table 56: Global Marine LiDAR Sensor Volume K Forecast, by Application 2020 & 2033
- Table 57: Global Marine LiDAR Sensor Revenue million Forecast, by Types 2020 & 2033
- Table 58: Global Marine LiDAR Sensor Volume K Forecast, by Types 2020 & 2033
- Table 59: Global Marine LiDAR Sensor Revenue million Forecast, by Country 2020 & 2033
- Table 60: Global Marine LiDAR Sensor Volume K Forecast, by Country 2020 & 2033
- Table 61: Turkey Marine LiDAR Sensor Revenue (million) Forecast, by Application 2020 & 2033
- Table 62: Turkey Marine LiDAR Sensor Volume (K) Forecast, by Application 2020 & 2033
- Table 63: Israel Marine LiDAR Sensor Revenue (million) Forecast, by Application 2020 & 2033
- Table 64: Israel Marine LiDAR Sensor Volume (K) Forecast, by Application 2020 & 2033
- Table 65: GCC Marine LiDAR Sensor Revenue (million) Forecast, by Application 2020 & 2033
- Table 66: GCC Marine LiDAR Sensor Volume (K) Forecast, by Application 2020 & 2033
- Table 67: North Africa Marine LiDAR Sensor Revenue (million) Forecast, by Application 2020 & 2033
- Table 68: North Africa Marine LiDAR Sensor Volume (K) Forecast, by Application 2020 & 2033
- Table 69: South Africa Marine LiDAR Sensor Revenue (million) Forecast, by Application 2020 & 2033
- Table 70: South Africa Marine LiDAR Sensor Volume (K) Forecast, by Application 2020 & 2033
- Table 71: Rest of Middle East & Africa Marine LiDAR Sensor Revenue (million) Forecast, by Application 2020 & 2033
- Table 72: Rest of Middle East & Africa Marine LiDAR Sensor Volume (K) Forecast, by Application 2020 & 2033
- Table 73: Global Marine LiDAR Sensor Revenue million Forecast, by Application 2020 & 2033
- Table 74: Global Marine LiDAR Sensor Volume K Forecast, by Application 2020 & 2033
- Table 75: Global Marine LiDAR Sensor Revenue million Forecast, by Types 2020 & 2033
- Table 76: Global Marine LiDAR Sensor Volume K Forecast, by Types 2020 & 2033
- Table 77: Global Marine LiDAR Sensor Revenue million Forecast, by Country 2020 & 2033
- Table 78: Global Marine LiDAR Sensor Volume K Forecast, by Country 2020 & 2033
- Table 79: China Marine LiDAR Sensor Revenue (million) Forecast, by Application 2020 & 2033
- Table 80: China Marine LiDAR Sensor Volume (K) Forecast, by Application 2020 & 2033
- Table 81: India Marine LiDAR Sensor Revenue (million) Forecast, by Application 2020 & 2033
- Table 82: India Marine LiDAR Sensor Volume (K) Forecast, by Application 2020 & 2033
- Table 83: Japan Marine LiDAR Sensor Revenue (million) Forecast, by Application 2020 & 2033
- Table 84: Japan Marine LiDAR Sensor Volume (K) Forecast, by Application 2020 & 2033
- Table 85: South Korea Marine LiDAR Sensor Revenue (million) Forecast, by Application 2020 & 2033
- Table 86: South Korea Marine LiDAR Sensor Volume (K) Forecast, by Application 2020 & 2033
- Table 87: ASEAN Marine LiDAR Sensor Revenue (million) Forecast, by Application 2020 & 2033
- Table 88: ASEAN Marine LiDAR Sensor Volume (K) Forecast, by Application 2020 & 2033
- Table 89: Oceania Marine LiDAR Sensor Revenue (million) Forecast, by Application 2020 & 2033
- Table 90: Oceania Marine LiDAR Sensor Volume (K) Forecast, by Application 2020 & 2033
- Table 91: Rest of Asia Pacific Marine LiDAR Sensor Revenue (million) Forecast, by Application 2020 & 2033
- Table 92: Rest of Asia Pacific Marine LiDAR Sensor Volume (K) Forecast, by Application 2020 & 2033
Frequently Asked Questions
1. What is the projected Compound Annual Growth Rate (CAGR) of the Marine LiDAR Sensor?
The projected CAGR is approximately 16.1%.
2. Which companies are prominent players in the Marine LiDAR Sensor?
Key companies in the market include Teledyne, Leica (Hexagon), Velodyne, RIEGL, Sick AG, Topcon Positioning Systems, Inc., Trimble Inc. (Geospatial), Zhejiang University.
3. What are the main segments of the Marine LiDAR Sensor?
The market segments include Application, Types.
4. Can you provide details about the market size?
The market size is estimated to be USD 465.29 million as of 2022.
5. What are some drivers contributing to market growth?
N/A
6. What are the notable trends driving market growth?
N/A
7. Are there any restraints impacting market growth?
N/A
8. Can you provide examples of recent developments in the market?
N/A
9. What pricing options are available for accessing the report?
Pricing options include single-user, multi-user, and enterprise licenses priced at USD 3350.00, USD 5025.00, and USD 6700.00 respectively.
10. Is the market size provided in terms of value or volume?
The market size is provided in terms of value, measured in million and volume, measured in K.
11. Are there any specific market keywords associated with the report?
Yes, the market keyword associated with the report is "Marine LiDAR Sensor," which aids in identifying and referencing the specific market segment covered.
12. How do I determine which pricing option suits my needs best?
The pricing options vary based on user requirements and access needs. Individual users may opt for single-user licenses, while businesses requiring broader access may choose multi-user or enterprise licenses for cost-effective access to the report.
13. Are there any additional resources or data provided in the Marine LiDAR Sensor report?
While the report offers comprehensive insights, it's advisable to review the specific contents or supplementary materials provided to ascertain if additional resources or data are available.
14. How can I stay updated on further developments or reports in the Marine LiDAR Sensor?
To stay informed about further developments, trends, and reports in the Marine LiDAR Sensor, consider subscribing to industry newsletters, following relevant companies and organizations, or regularly checking reputable industry news sources and publications.
Methodology
Step 1 - Identification of Relevant Samples Size from Population Database


Step 2 - Approaches for Defining Global Market Size (Value, Volume* & Price*)

Note*: In applicable scenarios
Step 3 - Data Sources
Primary Research
- Web Analytics
- Survey Reports
- Research Institute
- Latest Research Reports
- Opinion Leaders
Secondary Research
- Annual Reports
- White Paper
- Latest Press Release
- Industry Association
- Paid Database
- Investor Presentations

Step 4 - Data Triangulation
Involves using different sources of information in order to increase the validity of a study
These sources are likely to be stakeholders in a program - participants, other researchers, program staff, other community members, and so on.
Then we put all data in single framework & apply various statistical tools to find out the dynamic on the market.
During the analysis stage, feedback from the stakeholder groups would be compared to determine areas of agreement as well as areas of divergence