

Key Insights
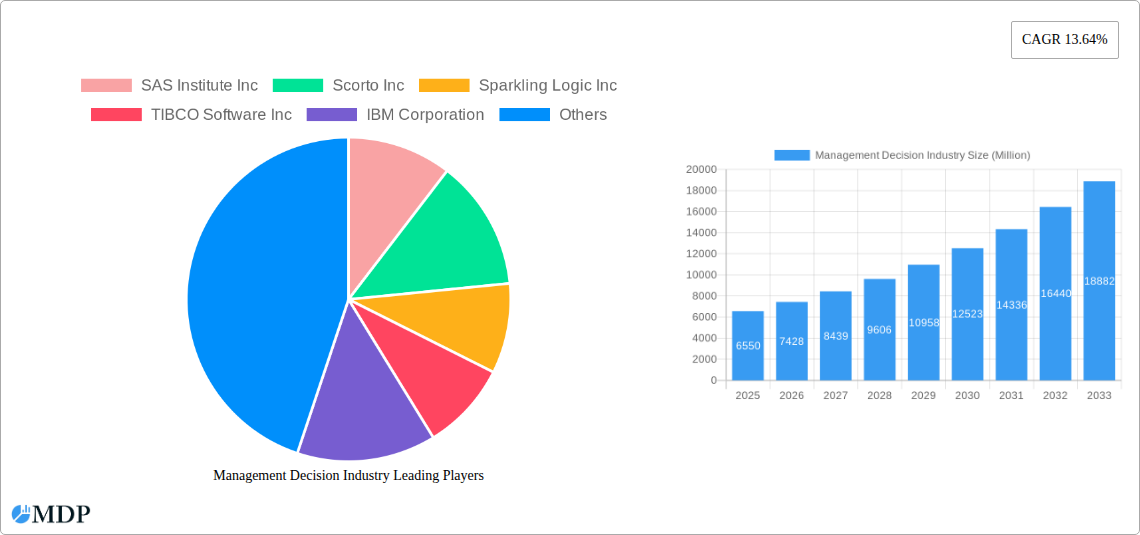
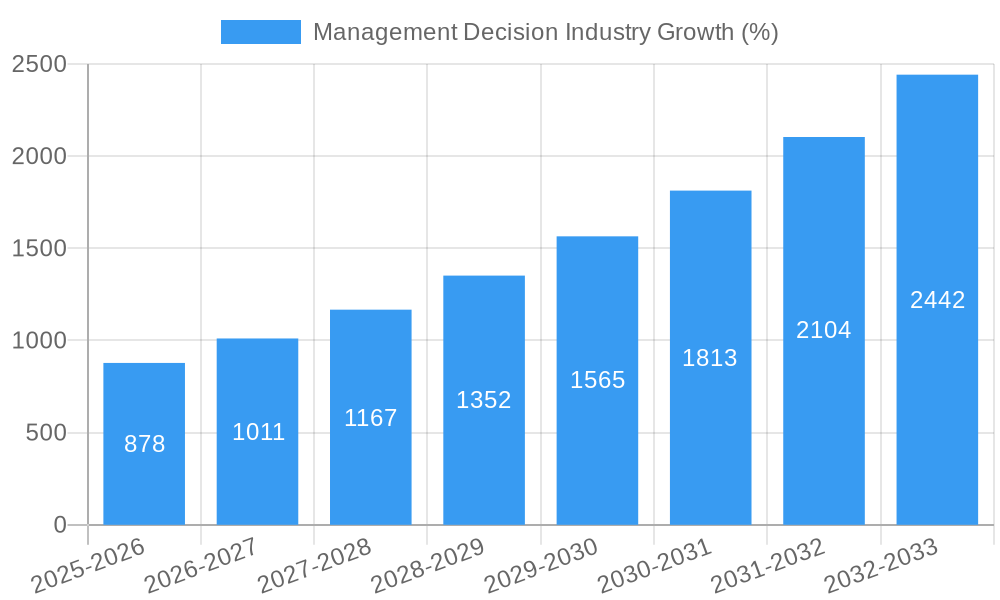
The Management Decision market, currently valued at $6.55 billion (2025), is experiencing robust growth, projected to expand at a Compound Annual Growth Rate (CAGR) of 13.64% from 2025 to 2033. This expansion is fueled by several key drivers. The increasing complexity of business operations necessitates sophisticated decision-making tools for optimized resource allocation and risk management. Furthermore, the rise of big data analytics and advanced technologies like artificial intelligence (AI) and machine learning (ML) are empowering businesses to derive actionable insights from vast datasets, improving decision quality and efficiency. The shift toward cloud-based deployment models offers scalability and cost-effectiveness, further accelerating market adoption. Strong growth is anticipated across various end-user industries, including BFSI (Banking, Financial Services, and Insurance), IT and Telecom, Healthcare, and Retail, driven by the need for improved operational efficiency and customer experience. While data security concerns and the high initial investment costs associated with implementing sophisticated decision management systems pose some restraints, the overall market outlook remains overwhelmingly positive.
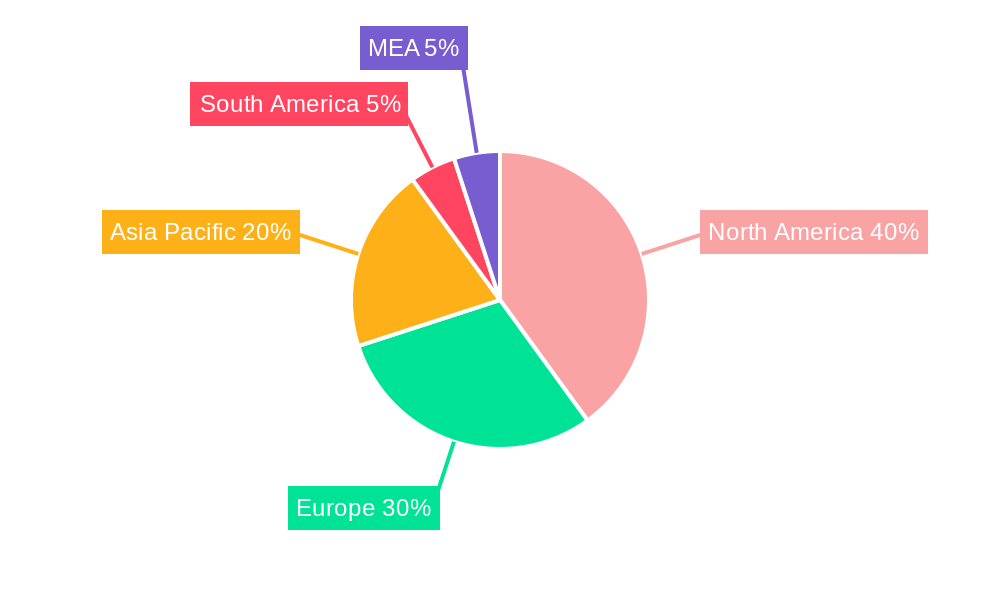
The market segmentation reveals significant opportunities across different components (software and services) and deployment types (on-premises and cloud). The cloud segment is likely to witness faster growth due to its inherent advantages. Geographically, North America currently holds a substantial market share, attributed to the region's advanced technological infrastructure and the early adoption of decision management solutions. However, Asia-Pacific is expected to emerge as a high-growth region, fueled by increasing digitalization and expanding economies. Europe and other regions will also contribute significantly to the overall market expansion. Key players like SAS Institute, IBM, FICO, and Pegasystems are driving innovation and competition, further enhancing the market's dynamism and future growth prospects. The continued integration of AI and ML into decision management systems promises to revolutionize decision-making processes across various industries, driving further market expansion in the years to come.
Management Decision Industry Market Report: 2019-2033 Forecast
Unlocking Growth Opportunities in the Multi-Billion Dollar Management Decision Market
This comprehensive report provides an in-depth analysis of the global Management Decision industry, offering invaluable insights for strategic decision-making. With a study period spanning 2019-2033, a base year of 2025, and a forecast period of 2025-2033, this report is essential for stakeholders seeking to navigate this dynamic market landscape. The report encompasses a detailed examination of market dynamics, leading players, emerging trends, and future growth potential, all backed by robust data analysis and projections. Expected market size exceeds $XX Million by 2033.
Management Decision Industry Market Dynamics & Concentration
The Management Decision industry is experiencing significant growth, driven by increasing demand for data-driven decision-making across diverse sectors. Market concentration is moderate, with several key players holding substantial market share. However, the market is also characterized by a high degree of innovation, with continuous advancements in software, analytics, and AI driving competition. Regulatory frameworks, while varying by region, generally favor the adoption of management decision solutions. Product substitutes are limited, with the core value proposition of enhanced decision-making remaining largely unchallenged. End-user trends highlight a shift towards cloud-based solutions and a growing demand for integrated platforms offering comprehensive analytics and decision support capabilities. Mergers and acquisitions (M&A) activity has been moderate in recent years, with approximately xx M&A deals concluded in the past five years, indicating consolidation and strategic expansion within the sector. Major players are focusing on strategic partnerships to expand their reach and capabilities. Key market share data for 2024 is estimated to be:
- FICO: xx%
- IBM: xx%
- SAS Institute: xx%
- Others: xx%
Management Decision Industry Industry Trends & Analysis
The Management Decision industry is witnessing robust growth, projected to achieve a CAGR of xx% during the forecast period (2025-2033). This growth is fueled by several key factors. The increasing availability of big data and the growing need for real-time insights are driving the adoption of advanced analytics and decision support systems across various industries. Technological disruptions, primarily in artificial intelligence (AI), machine learning (ML), and cloud computing, are further enhancing the capabilities of management decision solutions, leading to improved accuracy, efficiency, and scalability. Consumer preferences are shifting towards user-friendly, intuitive interfaces and integrated platforms that streamline the decision-making process. Competitive dynamics are intense, with players focusing on innovation, strategic partnerships, and acquisitions to gain a competitive edge. Market penetration is expected to increase significantly across various end-user industries, particularly BFSI and healthcare. By 2033, market penetration in the BFSI sector is projected to reach approximately xx%.
Leading Markets & Segments in Management Decision Industry
The North American region currently holds the largest market share in the Management Decision industry, driven by factors such as robust technological infrastructure, high adoption rates of advanced technologies, and a favorable regulatory environment. Within the industry segments, the Software component dominates due to its scalability and flexibility. Cloud deployment is gaining significant traction, fueled by its cost-effectiveness and accessibility. Key drivers within leading segments include:
By Component:
- Software: High demand for advanced analytics and AI-powered decision support tools.
- Services: Growing need for implementation, integration, and support services.
By Deployment Type:
- Cloud: Cost-effectiveness, scalability, and accessibility.
- On-premises: Data security and control concerns for certain industries.
By End-User Industry:
- BFSI: Stringent regulatory compliance and the need for fraud detection and risk management.
- Healthcare: Improved patient care and operational efficiency.
- Retail: Enhanced customer experience and optimized supply chain management.
Detailed dominance analysis reveals that BFSI consistently exhibits high growth and adoption of management decision solutions due to compliance regulations and the inherent need for risk mitigation.
Management Decision Industry Product Developments
Recent product innovations focus on enhanced AI and ML capabilities, integration with other business applications, and improved user interfaces. These advancements aim to provide more accurate, actionable insights and streamline the decision-making process. The market is witnessing a shift towards cloud-native solutions and AI-powered decision automation tools, catering to the increasing demand for scalability and efficiency. The competitive advantage lies in providing robust, user-friendly platforms that offer seamless integration with existing systems and deliver accurate, real-time insights.
Key Drivers of Management Decision Industry Growth
The Management Decision industry's growth is primarily driven by the increasing adoption of data analytics and AI across various sectors. Technological advancements, such as AI and ML, are significantly improving the capabilities of management decision tools. Furthermore, favorable economic conditions and government initiatives promoting digital transformation are accelerating market expansion. For example, the increasing availability of affordable cloud computing resources has made advanced analytical tools more accessible to businesses of all sizes.
Challenges in the Management Decision Industry Market
The Management Decision industry faces challenges such as stringent regulatory compliance requirements that impact cost and deployment time. Data security concerns and the complexity of integrating different data sources pose significant hurdles. The high cost of implementation and the need for skilled professionals also limit adoption, particularly for small and medium-sized enterprises (SMEs). Increased competition among existing players puts pressure on pricing and margins, impacting profitability. The industry also faces talent acquisition and retention challenges due to high demand for skilled professionals in data science and AI.
Emerging Opportunities in Management Decision Industry
Emerging opportunities lie in expanding into untapped markets, particularly in developing economies with burgeoning digital transformation initiatives. The integration of advanced technologies, like IoT and blockchain, offers significant potential for innovation. Strategic partnerships and acquisitions provide avenues for growth and market expansion. The development of specialized solutions for niche industries and the focus on ethical and responsible AI implementation are key elements in driving long-term growth.
Leading Players in the Management Decision Industry Sector
- SAS Institute Inc
- Scorto Inc
- Sparkling Logic Inc
- TIBCO Software Inc
- IBM Corporation
- InRule Technology Inc
- DMC Dubai (Decision Management Consultants)
- FICO (Fair Isaac Corporation)
- Experian Information Solutions Inc
- Pegasystems Inc
- Actico GmbH
- Sapiens International Corporation
- Oracle Corporation
- Equifax Inc
- SAP SE
Key Milestones in Management Decision Industry Industry
- November 2022: IBM introduced Business Analytics Enterprise, enhancing business intelligence capabilities.
- January 2022: LambdaTest launched Test Analytics, improving DevOps decision-making.
- 2022: Frontline Education launched HR Capital Analytics Tool, optimizing educational HR processes.
Strategic Outlook for Management Decision Industry Market
The Management Decision industry is poised for significant growth, driven by the accelerating adoption of AI, ML, and cloud computing. Strategic partnerships and acquisitions will play a crucial role in shaping the market landscape. The focus on user experience, seamless integration, and robust security will be key differentiators. Companies that can adapt quickly to evolving technological trends and effectively address the challenges of data security and regulatory compliance are expected to thrive in this dynamic market. The long-term potential is substantial, with the industry expected to witness continued growth across various sectors and geographic regions.
Management Decision Industry Segmentation
-
1. Component
- 1.1. Software
- 1.2. Services
-
2. Deployment Type
- 2.1. On-premises
- 2.2. Cloud
-
3. End-User Industry
- 3.1. BFSI
- 3.2. IT and Telecom
- 3.3. Healthcare
- 3.4. Retail
- 3.5. Manufacturing
- 3.6. Other End-User Industries
Management Decision Industry Segmentation By Geography
-
1. North America
- 1.1. United States
- 1.2. Canada
- 1.3. Rest of North America
-
2. Europe
- 2.1. Germany
- 2.2. United Kingdom
- 2.3. France
- 2.4. Spain
- 2.5. Rest of Europe
-
3. Asia Pacific
- 3.1. China
- 3.2. Japan
- 3.3. India
- 3.4. Rest of Asia Pacific
-
4. Latin America
- 4.1. Brazil
- 4.2. Argentina
- 4.3. Rest of Latin America
-
5. Middle East and Africa
- 5.1. UAE
- 5.2. Saudi Arabia
- 5.3. South Africa
- 5.4. Rest of Middle East and Africa
Management Decision Industry REPORT HIGHLIGHTS
| Aspects | Details |
|---|---|
| Study Period | 2019-2033 |
| Base Year | 2024 |
| Estimated Year | 2025 |
| Forecast Period | 2025-2033 |
| Historical Period | 2019-2024 |
| Growth Rate | CAGR of 13.64% from 2019-2033 |
| Segmentation |
|
Table of Contents
- 1. Introduction
- 1.1. Research Scope
- 1.2. Market Segmentation
- 1.3. Research Methodology
- 1.4. Definitions and Assumptions
- 2. Executive Summary
- 2.1. Introduction
- 3. Market Dynamics
- 3.1. Introduction
- 3.2. Market Drivers
- 3.2.1. Increasing need for business agility which requires faster and efficient decision making; Increasing demand for Decision Analytics in BFSI sector to drive the market
- 3.3. Market Restrains
- 3.3.1. High monetary cost involved for the implementation
- 3.4. Market Trends
- 3.4.1. BSFI Sector is Expected to Hold Significant Share
- 4. Market Factor Analysis
- 4.1. Porters Five Forces
- 4.2. Supply/Value Chain
- 4.3. PESTEL analysis
- 4.4. Market Entropy
- 4.5. Patent/Trademark Analysis
- 5. Global Management Decision Industry Analysis, Insights and Forecast, 2019-2031
- 5.1. Market Analysis, Insights and Forecast - by Component
- 5.1.1. Software
- 5.1.2. Services
- 5.2. Market Analysis, Insights and Forecast - by Deployment Type
- 5.2.1. On-premises
- 5.2.2. Cloud
- 5.3. Market Analysis, Insights and Forecast - by End-User Industry
- 5.3.1. BFSI
- 5.3.2. IT and Telecom
- 5.3.3. Healthcare
- 5.3.4. Retail
- 5.3.5. Manufacturing
- 5.3.6. Other End-User Industries
- 5.4. Market Analysis, Insights and Forecast - by Region
- 5.4.1. North America
- 5.4.2. Europe
- 5.4.3. Asia Pacific
- 5.4.4. Latin America
- 5.4.5. Middle East and Africa
- 5.1. Market Analysis, Insights and Forecast - by Component
- 6. North America Management Decision Industry Analysis, Insights and Forecast, 2019-2031
- 6.1. Market Analysis, Insights and Forecast - by Component
- 6.1.1. Software
- 6.1.2. Services
- 6.2. Market Analysis, Insights and Forecast - by Deployment Type
- 6.2.1. On-premises
- 6.2.2. Cloud
- 6.3. Market Analysis, Insights and Forecast - by End-User Industry
- 6.3.1. BFSI
- 6.3.2. IT and Telecom
- 6.3.3. Healthcare
- 6.3.4. Retail
- 6.3.5. Manufacturing
- 6.3.6. Other End-User Industries
- 6.1. Market Analysis, Insights and Forecast - by Component
- 7. Europe Management Decision Industry Analysis, Insights and Forecast, 2019-2031
- 7.1. Market Analysis, Insights and Forecast - by Component
- 7.1.1. Software
- 7.1.2. Services
- 7.2. Market Analysis, Insights and Forecast - by Deployment Type
- 7.2.1. On-premises
- 7.2.2. Cloud
- 7.3. Market Analysis, Insights and Forecast - by End-User Industry
- 7.3.1. BFSI
- 7.3.2. IT and Telecom
- 7.3.3. Healthcare
- 7.3.4. Retail
- 7.3.5. Manufacturing
- 7.3.6. Other End-User Industries
- 7.1. Market Analysis, Insights and Forecast - by Component
- 8. Asia Pacific Management Decision Industry Analysis, Insights and Forecast, 2019-2031
- 8.1. Market Analysis, Insights and Forecast - by Component
- 8.1.1. Software
- 8.1.2. Services
- 8.2. Market Analysis, Insights and Forecast - by Deployment Type
- 8.2.1. On-premises
- 8.2.2. Cloud
- 8.3. Market Analysis, Insights and Forecast - by End-User Industry
- 8.3.1. BFSI
- 8.3.2. IT and Telecom
- 8.3.3. Healthcare
- 8.3.4. Retail
- 8.3.5. Manufacturing
- 8.3.6. Other End-User Industries
- 8.1. Market Analysis, Insights and Forecast - by Component
- 9. Latin America Management Decision Industry Analysis, Insights and Forecast, 2019-2031
- 9.1. Market Analysis, Insights and Forecast - by Component
- 9.1.1. Software
- 9.1.2. Services
- 9.2. Market Analysis, Insights and Forecast - by Deployment Type
- 9.2.1. On-premises
- 9.2.2. Cloud
- 9.3. Market Analysis, Insights and Forecast - by End-User Industry
- 9.3.1. BFSI
- 9.3.2. IT and Telecom
- 9.3.3. Healthcare
- 9.3.4. Retail
- 9.3.5. Manufacturing
- 9.3.6. Other End-User Industries
- 9.1. Market Analysis, Insights and Forecast - by Component
- 10. Middle East and Africa Management Decision Industry Analysis, Insights and Forecast, 2019-2031
- 10.1. Market Analysis, Insights and Forecast - by Component
- 10.1.1. Software
- 10.1.2. Services
- 10.2. Market Analysis, Insights and Forecast - by Deployment Type
- 10.2.1. On-premises
- 10.2.2. Cloud
- 10.3. Market Analysis, Insights and Forecast - by End-User Industry
- 10.3.1. BFSI
- 10.3.2. IT and Telecom
- 10.3.3. Healthcare
- 10.3.4. Retail
- 10.3.5. Manufacturing
- 10.3.6. Other End-User Industries
- 10.1. Market Analysis, Insights and Forecast - by Component
- 11. North America Management Decision Industry Analysis, Insights and Forecast, 2019-2031
- 11.1. Market Analysis, Insights and Forecast - By Country/Sub-region
- 11.1.1 United States
- 11.1.2 Canada
- 11.1.3 Mexico
- 12. Europe Management Decision Industry Analysis, Insights and Forecast, 2019-2031
- 12.1. Market Analysis, Insights and Forecast - By Country/Sub-region
- 12.1.1 Germany
- 12.1.2 United Kingdom
- 12.1.3 France
- 12.1.4 Spain
- 12.1.5 Italy
- 12.1.6 Spain
- 12.1.7 Belgium
- 12.1.8 Netherland
- 12.1.9 Nordics
- 12.1.10 Rest of Europe
- 13. Asia Pacific Management Decision Industry Analysis, Insights and Forecast, 2019-2031
- 13.1. Market Analysis, Insights and Forecast - By Country/Sub-region
- 13.1.1 China
- 13.1.2 Japan
- 13.1.3 India
- 13.1.4 South Korea
- 13.1.5 Southeast Asia
- 13.1.6 Australia
- 13.1.7 Indonesia
- 13.1.8 Phillipes
- 13.1.9 Singapore
- 13.1.10 Thailandc
- 13.1.11 Rest of Asia Pacific
- 14. South America Management Decision Industry Analysis, Insights and Forecast, 2019-2031
- 14.1. Market Analysis, Insights and Forecast - By Country/Sub-region
- 14.1.1 Brazil
- 14.1.2 Argentina
- 14.1.3 Peru
- 14.1.4 Chile
- 14.1.5 Colombia
- 14.1.6 Ecuador
- 14.1.7 Venezuela
- 14.1.8 Rest of South America
- 15. North America Management Decision Industry Analysis, Insights and Forecast, 2019-2031
- 15.1. Market Analysis, Insights and Forecast - By Country/Sub-region
- 15.1.1 United States
- 15.1.2 Canada
- 15.1.3 Mexico
- 16. MEA Management Decision Industry Analysis, Insights and Forecast, 2019-2031
- 16.1. Market Analysis, Insights and Forecast - By Country/Sub-region
- 16.1.1 United Arab Emirates
- 16.1.2 Saudi Arabia
- 16.1.3 South Africa
- 16.1.4 Rest of Middle East and Africa
- 17. Competitive Analysis
- 17.1. Global Market Share Analysis 2024
- 17.2. Company Profiles
- 17.2.1 SAS Institute Inc
- 17.2.1.1. Overview
- 17.2.1.2. Products
- 17.2.1.3. SWOT Analysis
- 17.2.1.4. Recent Developments
- 17.2.1.5. Financials (Based on Availability)
- 17.2.2 Scorto Inc
- 17.2.2.1. Overview
- 17.2.2.2. Products
- 17.2.2.3. SWOT Analysis
- 17.2.2.4. Recent Developments
- 17.2.2.5. Financials (Based on Availability)
- 17.2.3 Sparkling Logic Inc
- 17.2.3.1. Overview
- 17.2.3.2. Products
- 17.2.3.3. SWOT Analysis
- 17.2.3.4. Recent Developments
- 17.2.3.5. Financials (Based on Availability)
- 17.2.4 TIBCO Software Inc
- 17.2.4.1. Overview
- 17.2.4.2. Products
- 17.2.4.3. SWOT Analysis
- 17.2.4.4. Recent Developments
- 17.2.4.5. Financials (Based on Availability)
- 17.2.5 IBM Corporation
- 17.2.5.1. Overview
- 17.2.5.2. Products
- 17.2.5.3. SWOT Analysis
- 17.2.5.4. Recent Developments
- 17.2.5.5. Financials (Based on Availability)
- 17.2.6 InRule Technology Inc
- 17.2.6.1. Overview
- 17.2.6.2. Products
- 17.2.6.3. SWOT Analysis
- 17.2.6.4. Recent Developments
- 17.2.6.5. Financials (Based on Availability)
- 17.2.7 DMC Dubai (Decision Management Consultants)*List Not Exhaustive
- 17.2.7.1. Overview
- 17.2.7.2. Products
- 17.2.7.3. SWOT Analysis
- 17.2.7.4. Recent Developments
- 17.2.7.5. Financials (Based on Availability)
- 17.2.8 FICO (Fair Isaac Corporation)
- 17.2.8.1. Overview
- 17.2.8.2. Products
- 17.2.8.3. SWOT Analysis
- 17.2.8.4. Recent Developments
- 17.2.8.5. Financials (Based on Availability)
- 17.2.9 Experian Information Solutions Inc
- 17.2.9.1. Overview
- 17.2.9.2. Products
- 17.2.9.3. SWOT Analysis
- 17.2.9.4. Recent Developments
- 17.2.9.5. Financials (Based on Availability)
- 17.2.10 Pegasystems Inc
- 17.2.10.1. Overview
- 17.2.10.2. Products
- 17.2.10.3. SWOT Analysis
- 17.2.10.4. Recent Developments
- 17.2.10.5. Financials (Based on Availability)
- 17.2.11 Actico GmbH
- 17.2.11.1. Overview
- 17.2.11.2. Products
- 17.2.11.3. SWOT Analysis
- 17.2.11.4. Recent Developments
- 17.2.11.5. Financials (Based on Availability)
- 17.2.12 Sapiens International Corporation
- 17.2.12.1. Overview
- 17.2.12.2. Products
- 17.2.12.3. SWOT Analysis
- 17.2.12.4. Recent Developments
- 17.2.12.5. Financials (Based on Availability)
- 17.2.13 Oracle Corporation
- 17.2.13.1. Overview
- 17.2.13.2. Products
- 17.2.13.3. SWOT Analysis
- 17.2.13.4. Recent Developments
- 17.2.13.5. Financials (Based on Availability)
- 17.2.14 Equifax Inc
- 17.2.14.1. Overview
- 17.2.14.2. Products
- 17.2.14.3. SWOT Analysis
- 17.2.14.4. Recent Developments
- 17.2.14.5. Financials (Based on Availability)
- 17.2.15 SAP SE
- 17.2.15.1. Overview
- 17.2.15.2. Products
- 17.2.15.3. SWOT Analysis
- 17.2.15.4. Recent Developments
- 17.2.15.5. Financials (Based on Availability)
- 17.2.1 SAS Institute Inc
List of Figures
- Figure 1: Global Management Decision Industry Revenue Breakdown (Million, %) by Region 2024 & 2032
- Figure 2: North America Management Decision Industry Revenue (Million), by Country 2024 & 2032
- Figure 3: North America Management Decision Industry Revenue Share (%), by Country 2024 & 2032
- Figure 4: Europe Management Decision Industry Revenue (Million), by Country 2024 & 2032
- Figure 5: Europe Management Decision Industry Revenue Share (%), by Country 2024 & 2032
- Figure 6: Asia Pacific Management Decision Industry Revenue (Million), by Country 2024 & 2032
- Figure 7: Asia Pacific Management Decision Industry Revenue Share (%), by Country 2024 & 2032
- Figure 8: South America Management Decision Industry Revenue (Million), by Country 2024 & 2032
- Figure 9: South America Management Decision Industry Revenue Share (%), by Country 2024 & 2032
- Figure 10: North America Management Decision Industry Revenue (Million), by Country 2024 & 2032
- Figure 11: North America Management Decision Industry Revenue Share (%), by Country 2024 & 2032
- Figure 12: MEA Management Decision Industry Revenue (Million), by Country 2024 & 2032
- Figure 13: MEA Management Decision Industry Revenue Share (%), by Country 2024 & 2032
- Figure 14: North America Management Decision Industry Revenue (Million), by Component 2024 & 2032
- Figure 15: North America Management Decision Industry Revenue Share (%), by Component 2024 & 2032
- Figure 16: North America Management Decision Industry Revenue (Million), by Deployment Type 2024 & 2032
- Figure 17: North America Management Decision Industry Revenue Share (%), by Deployment Type 2024 & 2032
- Figure 18: North America Management Decision Industry Revenue (Million), by End-User Industry 2024 & 2032
- Figure 19: North America Management Decision Industry Revenue Share (%), by End-User Industry 2024 & 2032
- Figure 20: North America Management Decision Industry Revenue (Million), by Country 2024 & 2032
- Figure 21: North America Management Decision Industry Revenue Share (%), by Country 2024 & 2032
- Figure 22: Europe Management Decision Industry Revenue (Million), by Component 2024 & 2032
- Figure 23: Europe Management Decision Industry Revenue Share (%), by Component 2024 & 2032
- Figure 24: Europe Management Decision Industry Revenue (Million), by Deployment Type 2024 & 2032
- Figure 25: Europe Management Decision Industry Revenue Share (%), by Deployment Type 2024 & 2032
- Figure 26: Europe Management Decision Industry Revenue (Million), by End-User Industry 2024 & 2032
- Figure 27: Europe Management Decision Industry Revenue Share (%), by End-User Industry 2024 & 2032
- Figure 28: Europe Management Decision Industry Revenue (Million), by Country 2024 & 2032
- Figure 29: Europe Management Decision Industry Revenue Share (%), by Country 2024 & 2032
- Figure 30: Asia Pacific Management Decision Industry Revenue (Million), by Component 2024 & 2032
- Figure 31: Asia Pacific Management Decision Industry Revenue Share (%), by Component 2024 & 2032
- Figure 32: Asia Pacific Management Decision Industry Revenue (Million), by Deployment Type 2024 & 2032
- Figure 33: Asia Pacific Management Decision Industry Revenue Share (%), by Deployment Type 2024 & 2032
- Figure 34: Asia Pacific Management Decision Industry Revenue (Million), by End-User Industry 2024 & 2032
- Figure 35: Asia Pacific Management Decision Industry Revenue Share (%), by End-User Industry 2024 & 2032
- Figure 36: Asia Pacific Management Decision Industry Revenue (Million), by Country 2024 & 2032
- Figure 37: Asia Pacific Management Decision Industry Revenue Share (%), by Country 2024 & 2032
- Figure 38: Latin America Management Decision Industry Revenue (Million), by Component 2024 & 2032
- Figure 39: Latin America Management Decision Industry Revenue Share (%), by Component 2024 & 2032
- Figure 40: Latin America Management Decision Industry Revenue (Million), by Deployment Type 2024 & 2032
- Figure 41: Latin America Management Decision Industry Revenue Share (%), by Deployment Type 2024 & 2032
- Figure 42: Latin America Management Decision Industry Revenue (Million), by End-User Industry 2024 & 2032
- Figure 43: Latin America Management Decision Industry Revenue Share (%), by End-User Industry 2024 & 2032
- Figure 44: Latin America Management Decision Industry Revenue (Million), by Country 2024 & 2032
- Figure 45: Latin America Management Decision Industry Revenue Share (%), by Country 2024 & 2032
- Figure 46: Middle East and Africa Management Decision Industry Revenue (Million), by Component 2024 & 2032
- Figure 47: Middle East and Africa Management Decision Industry Revenue Share (%), by Component 2024 & 2032
- Figure 48: Middle East and Africa Management Decision Industry Revenue (Million), by Deployment Type 2024 & 2032
- Figure 49: Middle East and Africa Management Decision Industry Revenue Share (%), by Deployment Type 2024 & 2032
- Figure 50: Middle East and Africa Management Decision Industry Revenue (Million), by End-User Industry 2024 & 2032
- Figure 51: Middle East and Africa Management Decision Industry Revenue Share (%), by End-User Industry 2024 & 2032
- Figure 52: Middle East and Africa Management Decision Industry Revenue (Million), by Country 2024 & 2032
- Figure 53: Middle East and Africa Management Decision Industry Revenue Share (%), by Country 2024 & 2032
List of Tables
- Table 1: Global Management Decision Industry Revenue Million Forecast, by Region 2019 & 2032
- Table 2: Global Management Decision Industry Revenue Million Forecast, by Component 2019 & 2032
- Table 3: Global Management Decision Industry Revenue Million Forecast, by Deployment Type 2019 & 2032
- Table 4: Global Management Decision Industry Revenue Million Forecast, by End-User Industry 2019 & 2032
- Table 5: Global Management Decision Industry Revenue Million Forecast, by Region 2019 & 2032
- Table 6: Global Management Decision Industry Revenue Million Forecast, by Country 2019 & 2032
- Table 7: United States Management Decision Industry Revenue (Million) Forecast, by Application 2019 & 2032
- Table 8: Canada Management Decision Industry Revenue (Million) Forecast, by Application 2019 & 2032
- Table 9: Mexico Management Decision Industry Revenue (Million) Forecast, by Application 2019 & 2032
- Table 10: Global Management Decision Industry Revenue Million Forecast, by Country 2019 & 2032
- Table 11: Germany Management Decision Industry Revenue (Million) Forecast, by Application 2019 & 2032
- Table 12: United Kingdom Management Decision Industry Revenue (Million) Forecast, by Application 2019 & 2032
- Table 13: France Management Decision Industry Revenue (Million) Forecast, by Application 2019 & 2032
- Table 14: Spain Management Decision Industry Revenue (Million) Forecast, by Application 2019 & 2032
- Table 15: Italy Management Decision Industry Revenue (Million) Forecast, by Application 2019 & 2032
- Table 16: Spain Management Decision Industry Revenue (Million) Forecast, by Application 2019 & 2032
- Table 17: Belgium Management Decision Industry Revenue (Million) Forecast, by Application 2019 & 2032
- Table 18: Netherland Management Decision Industry Revenue (Million) Forecast, by Application 2019 & 2032
- Table 19: Nordics Management Decision Industry Revenue (Million) Forecast, by Application 2019 & 2032
- Table 20: Rest of Europe Management Decision Industry Revenue (Million) Forecast, by Application 2019 & 2032
- Table 21: Global Management Decision Industry Revenue Million Forecast, by Country 2019 & 2032
- Table 22: China Management Decision Industry Revenue (Million) Forecast, by Application 2019 & 2032
- Table 23: Japan Management Decision Industry Revenue (Million) Forecast, by Application 2019 & 2032
- Table 24: India Management Decision Industry Revenue (Million) Forecast, by Application 2019 & 2032
- Table 25: South Korea Management Decision Industry Revenue (Million) Forecast, by Application 2019 & 2032
- Table 26: Southeast Asia Management Decision Industry Revenue (Million) Forecast, by Application 2019 & 2032
- Table 27: Australia Management Decision Industry Revenue (Million) Forecast, by Application 2019 & 2032
- Table 28: Indonesia Management Decision Industry Revenue (Million) Forecast, by Application 2019 & 2032
- Table 29: Phillipes Management Decision Industry Revenue (Million) Forecast, by Application 2019 & 2032
- Table 30: Singapore Management Decision Industry Revenue (Million) Forecast, by Application 2019 & 2032
- Table 31: Thailandc Management Decision Industry Revenue (Million) Forecast, by Application 2019 & 2032
- Table 32: Rest of Asia Pacific Management Decision Industry Revenue (Million) Forecast, by Application 2019 & 2032
- Table 33: Global Management Decision Industry Revenue Million Forecast, by Country 2019 & 2032
- Table 34: Brazil Management Decision Industry Revenue (Million) Forecast, by Application 2019 & 2032
- Table 35: Argentina Management Decision Industry Revenue (Million) Forecast, by Application 2019 & 2032
- Table 36: Peru Management Decision Industry Revenue (Million) Forecast, by Application 2019 & 2032
- Table 37: Chile Management Decision Industry Revenue (Million) Forecast, by Application 2019 & 2032
- Table 38: Colombia Management Decision Industry Revenue (Million) Forecast, by Application 2019 & 2032
- Table 39: Ecuador Management Decision Industry Revenue (Million) Forecast, by Application 2019 & 2032
- Table 40: Venezuela Management Decision Industry Revenue (Million) Forecast, by Application 2019 & 2032
- Table 41: Rest of South America Management Decision Industry Revenue (Million) Forecast, by Application 2019 & 2032
- Table 42: Global Management Decision Industry Revenue Million Forecast, by Country 2019 & 2032
- Table 43: United States Management Decision Industry Revenue (Million) Forecast, by Application 2019 & 2032
- Table 44: Canada Management Decision Industry Revenue (Million) Forecast, by Application 2019 & 2032
- Table 45: Mexico Management Decision Industry Revenue (Million) Forecast, by Application 2019 & 2032
- Table 46: Global Management Decision Industry Revenue Million Forecast, by Country 2019 & 2032
- Table 47: United Arab Emirates Management Decision Industry Revenue (Million) Forecast, by Application 2019 & 2032
- Table 48: Saudi Arabia Management Decision Industry Revenue (Million) Forecast, by Application 2019 & 2032
- Table 49: South Africa Management Decision Industry Revenue (Million) Forecast, by Application 2019 & 2032
- Table 50: Rest of Middle East and Africa Management Decision Industry Revenue (Million) Forecast, by Application 2019 & 2032
- Table 51: Global Management Decision Industry Revenue Million Forecast, by Component 2019 & 2032
- Table 52: Global Management Decision Industry Revenue Million Forecast, by Deployment Type 2019 & 2032
- Table 53: Global Management Decision Industry Revenue Million Forecast, by End-User Industry 2019 & 2032
- Table 54: Global Management Decision Industry Revenue Million Forecast, by Country 2019 & 2032
- Table 55: United States Management Decision Industry Revenue (Million) Forecast, by Application 2019 & 2032
- Table 56: Canada Management Decision Industry Revenue (Million) Forecast, by Application 2019 & 2032
- Table 57: Rest of North America Management Decision Industry Revenue (Million) Forecast, by Application 2019 & 2032
- Table 58: Global Management Decision Industry Revenue Million Forecast, by Component 2019 & 2032
- Table 59: Global Management Decision Industry Revenue Million Forecast, by Deployment Type 2019 & 2032
- Table 60: Global Management Decision Industry Revenue Million Forecast, by End-User Industry 2019 & 2032
- Table 61: Global Management Decision Industry Revenue Million Forecast, by Country 2019 & 2032
- Table 62: Germany Management Decision Industry Revenue (Million) Forecast, by Application 2019 & 2032
- Table 63: United Kingdom Management Decision Industry Revenue (Million) Forecast, by Application 2019 & 2032
- Table 64: France Management Decision Industry Revenue (Million) Forecast, by Application 2019 & 2032
- Table 65: Spain Management Decision Industry Revenue (Million) Forecast, by Application 2019 & 2032
- Table 66: Rest of Europe Management Decision Industry Revenue (Million) Forecast, by Application 2019 & 2032
- Table 67: Global Management Decision Industry Revenue Million Forecast, by Component 2019 & 2032
- Table 68: Global Management Decision Industry Revenue Million Forecast, by Deployment Type 2019 & 2032
- Table 69: Global Management Decision Industry Revenue Million Forecast, by End-User Industry 2019 & 2032
- Table 70: Global Management Decision Industry Revenue Million Forecast, by Country 2019 & 2032
- Table 71: China Management Decision Industry Revenue (Million) Forecast, by Application 2019 & 2032
- Table 72: Japan Management Decision Industry Revenue (Million) Forecast, by Application 2019 & 2032
- Table 73: India Management Decision Industry Revenue (Million) Forecast, by Application 2019 & 2032
- Table 74: Rest of Asia Pacific Management Decision Industry Revenue (Million) Forecast, by Application 2019 & 2032
- Table 75: Global Management Decision Industry Revenue Million Forecast, by Component 2019 & 2032
- Table 76: Global Management Decision Industry Revenue Million Forecast, by Deployment Type 2019 & 2032
- Table 77: Global Management Decision Industry Revenue Million Forecast, by End-User Industry 2019 & 2032
- Table 78: Global Management Decision Industry Revenue Million Forecast, by Country 2019 & 2032
- Table 79: Brazil Management Decision Industry Revenue (Million) Forecast, by Application 2019 & 2032
- Table 80: Argentina Management Decision Industry Revenue (Million) Forecast, by Application 2019 & 2032
- Table 81: Rest of Latin America Management Decision Industry Revenue (Million) Forecast, by Application 2019 & 2032
- Table 82: Global Management Decision Industry Revenue Million Forecast, by Component 2019 & 2032
- Table 83: Global Management Decision Industry Revenue Million Forecast, by Deployment Type 2019 & 2032
- Table 84: Global Management Decision Industry Revenue Million Forecast, by End-User Industry 2019 & 2032
- Table 85: Global Management Decision Industry Revenue Million Forecast, by Country 2019 & 2032
- Table 86: UAE Management Decision Industry Revenue (Million) Forecast, by Application 2019 & 2032
- Table 87: Saudi Arabia Management Decision Industry Revenue (Million) Forecast, by Application 2019 & 2032
- Table 88: South Africa Management Decision Industry Revenue (Million) Forecast, by Application 2019 & 2032
- Table 89: Rest of Middle East and Africa Management Decision Industry Revenue (Million) Forecast, by Application 2019 & 2032
Frequently Asked Questions
1. What is the projected Compound Annual Growth Rate (CAGR) of the Management Decision Industry?
The projected CAGR is approximately 13.64%.
2. Which companies are prominent players in the Management Decision Industry?
Key companies in the market include SAS Institute Inc, Scorto Inc, Sparkling Logic Inc, TIBCO Software Inc, IBM Corporation, InRule Technology Inc, DMC Dubai (Decision Management Consultants)*List Not Exhaustive, FICO (Fair Isaac Corporation), Experian Information Solutions Inc, Pegasystems Inc, Actico GmbH, Sapiens International Corporation, Oracle Corporation, Equifax Inc, SAP SE.
3. What are the main segments of the Management Decision Industry?
The market segments include Component, Deployment Type, End-User Industry.
4. Can you provide details about the market size?
The market size is estimated to be USD 6.55 Million as of 2022.
5. What are some drivers contributing to market growth?
Increasing need for business agility which requires faster and efficient decision making; Increasing demand for Decision Analytics in BFSI sector to drive the market.
6. What are the notable trends driving market growth?
BSFI Sector is Expected to Hold Significant Share.
7. Are there any restraints impacting market growth?
High monetary cost involved for the implementation.
8. Can you provide examples of recent developments in the market?
November 2022 - IBM introduced Business Analytics Enterprise, a more advanced version of the program allowing companies to acquire a thorough perspective of the data sources across their entire business. The program will assist in business intelligence planning, budgeting, reporting, forecasting, and dashboard capabilities.
9. What pricing options are available for accessing the report?
Pricing options include single-user, multi-user, and enterprise licenses priced at USD 4750, USD 5250, and USD 8750 respectively.
10. Is the market size provided in terms of value or volume?
The market size is provided in terms of value, measured in Million.
11. Are there any specific market keywords associated with the report?
Yes, the market keyword associated with the report is "Management Decision Industry," which aids in identifying and referencing the specific market segment covered.
12. How do I determine which pricing option suits my needs best?
The pricing options vary based on user requirements and access needs. Individual users may opt for single-user licenses, while businesses requiring broader access may choose multi-user or enterprise licenses for cost-effective access to the report.
13. Are there any additional resources or data provided in the Management Decision Industry report?
While the report offers comprehensive insights, it's advisable to review the specific contents or supplementary materials provided to ascertain if additional resources or data are available.
14. How can I stay updated on further developments or reports in the Management Decision Industry?
To stay informed about further developments, trends, and reports in the Management Decision Industry, consider subscribing to industry newsletters, following relevant companies and organizations, or regularly checking reputable industry news sources and publications.
Methodology
Step 1 - Identification of Relevant Samples Size from Population Database


Step 2 - Approaches for Defining Global Market Size (Value, Volume* & Price*)

Note*: In applicable scenarios
Step 3 - Data Sources
Primary Research
- Web Analytics
- Survey Reports
- Research Institute
- Latest Research Reports
- Opinion Leaders
Secondary Research
- Annual Reports
- White Paper
- Latest Press Release
- Industry Association
- Paid Database
- Investor Presentations

Step 4 - Data Triangulation
Involves using different sources of information in order to increase the validity of a study
These sources are likely to be stakeholders in a program - participants, other researchers, program staff, other community members, and so on.
Then we put all data in single framework & apply various statistical tools to find out the dynamic on the market.
During the analysis stage, feedback from the stakeholder groups would be compared to determine areas of agreement as well as areas of divergence
