

Key Insights
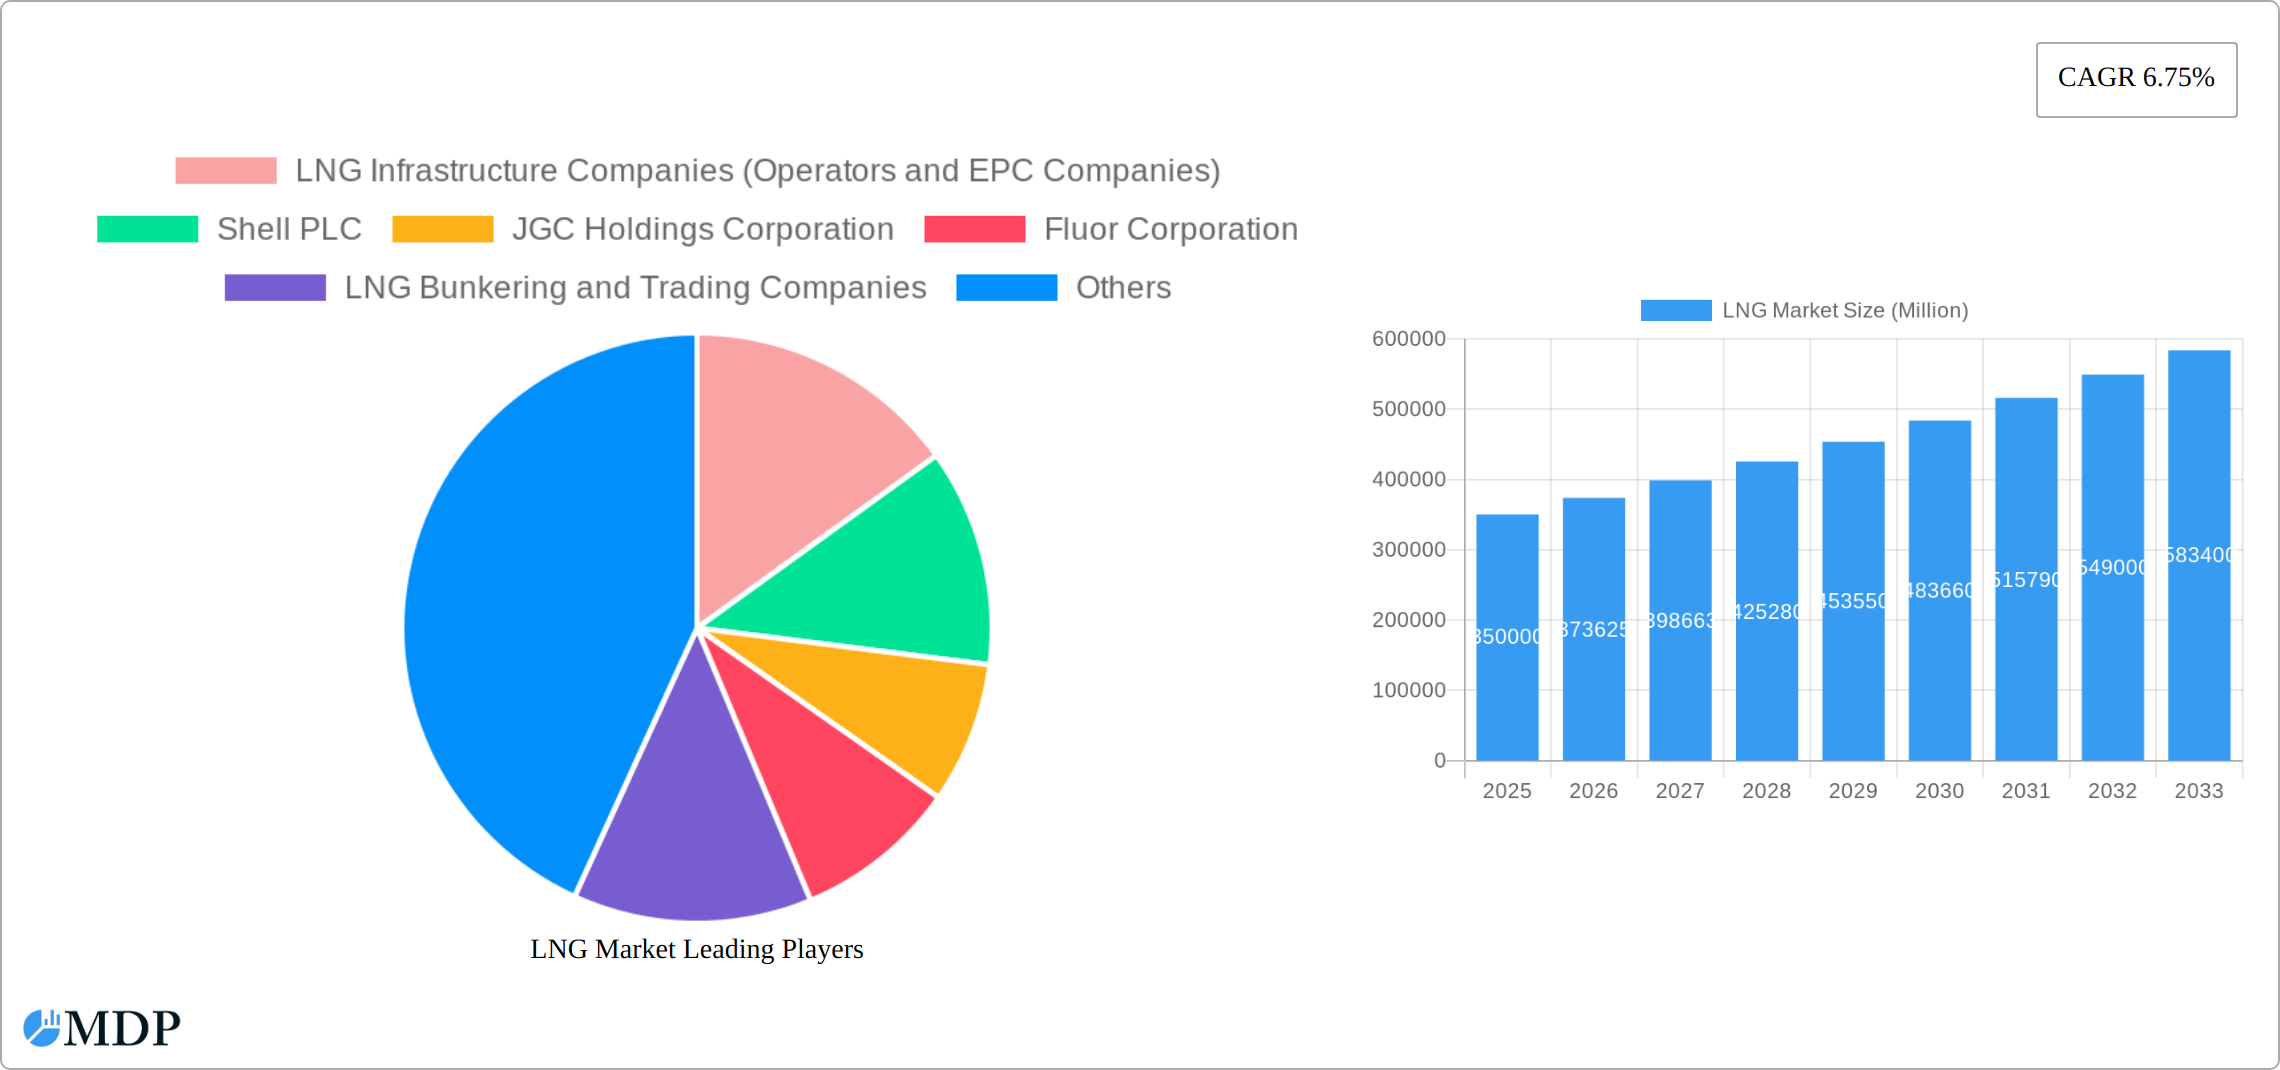
The global LNG market is experiencing robust growth, driven by increasing energy demand, particularly in Asia-Pacific and the transition towards cleaner energy sources. The market's compound annual growth rate (CAGR) of 6.75% from 2019 to 2024 suggests a significant expansion, projected to continue into the forecast period (2025-2033). Key drivers include rising natural gas consumption in power generation, industrial processes, and residential heating, especially in rapidly developing economies. Furthermore, the increasing adoption of LNG as a marine fuel, driven by stricter environmental regulations, is contributing significantly to market growth. The LNG infrastructure segment, encompassing liquefaction plants, regasification facilities, and shipping, is a major contributor to overall market value. Leading players such as Shell PLC, JGC Holdings Corporation, and Fluor Corporation are shaping market dynamics through strategic investments and technological advancements in LNG production and transportation. Challenges include geopolitical instability impacting supply chains, price volatility influenced by global energy markets, and the need for substantial capital investment in infrastructure development.
Despite these challenges, the long-term outlook for the LNG market remains positive. Technological innovations in liquefaction and regasification technologies are enhancing efficiency and reducing costs. Government support for LNG infrastructure development through subsidies and policy incentives is further fueling market growth. Regional variations are apparent, with Asia-Pacific anticipated to maintain its dominant market share, owing to its large and growing energy consumption. However, North America and Europe are also experiencing significant growth, driven by expanding LNG import and export activities. The segment comprising LNG bunkering and trading companies is also seeing considerable growth, reflecting the increasing significance of LNG as a marine fuel. The market's trajectory indicates continued expansion, driven by increasing global demand, improved technological efficiency, and favorable governmental policies. However, maintaining stability in energy prices and supply chains remains crucial for consistent and sustained market growth.
LNG Market Report: A Comprehensive Analysis (2019-2033)
This comprehensive report provides an in-depth analysis of the global LNG market, encompassing market dynamics, industry trends, leading players, and future growth prospects. With a study period spanning 2019-2033, a base year of 2025, and a forecast period of 2025-2033, this report is an essential resource for industry stakeholders seeking actionable insights and strategic guidance. The report analyzes the market size of over xx Million USD.
LNG Market Market Dynamics & Concentration
The LNG market is characterized by a moderate level of concentration, with a few major players holding significant market share. However, the market is also witnessing increased participation from smaller, specialized companies, particularly in LNG bunkering and trading. Innovation in liquefaction and regasification technologies, coupled with advancements in LNG shipping, are key drivers of market growth. Stringent environmental regulations, aiming to reduce greenhouse gas emissions, are shaping the industry landscape, pushing companies to adopt cleaner technologies and sustainable practices. Product substitutes, such as renewable energy sources, pose a competitive threat, though the demand for LNG as a transitional fuel remains significant. End-user trends indicate a shift towards cleaner energy solutions across various sectors, influencing the demand for LNG. Mergers and acquisitions (M&A) activity has been robust in recent years, with xx major deals recorded between 2019 and 2024, leading to consolidation and increased market concentration. This M&A activity is driven by the desire for companies to expand their geographic reach, optimize their operations, and enhance their technological capabilities.
- Market Share: Top 5 players hold approximately xx% of the global market share (2024).
- M&A Deal Count: xx major deals between 2019 and 2024.
- Innovation Drivers: Technological advancements in liquefaction, regasification, and shipping.
- Regulatory Frameworks: Stringent environmental regulations driving adoption of cleaner technologies.
- Product Substitutes: Renewable energy sources posing a competitive threat.
LNG Market Industry Trends & Analysis
The LNG market is experiencing robust growth, fueled by the increasing global demand for energy, particularly in rapidly developing Asian and European economies. Analysts project a compound annual growth rate (CAGR) of xx% between 2025 and 2033. This expansion is significantly driven by several key factors. Technological advancements, such as the development of floating LNG (FLNG) facilities and the optimization of LNG shipping technologies, are enhancing efficiency and reducing costs throughout the LNG value chain. Furthermore, a global shift towards cleaner and more sustainable energy sources positions LNG as a crucial transition fuel, significantly impacting demand. The competitive landscape is highly dynamic, with major players continually innovating and optimizing operations to maintain their market share. The penetration of LNG into diverse sectors, including power generation, transportation, and industrial applications, continues to grow, contributing substantially to the overall market expansion. Geopolitical factors also play a significant role, influencing supply chains and price volatility.
Leading Markets & Segments in LNG Market
The Asia-Pacific region remains the dominant force in the global LNG market, fueled by the considerable energy demands of countries like China, Japan, South Korea, and India. This region's robust economic growth and the expansion of its industrial sector are primary drivers of this market leadership. However, Europe and North America are also experiencing significant growth, driven by diversification strategies and energy security concerns.
Key Drivers:
- Economic Policies: Supportive government policies focusing on energy security, diversification, and the reduction of carbon emissions are actively shaping market growth.
- Infrastructure Development: Substantial investments in LNG import and export infrastructure are crucial for facilitating trade and expanding market access.
- Geopolitical Factors: Global political stability and international relations significantly impact LNG supply chains and price dynamics.
LNG Infrastructure Segment Analysis:
- LNG Liquefaction Plants: The Middle East and North America are currently leading in liquefaction capacity, though this is expected to evolve as new projects come online in other regions.
- LNG Regasification Facilities: Asia-Pacific holds a substantial share of global regasification capacity, reflecting the region's high demand for imported LNG.
- LNG Shipping: The global LNG shipping fleet is undergoing continuous expansion to accommodate the growing demand for LNG transportation.
LNG Market Product Developments
Significant advancements in LNG technologies are transforming the industry. Innovations focus on improving efficiency, reducing emissions, and enhancing safety. These advancements range from improved liquefaction and regasification technologies to the development of innovative LNG carriers and bunkering solutions. The market is seeing a growing adoption of FLNG technologies, offering greater flexibility and reducing the need for large-scale onshore infrastructure. These innovations provide competitive advantages by reducing costs, improving efficiency, and contributing to environmental sustainability.
Key Drivers of LNG Market Growth
The growth of the LNG market is propelled by a confluence of factors. Rising global energy demand, especially in developing economies, is a fundamental driver. The increasing adoption of natural gas as a cleaner alternative to coal is further boosting LNG consumption. Government policies aimed at improving energy security and diversification are crucial in encouraging investments in LNG infrastructure. Furthermore, the need to mitigate climate change and meet carbon reduction targets is creating a significant demand for cleaner-burning fuels like natural gas as a transition fuel.
Challenges in the LNG Market Market
The LNG market faces several challenges. Fluctuating natural gas prices, geopolitical instability, and regulatory uncertainties can impact market stability. Supply chain disruptions and logistical complexities associated with LNG transportation can also increase costs and reduce efficiency. Intense competition among major players can lead to price wars and margin compression. These challenges present significant obstacles for companies operating in the LNG market.
Emerging Opportunities in LNG Market
Technological advancements in LNG liquefaction, transportation, and regasification offer significant opportunities for market expansion. Strategic partnerships between companies, facilitating access to new markets and technologies, are also driving growth. Moreover, the expanding scope of LNG applications, particularly in transportation and industrial sectors, presents significant potential for long-term market growth.
Leading Players in the LNG Market Sector
- Shell PLC
- JGC Holdings Corporation
- Fluor Corporation
- Bechtel Corporation
- Gazpromneft Marine Bunker LLC
- Gasum AS
- Chiyoda Corporation
- Technip FMC PLC
- ENN Energy Holdings Ltd
- Engie SA
- Numerous other national and international players are also significantly contributing to the LNG market.
Key Milestones in LNG Market Industry
- Mar 2023: Sempra Infrastructure Partners LP reached a positive final investment decision (FID) for the Port Arthur LNG Phase 1 project in Texas, signifying a significant investment in US LNG production capacity and boosting North American LNG exports.
- Apr 2022: Petronet LNG announced plans for a floating LNG terminal in Odisha, India, and capacity expansion at the Dahej terminal, demonstrating increased import capacity and investment in the Indian market, highlighting Asia's continued LNG demand.
- [Add other recent significant milestones here, including project launches, mergers and acquisitions, and significant policy changes.]
Strategic Outlook for LNG Market Market
The LNG market is poised for continued growth, driven by increasing global energy demand and the transition to cleaner energy sources. Strategic investments in LNG infrastructure, technological advancements, and strategic partnerships will be crucial for companies to capture market share and drive profitability. The focus on sustainability and emission reduction will also shape future market dynamics, creating opportunities for companies that can offer innovative and environmentally friendly solutions.
LNG Market Segmentation
-
1. LNG Infrastructure
- 1.1. LNG Liquefaction Plants
- 1.2. LNG Regasification Facilities
- 1.3. LNG Shipping
- 2. LNG Trade
LNG Market Segmentation By Geography
-
1. North America
- 1.1. United States
- 1.2. Canada
- 1.3. Mexico
- 1.4. Rest of the North America
-
2. Europe
- 2.1. Germany
- 2.2. United Kingdom
- 2.3. France
- 2.4. Rest of the Europe
-
3. Asia Pacific
- 3.1. China
- 3.2. South Korea
- 3.3. Japan
- 3.4. Rest of the Asia Pacific
-
4. South America
- 4.1. Brazil
- 4.2. Argentina
- 4.3. Rest of the South America
-
5. Middle East and Africa
- 5.1. United Arab Emirates
- 5.2. Saudi Arabia
- 5.3. Rest of the Middle East and Africa

LNG Market REPORT HIGHLIGHTS
| Aspects | Details |
|---|---|
| Study Period | 2019-2033 |
| Base Year | 2024 |
| Estimated Year | 2025 |
| Forecast Period | 2025-2033 |
| Historical Period | 2019-2024 |
| Growth Rate | CAGR of 6.75% from 2019-2033 |
| Segmentation |
|
Table of Contents
- 1. Introduction
- 1.1. Research Scope
- 1.2. Market Segmentation
- 1.3. Research Methodology
- 1.4. Definitions and Assumptions
- 2. Executive Summary
- 2.1. Introduction
- 3. Market Dynamics
- 3.1. Introduction
- 3.2. Market Drivers
- 3.2.1. 4.; Increasing Investments in Offshore Oil and Gas Projects
- 3.3. Market Restrains
- 3.3.1. 4.; Increasing Penetration of Renewable Energy
- 3.4. Market Trends
- 3.4.1. Liquefaction Sector to Dominate the Market
- 4. Market Factor Analysis
- 4.1. Porters Five Forces
- 4.2. Supply/Value Chain
- 4.3. PESTEL analysis
- 4.4. Market Entropy
- 4.5. Patent/Trademark Analysis
- 5. Global LNG Market Analysis, Insights and Forecast, 2019-2031
- 5.1. Market Analysis, Insights and Forecast - by LNG Infrastructure
- 5.1.1. LNG Liquefaction Plants
- 5.1.2. LNG Regasification Facilities
- 5.1.3. LNG Shipping
- 5.2. Market Analysis, Insights and Forecast - by LNG Trade
- 5.3. Market Analysis, Insights and Forecast - by Region
- 5.3.1. North America
- 5.3.2. Europe
- 5.3.3. Asia Pacific
- 5.3.4. South America
- 5.3.5. Middle East and Africa
- 5.1. Market Analysis, Insights and Forecast - by LNG Infrastructure
- 6. North America LNG Market Analysis, Insights and Forecast, 2019-2031
- 6.1. Market Analysis, Insights and Forecast - by LNG Infrastructure
- 6.1.1. LNG Liquefaction Plants
- 6.1.2. LNG Regasification Facilities
- 6.1.3. LNG Shipping
- 6.2. Market Analysis, Insights and Forecast - by LNG Trade
- 6.1. Market Analysis, Insights and Forecast - by LNG Infrastructure
- 7. Europe LNG Market Analysis, Insights and Forecast, 2019-2031
- 7.1. Market Analysis, Insights and Forecast - by LNG Infrastructure
- 7.1.1. LNG Liquefaction Plants
- 7.1.2. LNG Regasification Facilities
- 7.1.3. LNG Shipping
- 7.2. Market Analysis, Insights and Forecast - by LNG Trade
- 7.1. Market Analysis, Insights and Forecast - by LNG Infrastructure
- 8. Asia Pacific LNG Market Analysis, Insights and Forecast, 2019-2031
- 8.1. Market Analysis, Insights and Forecast - by LNG Infrastructure
- 8.1.1. LNG Liquefaction Plants
- 8.1.2. LNG Regasification Facilities
- 8.1.3. LNG Shipping
- 8.2. Market Analysis, Insights and Forecast - by LNG Trade
- 8.1. Market Analysis, Insights and Forecast - by LNG Infrastructure
- 9. South America LNG Market Analysis, Insights and Forecast, 2019-2031
- 9.1. Market Analysis, Insights and Forecast - by LNG Infrastructure
- 9.1.1. LNG Liquefaction Plants
- 9.1.2. LNG Regasification Facilities
- 9.1.3. LNG Shipping
- 9.2. Market Analysis, Insights and Forecast - by LNG Trade
- 9.1. Market Analysis, Insights and Forecast - by LNG Infrastructure
- 10. Middle East and Africa LNG Market Analysis, Insights and Forecast, 2019-2031
- 10.1. Market Analysis, Insights and Forecast - by LNG Infrastructure
- 10.1.1. LNG Liquefaction Plants
- 10.1.2. LNG Regasification Facilities
- 10.1.3. LNG Shipping
- 10.2. Market Analysis, Insights and Forecast - by LNG Trade
- 10.1. Market Analysis, Insights and Forecast - by LNG Infrastructure
- 11. North America LNG Market Analysis, Insights and Forecast, 2019-2031
- 11.1. Market Analysis, Insights and Forecast - By Country/Sub-region
- 11.1.1 United States
- 11.1.2 Canada
- 11.1.3 Mexico
- 12. Europe LNG Market Analysis, Insights and Forecast, 2019-2031
- 12.1. Market Analysis, Insights and Forecast - By Country/Sub-region
- 12.1.1 Germany
- 12.1.2 United Kingdom
- 12.1.3 France
- 12.1.4 Spain
- 12.1.5 Italy
- 12.1.6 Spain
- 12.1.7 Belgium
- 12.1.8 Netherland
- 12.1.9 Nordics
- 12.1.10 Rest of Europe
- 13. Asia Pacific LNG Market Analysis, Insights and Forecast, 2019-2031
- 13.1. Market Analysis, Insights and Forecast - By Country/Sub-region
- 13.1.1 China
- 13.1.2 Japan
- 13.1.3 India
- 13.1.4 South Korea
- 13.1.5 Southeast Asia
- 13.1.6 Australia
- 13.1.7 Indonesia
- 13.1.8 Phillipes
- 13.1.9 Singapore
- 13.1.10 Thailandc
- 13.1.11 Rest of Asia Pacific
- 14. South America LNG Market Analysis, Insights and Forecast, 2019-2031
- 14.1. Market Analysis, Insights and Forecast - By Country/Sub-region
- 14.1.1 Brazil
- 14.1.2 Argentina
- 14.1.3 Peru
- 14.1.4 Chile
- 14.1.5 Colombia
- 14.1.6 Ecuador
- 14.1.7 Venezuela
- 14.1.8 Rest of South America
- 15. MEA LNG Market Analysis, Insights and Forecast, 2019-2031
- 15.1. Market Analysis, Insights and Forecast - By Country/Sub-region
- 15.1.1 United Arab Emirates
- 15.1.2 Saudi Arabia
- 15.1.3 South Africa
- 15.1.4 Rest of Middle East and Africa
- 16. Competitive Analysis
- 16.1. Global Market Share Analysis 2024
- 16.2. Company Profiles
- 16.2.1 LNG Infrastructure Companies (Operators and EPC Companies)
- 16.2.1.1. Overview
- 16.2.1.2. Products
- 16.2.1.3. SWOT Analysis
- 16.2.1.4. Recent Developments
- 16.2.1.5. Financials (Based on Availability)
- 16.2.2 Shell PLC
- 16.2.2.1. Overview
- 16.2.2.2. Products
- 16.2.2.3. SWOT Analysis
- 16.2.2.4. Recent Developments
- 16.2.2.5. Financials (Based on Availability)
- 16.2.3 JGC Holdings Corporation
- 16.2.3.1. Overview
- 16.2.3.2. Products
- 16.2.3.3. SWOT Analysis
- 16.2.3.4. Recent Developments
- 16.2.3.5. Financials (Based on Availability)
- 16.2.4 Fluor Corporation
- 16.2.4.1. Overview
- 16.2.4.2. Products
- 16.2.4.3. SWOT Analysis
- 16.2.4.4. Recent Developments
- 16.2.4.5. Financials (Based on Availability)
- 16.2.5 LNG Bunkering and Trading Companies
- 16.2.5.1. Overview
- 16.2.5.2. Products
- 16.2.5.3. SWOT Analysis
- 16.2.5.4. Recent Developments
- 16.2.5.5. Financials (Based on Availability)
- 16.2.6 Bechtel Corporation
- 16.2.6.1. Overview
- 16.2.6.2. Products
- 16.2.6.3. SWOT Analysis
- 16.2.6.4. Recent Developments
- 16.2.6.5. Financials (Based on Availability)
- 16.2.7 Gazpromneft Marine Bunker LLC
- 16.2.7.1. Overview
- 16.2.7.2. Products
- 16.2.7.3. SWOT Analysis
- 16.2.7.4. Recent Developments
- 16.2.7.5. Financials (Based on Availability)
- 16.2.8 Gasum AS
- 16.2.8.1. Overview
- 16.2.8.2. Products
- 16.2.8.3. SWOT Analysis
- 16.2.8.4. Recent Developments
- 16.2.8.5. Financials (Based on Availability)
- 16.2.9 Chiyoda Corporation
- 16.2.9.1. Overview
- 16.2.9.2. Products
- 16.2.9.3. SWOT Analysis
- 16.2.9.4. Recent Developments
- 16.2.9.5. Financials (Based on Availability)
- 16.2.10 Technip FMC PLC
- 16.2.10.1. Overview
- 16.2.10.2. Products
- 16.2.10.3. SWOT Analysis
- 16.2.10.4. Recent Developments
- 16.2.10.5. Financials (Based on Availability)
- 16.2.11 ENN Energy Holdings Ltd
- 16.2.11.1. Overview
- 16.2.11.2. Products
- 16.2.11.3. SWOT Analysis
- 16.2.11.4. Recent Developments
- 16.2.11.5. Financials (Based on Availability)
- 16.2.12 Engie SA
- 16.2.12.1. Overview
- 16.2.12.2. Products
- 16.2.12.3. SWOT Analysis
- 16.2.12.4. Recent Developments
- 16.2.12.5. Financials (Based on Availability)
- 16.2.1 LNG Infrastructure Companies (Operators and EPC Companies)
List of Figures
- Figure 1: Global LNG Market Revenue Breakdown (Million, %) by Region 2024 & 2032
- Figure 2: North America LNG Market Revenue (Million), by Country 2024 & 2032
- Figure 3: North America LNG Market Revenue Share (%), by Country 2024 & 2032
- Figure 4: Europe LNG Market Revenue (Million), by Country 2024 & 2032
- Figure 5: Europe LNG Market Revenue Share (%), by Country 2024 & 2032
- Figure 6: Asia Pacific LNG Market Revenue (Million), by Country 2024 & 2032
- Figure 7: Asia Pacific LNG Market Revenue Share (%), by Country 2024 & 2032
- Figure 8: South America LNG Market Revenue (Million), by Country 2024 & 2032
- Figure 9: South America LNG Market Revenue Share (%), by Country 2024 & 2032
- Figure 10: MEA LNG Market Revenue (Million), by Country 2024 & 2032
- Figure 11: MEA LNG Market Revenue Share (%), by Country 2024 & 2032
- Figure 12: North America LNG Market Revenue (Million), by LNG Infrastructure 2024 & 2032
- Figure 13: North America LNG Market Revenue Share (%), by LNG Infrastructure 2024 & 2032
- Figure 14: North America LNG Market Revenue (Million), by LNG Trade 2024 & 2032
- Figure 15: North America LNG Market Revenue Share (%), by LNG Trade 2024 & 2032
- Figure 16: North America LNG Market Revenue (Million), by Country 2024 & 2032
- Figure 17: North America LNG Market Revenue Share (%), by Country 2024 & 2032
- Figure 18: Europe LNG Market Revenue (Million), by LNG Infrastructure 2024 & 2032
- Figure 19: Europe LNG Market Revenue Share (%), by LNG Infrastructure 2024 & 2032
- Figure 20: Europe LNG Market Revenue (Million), by LNG Trade 2024 & 2032
- Figure 21: Europe LNG Market Revenue Share (%), by LNG Trade 2024 & 2032
- Figure 22: Europe LNG Market Revenue (Million), by Country 2024 & 2032
- Figure 23: Europe LNG Market Revenue Share (%), by Country 2024 & 2032
- Figure 24: Asia Pacific LNG Market Revenue (Million), by LNG Infrastructure 2024 & 2032
- Figure 25: Asia Pacific LNG Market Revenue Share (%), by LNG Infrastructure 2024 & 2032
- Figure 26: Asia Pacific LNG Market Revenue (Million), by LNG Trade 2024 & 2032
- Figure 27: Asia Pacific LNG Market Revenue Share (%), by LNG Trade 2024 & 2032
- Figure 28: Asia Pacific LNG Market Revenue (Million), by Country 2024 & 2032
- Figure 29: Asia Pacific LNG Market Revenue Share (%), by Country 2024 & 2032
- Figure 30: South America LNG Market Revenue (Million), by LNG Infrastructure 2024 & 2032
- Figure 31: South America LNG Market Revenue Share (%), by LNG Infrastructure 2024 & 2032
- Figure 32: South America LNG Market Revenue (Million), by LNG Trade 2024 & 2032
- Figure 33: South America LNG Market Revenue Share (%), by LNG Trade 2024 & 2032
- Figure 34: South America LNG Market Revenue (Million), by Country 2024 & 2032
- Figure 35: South America LNG Market Revenue Share (%), by Country 2024 & 2032
- Figure 36: Middle East and Africa LNG Market Revenue (Million), by LNG Infrastructure 2024 & 2032
- Figure 37: Middle East and Africa LNG Market Revenue Share (%), by LNG Infrastructure 2024 & 2032
- Figure 38: Middle East and Africa LNG Market Revenue (Million), by LNG Trade 2024 & 2032
- Figure 39: Middle East and Africa LNG Market Revenue Share (%), by LNG Trade 2024 & 2032
- Figure 40: Middle East and Africa LNG Market Revenue (Million), by Country 2024 & 2032
- Figure 41: Middle East and Africa LNG Market Revenue Share (%), by Country 2024 & 2032
List of Tables
- Table 1: Global LNG Market Revenue Million Forecast, by Region 2019 & 2032
- Table 2: Global LNG Market Revenue Million Forecast, by LNG Infrastructure 2019 & 2032
- Table 3: Global LNG Market Revenue Million Forecast, by LNG Trade 2019 & 2032
- Table 4: Global LNG Market Revenue Million Forecast, by Region 2019 & 2032
- Table 5: Global LNG Market Revenue Million Forecast, by Country 2019 & 2032
- Table 6: United States LNG Market Revenue (Million) Forecast, by Application 2019 & 2032
- Table 7: Canada LNG Market Revenue (Million) Forecast, by Application 2019 & 2032
- Table 8: Mexico LNG Market Revenue (Million) Forecast, by Application 2019 & 2032
- Table 9: Global LNG Market Revenue Million Forecast, by Country 2019 & 2032
- Table 10: Germany LNG Market Revenue (Million) Forecast, by Application 2019 & 2032
- Table 11: United Kingdom LNG Market Revenue (Million) Forecast, by Application 2019 & 2032
- Table 12: France LNG Market Revenue (Million) Forecast, by Application 2019 & 2032
- Table 13: Spain LNG Market Revenue (Million) Forecast, by Application 2019 & 2032
- Table 14: Italy LNG Market Revenue (Million) Forecast, by Application 2019 & 2032
- Table 15: Spain LNG Market Revenue (Million) Forecast, by Application 2019 & 2032
- Table 16: Belgium LNG Market Revenue (Million) Forecast, by Application 2019 & 2032
- Table 17: Netherland LNG Market Revenue (Million) Forecast, by Application 2019 & 2032
- Table 18: Nordics LNG Market Revenue (Million) Forecast, by Application 2019 & 2032
- Table 19: Rest of Europe LNG Market Revenue (Million) Forecast, by Application 2019 & 2032
- Table 20: Global LNG Market Revenue Million Forecast, by Country 2019 & 2032
- Table 21: China LNG Market Revenue (Million) Forecast, by Application 2019 & 2032
- Table 22: Japan LNG Market Revenue (Million) Forecast, by Application 2019 & 2032
- Table 23: India LNG Market Revenue (Million) Forecast, by Application 2019 & 2032
- Table 24: South Korea LNG Market Revenue (Million) Forecast, by Application 2019 & 2032
- Table 25: Southeast Asia LNG Market Revenue (Million) Forecast, by Application 2019 & 2032
- Table 26: Australia LNG Market Revenue (Million) Forecast, by Application 2019 & 2032
- Table 27: Indonesia LNG Market Revenue (Million) Forecast, by Application 2019 & 2032
- Table 28: Phillipes LNG Market Revenue (Million) Forecast, by Application 2019 & 2032
- Table 29: Singapore LNG Market Revenue (Million) Forecast, by Application 2019 & 2032
- Table 30: Thailandc LNG Market Revenue (Million) Forecast, by Application 2019 & 2032
- Table 31: Rest of Asia Pacific LNG Market Revenue (Million) Forecast, by Application 2019 & 2032
- Table 32: Global LNG Market Revenue Million Forecast, by Country 2019 & 2032
- Table 33: Brazil LNG Market Revenue (Million) Forecast, by Application 2019 & 2032
- Table 34: Argentina LNG Market Revenue (Million) Forecast, by Application 2019 & 2032
- Table 35: Peru LNG Market Revenue (Million) Forecast, by Application 2019 & 2032
- Table 36: Chile LNG Market Revenue (Million) Forecast, by Application 2019 & 2032
- Table 37: Colombia LNG Market Revenue (Million) Forecast, by Application 2019 & 2032
- Table 38: Ecuador LNG Market Revenue (Million) Forecast, by Application 2019 & 2032
- Table 39: Venezuela LNG Market Revenue (Million) Forecast, by Application 2019 & 2032
- Table 40: Rest of South America LNG Market Revenue (Million) Forecast, by Application 2019 & 2032
- Table 41: Global LNG Market Revenue Million Forecast, by Country 2019 & 2032
- Table 42: United Arab Emirates LNG Market Revenue (Million) Forecast, by Application 2019 & 2032
- Table 43: Saudi Arabia LNG Market Revenue (Million) Forecast, by Application 2019 & 2032
- Table 44: South Africa LNG Market Revenue (Million) Forecast, by Application 2019 & 2032
- Table 45: Rest of Middle East and Africa LNG Market Revenue (Million) Forecast, by Application 2019 & 2032
- Table 46: Global LNG Market Revenue Million Forecast, by LNG Infrastructure 2019 & 2032
- Table 47: Global LNG Market Revenue Million Forecast, by LNG Trade 2019 & 2032
- Table 48: Global LNG Market Revenue Million Forecast, by Country 2019 & 2032
- Table 49: United States LNG Market Revenue (Million) Forecast, by Application 2019 & 2032
- Table 50: Canada LNG Market Revenue (Million) Forecast, by Application 2019 & 2032
- Table 51: Mexico LNG Market Revenue (Million) Forecast, by Application 2019 & 2032
- Table 52: Rest of the North America LNG Market Revenue (Million) Forecast, by Application 2019 & 2032
- Table 53: Global LNG Market Revenue Million Forecast, by LNG Infrastructure 2019 & 2032
- Table 54: Global LNG Market Revenue Million Forecast, by LNG Trade 2019 & 2032
- Table 55: Global LNG Market Revenue Million Forecast, by Country 2019 & 2032
- Table 56: Germany LNG Market Revenue (Million) Forecast, by Application 2019 & 2032
- Table 57: United Kingdom LNG Market Revenue (Million) Forecast, by Application 2019 & 2032
- Table 58: France LNG Market Revenue (Million) Forecast, by Application 2019 & 2032
- Table 59: Rest of the Europe LNG Market Revenue (Million) Forecast, by Application 2019 & 2032
- Table 60: Global LNG Market Revenue Million Forecast, by LNG Infrastructure 2019 & 2032
- Table 61: Global LNG Market Revenue Million Forecast, by LNG Trade 2019 & 2032
- Table 62: Global LNG Market Revenue Million Forecast, by Country 2019 & 2032
- Table 63: China LNG Market Revenue (Million) Forecast, by Application 2019 & 2032
- Table 64: South Korea LNG Market Revenue (Million) Forecast, by Application 2019 & 2032
- Table 65: Japan LNG Market Revenue (Million) Forecast, by Application 2019 & 2032
- Table 66: Rest of the Asia Pacific LNG Market Revenue (Million) Forecast, by Application 2019 & 2032
- Table 67: Global LNG Market Revenue Million Forecast, by LNG Infrastructure 2019 & 2032
- Table 68: Global LNG Market Revenue Million Forecast, by LNG Trade 2019 & 2032
- Table 69: Global LNG Market Revenue Million Forecast, by Country 2019 & 2032
- Table 70: Brazil LNG Market Revenue (Million) Forecast, by Application 2019 & 2032
- Table 71: Argentina LNG Market Revenue (Million) Forecast, by Application 2019 & 2032
- Table 72: Rest of the South America LNG Market Revenue (Million) Forecast, by Application 2019 & 2032
- Table 73: Global LNG Market Revenue Million Forecast, by LNG Infrastructure 2019 & 2032
- Table 74: Global LNG Market Revenue Million Forecast, by LNG Trade 2019 & 2032
- Table 75: Global LNG Market Revenue Million Forecast, by Country 2019 & 2032
- Table 76: United Arab Emirates LNG Market Revenue (Million) Forecast, by Application 2019 & 2032
- Table 77: Saudi Arabia LNG Market Revenue (Million) Forecast, by Application 2019 & 2032
- Table 78: Rest of the Middle East and Africa LNG Market Revenue (Million) Forecast, by Application 2019 & 2032
Frequently Asked Questions
1. What is the projected Compound Annual Growth Rate (CAGR) of the LNG Market?
The projected CAGR is approximately 6.75%.
2. Which companies are prominent players in the LNG Market?
Key companies in the market include LNG Infrastructure Companies (Operators and EPC Companies), Shell PLC, JGC Holdings Corporation, Fluor Corporation, LNG Bunkering and Trading Companies, Bechtel Corporation, Gazpromneft Marine Bunker LLC, Gasum AS, Chiyoda Corporation, Technip FMC PLC, ENN Energy Holdings Ltd, Engie SA.
3. What are the main segments of the LNG Market?
The market segments include LNG Infrastructure, LNG Trade.
4. Can you provide details about the market size?
The market size is estimated to be USD XX Million as of 2022.
5. What are some drivers contributing to market growth?
4.; Increasing Investments in Offshore Oil and Gas Projects.
6. What are the notable trends driving market growth?
Liquefaction Sector to Dominate the Market.
7. Are there any restraints impacting market growth?
4.; Increasing Penetration of Renewable Energy.
8. Can you provide examples of recent developments in the market?
Mar 2023: Sempra reported that Sempra Infrastructure Partners LP (Sempra Infrastructure), its 70%-owned subsidiary, reached a positive final investment decision (FID) for the development, construction, and operation of the Port Arthur LNG Phase 1 project in Jefferson County, Texas.
9. What pricing options are available for accessing the report?
Pricing options include single-user, multi-user, and enterprise licenses priced at USD 4750, USD 5250, and USD 8750 respectively.
10. Is the market size provided in terms of value or volume?
The market size is provided in terms of value, measured in Million.
11. Are there any specific market keywords associated with the report?
Yes, the market keyword associated with the report is "LNG Market," which aids in identifying and referencing the specific market segment covered.
12. How do I determine which pricing option suits my needs best?
The pricing options vary based on user requirements and access needs. Individual users may opt for single-user licenses, while businesses requiring broader access may choose multi-user or enterprise licenses for cost-effective access to the report.
13. Are there any additional resources or data provided in the LNG Market report?
While the report offers comprehensive insights, it's advisable to review the specific contents or supplementary materials provided to ascertain if additional resources or data are available.
14. How can I stay updated on further developments or reports in the LNG Market?
To stay informed about further developments, trends, and reports in the LNG Market, consider subscribing to industry newsletters, following relevant companies and organizations, or regularly checking reputable industry news sources and publications.
Methodology
Step 1 - Identification of Relevant Samples Size from Population Database


Step 2 - Approaches for Defining Global Market Size (Value, Volume* & Price*)

Note*: In applicable scenarios
Step 3 - Data Sources
Primary Research
- Web Analytics
- Survey Reports
- Research Institute
- Latest Research Reports
- Opinion Leaders
Secondary Research
- Annual Reports
- White Paper
- Latest Press Release
- Industry Association
- Paid Database
- Investor Presentations

Step 4 - Data Triangulation
Involves using different sources of information in order to increase the validity of a study
These sources are likely to be stakeholders in a program - participants, other researchers, program staff, other community members, and so on.
Then we put all data in single framework & apply various statistical tools to find out the dynamic on the market.
During the analysis stage, feedback from the stakeholder groups would be compared to determine areas of agreement as well as areas of divergence
