

Key Insights
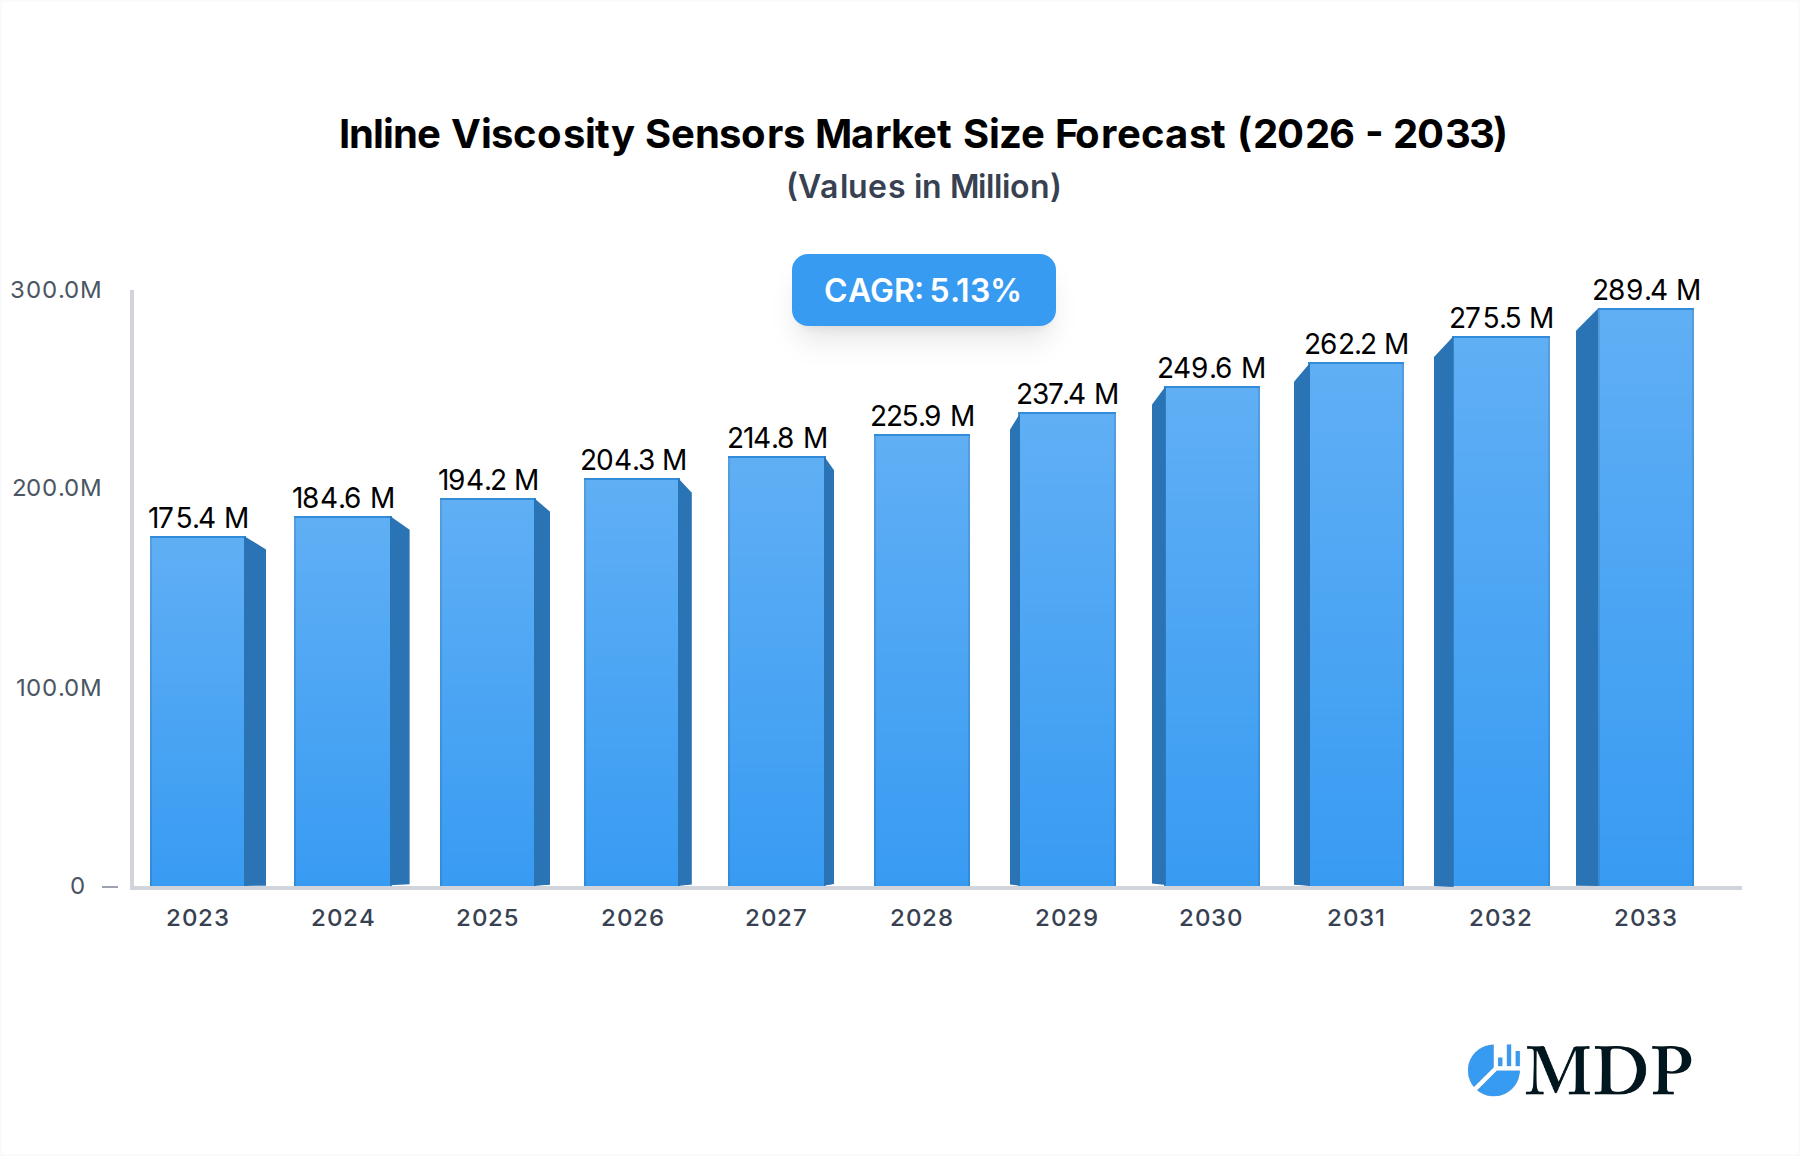
The global Inline Viscosity Sensors market is poised for substantial growth, projected to reach an estimated $175.4 million in 2023, with a robust Compound Annual Growth Rate (CAGR) of 5.2% through 2033. This expansion is primarily driven by the increasing demand for process automation and quality control across various industries. The need for precise real-time viscosity monitoring to optimize product quality, reduce waste, and ensure operational efficiency in manufacturing processes fuels this upward trajectory. Sectors such as food and beverage, pharmaceuticals, oil and gas, and chemical manufacturing are key adopters, leveraging inline viscosity sensors to maintain consistent product standards and enhance production yields. The growing emphasis on stringent regulatory compliance and the adoption of Industry 4.0 technologies further bolster the market's development.

Inline Viscosity Sensors Market Size (In Million)
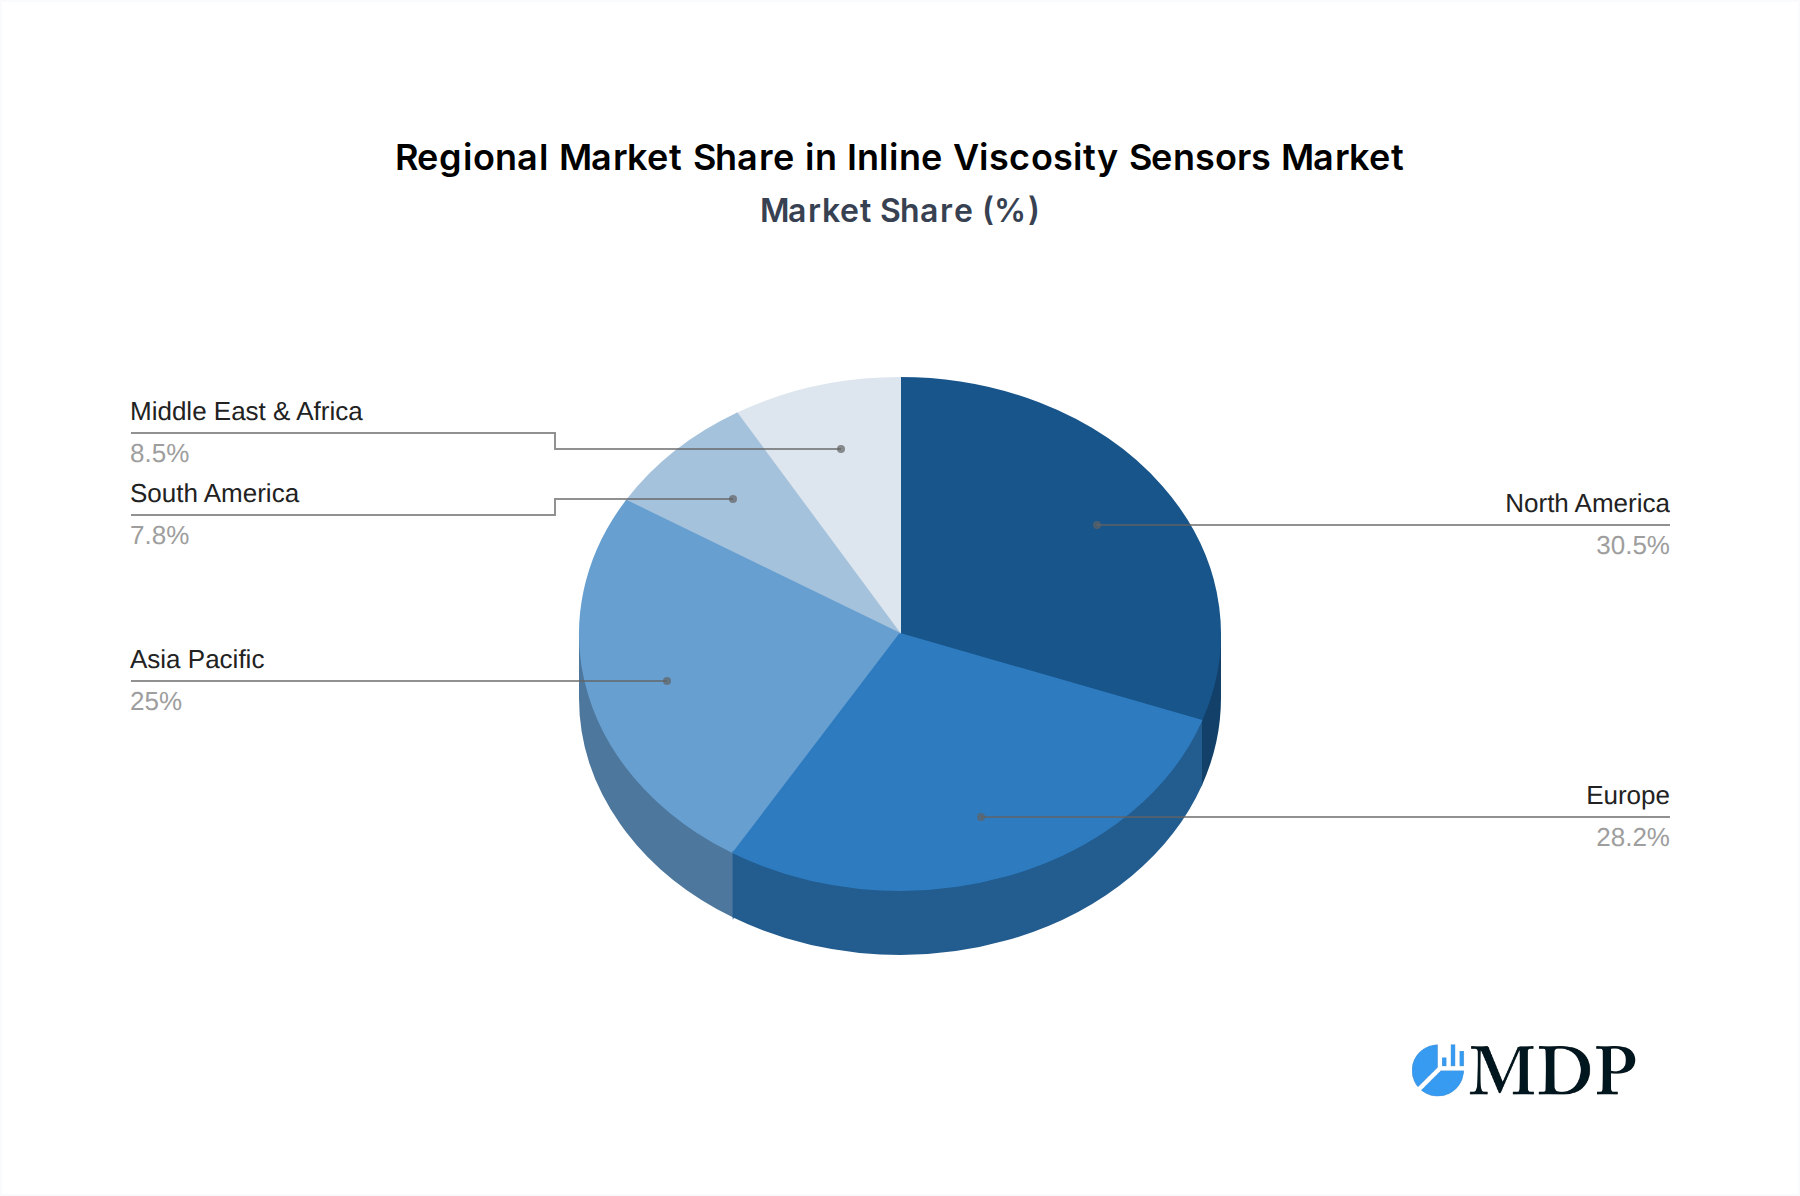
The market segmentation by application reveals a strong presence in both industrial and commercial sectors, with industrial applications leading the charge due to their critical reliance on continuous process monitoring. Within the "Type" segmentation, both low and high-temperature viscosity sensors are critical, catering to a wide spectrum of operational environments. Geographically, North America and Europe currently hold significant market shares, driven by advanced industrial infrastructure and a high adoption rate of sophisticated manufacturing technologies. However, the Asia Pacific region, particularly China and India, is emerging as a key growth engine, fueled by rapid industrialization and increasing investments in automation. Key players like Emerson Electric, Brookfield, and Parker are instrumental in driving innovation and expanding market reach through technological advancements and strategic collaborations.
Inline Viscosity Sensors Company Market Share
This in-depth report provides a definitive analysis of the global Inline Viscosity Sensors market, offering critical insights into market dynamics, industry trends, leading segments, and future growth prospects. Covering a comprehensive study period from 2019 to 2033, with a base year of 2025, this report is an indispensable resource for industry stakeholders seeking to understand and capitalize on the evolving landscape of inline viscosity measurement. We delve into market concentration, innovation drivers, regulatory frameworks, product substitutes, end-user trends, and mergers & acquisitions (M&A), alongside detailed analysis of market growth drivers, technological disruptions, consumer preferences, and competitive dynamics. Explore leading markets and segments within Industrial and Commercial applications, and Low Temperature and High Temperature types, identifying key drivers of growth, challenges, and emerging opportunities. This report also highlights product developments, key milestones, and the strategic outlook for this vital industrial sector.
Inline Viscosity Sensors Market Dynamics & Concentration
The global Inline Viscosity Sensors market exhibits a moderate concentration, with a few dominant players alongside a growing number of specialized manufacturers. The market share of leading companies like Brookfield, Parker, and Emerson Electric collectively accounts for approximately 55 million of the total market value. Innovation drivers are primarily centered on enhancing sensor accuracy, real-time data processing capabilities, and integration with Industry 4.0 platforms, leading to an estimated 25% increase in advanced sensor adoption over the forecast period. Regulatory frameworks, particularly concerning process control and quality assurance in sectors like pharmaceuticals and food & beverage, are becoming more stringent, pushing demand for certified and reliable inline viscosity solutions. Product substitutes, such as offline laboratory viscometers, are gradually losing ground as the efficiency and cost-effectiveness of inline measurement become more apparent, with a projected decline of 10% in the adoption of traditional offline methods by 2033. End-user trends are shifting towards demand for miniaturized, robust, and low-maintenance sensors capable of operating in harsh industrial environments, fueling innovation in materials science and sensor design. M&A activities are anticipated to remain steady, with an average of 5 significant deals projected annually, primarily focusing on acquiring niche technologies or expanding geographical reach.
Inline Viscosity Sensors Industry Trends & Analysis
The Inline Viscosity Sensors industry is poised for robust growth, driven by an escalating demand for precise process control and real-time quality monitoring across a multitude of industrial applications. The market is projected to expand at a Compound Annual Growth Rate (CAGR) of approximately 7.2% from 2025 to 2033, reaching an estimated market size of 2,300 million by the end of the forecast period. Technological disruptions are at the forefront, with advancements in microelectromechanical systems (MEMS) technology enabling the development of smaller, more energy-efficient, and cost-effective inline viscosity sensors. The increasing adoption of IoT and AI in industrial settings is further propelling the market, as these sensors provide critical data for predictive maintenance, process optimization, and automated quality control. Consumer preferences are increasingly leaning towards intelligent sensors that offer advanced diagnostics, remote monitoring capabilities, and seamless integration with existing control systems. This shift is compelling manufacturers to invest heavily in research and development, focusing on user-friendly interfaces and robust data analytics platforms. Competitive dynamics are intensifying, with established players like VAF Instruments, Martechnic GmbH, and AVENISENSE investing in product differentiation and expanding their service offerings to capture a larger market share. The market penetration of inline viscosity sensors in emerging economies is expected to witness significant growth, fueled by industrialization and a growing awareness of the benefits of automated process control. Furthermore, the development of specialized sensors for highly corrosive or high-temperature environments, addressed by companies like Cambridge Viscosity and Hydramotion, is opening up new application areas and driving market expansion. The demand for inline viscosity sensors in critical sectors such as petrochemicals, paints and coatings, and food and beverage processing is a primary growth driver. The trend towards digitalization and smart manufacturing is further amplifying the need for continuous, real-time viscosity measurements to ensure product consistency and optimize production efficiency. The ongoing development of novel sensing technologies, including optical and acoustic-based methods, promises to further enhance the capabilities and applicability of inline viscosity sensors, solidifying their importance in modern industrial processes. The increasing focus on sustainability and waste reduction in manufacturing processes also indirectly boosts the demand for inline viscosity sensors, as precise control over material properties can lead to reduced material waste and improved energy efficiency. The market is witnessing a steady influx of new product launches, each aiming to address specific industry challenges and enhance the overall value proposition of inline viscosity measurement solutions.
Leading Markets & Segments in Inline Viscosity Sensors
The Industrial application segment stands as the dominant force in the global Inline Viscosity Sensors market, accounting for an estimated 70% of the total market revenue in 2025. Within this segment, sectors like oil and gas, petrochemicals, and chemical manufacturing are key contributors, driven by stringent quality control requirements and the need for process optimization. The economic policies supporting industrial expansion and infrastructure development in regions like North America and Europe are significant drivers of this dominance. The Commercial application segment, while smaller, is experiencing robust growth, propelled by the increasing adoption of advanced process monitoring in sectors such as food and beverage, pharmaceuticals, and cosmetics.
Within the product types, High Temperature Inline Viscosity Sensors hold a substantial market share, estimated at 60%, owing to their critical role in processes operating at elevated temperatures, such as in refineries and polymer production. The technological advancements in materials science and sensor design have enabled these sensors to withstand extreme thermal conditions, thereby driving their widespread adoption. The Low Temperature Inline Viscosity Sensors segment, while currently holding a smaller share, is witnessing rapid growth, particularly in applications requiring precise viscosity control at sub-zero temperatures, such as in the food and beverage industry for ice cream production and in specialized chemical processes.
Key Drivers of Dominance in Leading Markets:
- North America & Europe:
- Presence of a mature industrial base with significant investments in advanced manufacturing technologies.
- Strict regulatory compliance mandates for product quality and safety across various industries.
- High adoption rates of automation and Industry 4.0 solutions.
- Strong R&D infrastructure supporting technological innovation.
- Asia-Pacific:
- Rapid industrialization and increasing manufacturing output, particularly in countries like China and India.
- Growing demand for efficient and reliable process control solutions to enhance competitiveness.
- Government initiatives promoting technological upgrades and smart manufacturing.
The detailed dominance analysis of these segments reveals a clear trend towards increased reliance on inline viscosity measurement for achieving operational excellence. The economic policies favoring technological adoption, coupled with the inherent advantages of real-time monitoring, are solidifying the leadership of these segments within the global Inline Viscosity Sensors market.
Inline Viscosity Sensors Product Developments
Product developments in the Inline Viscosity Sensors market are characterized by a strong emphasis on miniaturization, enhanced accuracy, and seamless integration with digital ecosystems. Companies like Marimex Industries Corp. and Sofraser are innovating with compact sensor designs that are easier to install in existing process lines and require minimal maintenance. The integration of advanced algorithms and machine learning capabilities allows these sensors to not only measure viscosity but also predict potential process deviations and offer proactive solutions. Competitive advantages are being forged through improved sensor materials that offer superior resistance to corrosion and extreme temperatures, expanding the applicability of these devices into previously inaccessible industrial environments. These technological advancements are directly addressing the growing demand for precise, real-time, and intelligent viscosity measurement solutions.
Key Drivers of Inline Viscosity Sensors Growth
The growth of the Inline Viscosity Sensors market is primarily propelled by several key factors. Technologically, the increasing demand for real-time process control and quality assurance in industries like pharmaceuticals, food & beverage, and petrochemicals is a significant driver. Economic factors, including industrial expansion in emerging economies and the push for operational efficiency and cost reduction, further bolster demand. Regulatory frameworks, particularly those mandating stringent quality standards and safety protocols, necessitate the use of reliable inline measurement tools. For instance, the automotive industry's increasing demand for consistent lubricant performance drives the need for inline viscosity monitoring during production. The burgeoning adoption of Industry 4.0 and the Industrial Internet of Things (IIoT) necessitates continuous data streams, which inline viscosity sensors efficiently provide for predictive maintenance and process optimization.
Challenges in the Inline Viscosity Sensors Market
Despite robust growth, the Inline Viscosity Sensors market faces certain challenges. Regulatory hurdles, particularly in developing regions, related to certification and standardization can slow down market penetration. Supply chain issues for specialized components and raw materials can lead to increased lead times and costs. Competitive pressures from both established players and new entrants can impact pricing strategies and profit margins. The initial capital investment for sophisticated inline sensor systems can be a barrier for smaller enterprises. Furthermore, the need for skilled personnel to install, calibrate, and maintain these advanced systems can pose a challenge in certain geographical areas, limiting wider adoption. The market also grapples with the diverse range of fluid properties, requiring highly specific sensor configurations for optimal performance, which can increase development and manufacturing complexity.
Emerging Opportunities in Inline Viscosity Sensors
Emerging opportunities in the Inline Viscosity Sensors market are primarily fueled by technological breakthroughs and strategic market expansion. The growing demand for smart manufacturing and Industry 4.0 adoption presents a significant catalyst, with inline sensors forming the backbone of real-time data collection for AI-driven process optimization. Strategic partnerships between sensor manufacturers and automation solution providers are creating integrated systems that offer enhanced value to end-users. Furthermore, the expansion into untapped markets, particularly in developing economies undergoing industrialization, offers substantial growth potential. The development of specialized sensors for niche applications, such as in biopharmaceutical manufacturing or advanced materials processing, represents another promising avenue for market players. The increasing focus on sustainability and circular economy principles is also creating opportunities for sensors that can precisely monitor recycled materials and optimize their processing.
Leading Players in the Inline Viscosity Sensors Sector
- Brookfield
- Parker
- VAF Instruments
- Martechnic GmbH
- AVENISENSE
- Cambridge Viscosity
- Marimex Industries Corp.
- Hydramotion
- Emerson Electric
- Rheology Solutions
- Sofraser
Key Milestones in Inline Viscosity Sensors Industry
- 2019: Launch of new ultra-low viscosity sensors with enhanced accuracy for pharmaceutical applications.
- 2020: Significant increase in demand for inline viscosity sensors in the food and beverage sector due to heightened quality control requirements.
- 2021: Introduction of wireless connectivity options for inline viscosity sensors, facilitating remote monitoring and IIoT integration.
- 2022: Acquisition of a specialized inline sensor technology company by a major automation solutions provider.
- 2023: Development of highly robust inline viscosity sensors capable of withstanding extreme pressures and corrosive environments.
- 2024: Increased focus on AI-powered predictive maintenance capabilities integrated into inline viscosity sensor systems.
- 2025 (Estimated): Anticipated widespread adoption of miniaturized MEMS-based inline viscosity sensors.
- 2026-2033 (Forecast): Continued innovation in sensor materials and data analytics, driving market growth and expanding application scope.
Strategic Outlook for Inline Viscosity Sensors Market
The strategic outlook for the Inline Viscosity Sensors market is exceptionally positive, driven by the relentless pursuit of operational efficiency and product quality across global industries. Growth accelerators include the ongoing digital transformation in manufacturing, the increasing adoption of Industry 4.0 principles, and the demand for precise process control in emerging sectors. The market is expected to witness a surge in demand for smart, connected sensors that offer advanced analytics and predictive capabilities. Strategic opportunities lie in expanding into high-growth emerging markets, fostering collaborations with automation and software providers to deliver integrated solutions, and continuous innovation in sensor technology to address evolving industrial challenges, particularly in areas like sustainable manufacturing and advanced materials.
Inline Viscosity Sensors Segmentation
-
1. Application
- 1.1. Industrial
- 1.2. Commercial
-
2. Type
- 2.1. Low Temperature
- 2.2. High Temperature
Inline Viscosity Sensors Segmentation By Geography
-
1. North America
- 1.1. United States
- 1.2. Canada
- 1.3. Mexico
-
2. South America
- 2.1. Brazil
- 2.2. Argentina
- 2.3. Rest of South America
-
3. Europe
- 3.1. United Kingdom
- 3.2. Germany
- 3.3. France
- 3.4. Italy
- 3.5. Spain
- 3.6. Russia
- 3.7. Benelux
- 3.8. Nordics
- 3.9. Rest of Europe
-
4. Middle East & Africa
- 4.1. Turkey
- 4.2. Israel
- 4.3. GCC
- 4.4. North Africa
- 4.5. South Africa
- 4.6. Rest of Middle East & Africa
-
5. Asia Pacific
- 5.1. China
- 5.2. India
- 5.3. Japan
- 5.4. South Korea
- 5.5. ASEAN
- 5.6. Oceania
- 5.7. Rest of Asia Pacific
Inline Viscosity Sensors Regional Market Share
Geographic Coverage of Inline Viscosity Sensors
Inline Viscosity Sensors REPORT HIGHLIGHTS
| Aspects | Details |
|---|---|
| Study Period | 2020-2034 |
| Base Year | 2025 |
| Estimated Year | 2026 |
| Forecast Period | 2026-2034 |
| Historical Period | 2020-2025 |
| Growth Rate | CAGR of 5.2% from 2020-2034 |
| Segmentation |
|
Table of Contents
- 1. Introduction
- 1.1. Research Scope
- 1.2. Market Segmentation
- 1.3. Research Methodology
- 1.4. Definitions and Assumptions
- 2. Executive Summary
- 2.1. Introduction
- 3. Market Dynamics
- 3.1. Introduction
- 3.2. Market Drivers
- 3.3. Market Restrains
- 3.4. Market Trends
- 4. Market Factor Analysis
- 4.1. Porters Five Forces
- 4.2. Supply/Value Chain
- 4.3. PESTEL analysis
- 4.4. Market Entropy
- 4.5. Patent/Trademark Analysis
- 5. Global Inline Viscosity Sensors Analysis, Insights and Forecast, 2020-2032
- 5.1. Market Analysis, Insights and Forecast - by Application
- 5.1.1. Industrial
- 5.1.2. Commercial
- 5.2. Market Analysis, Insights and Forecast - by Type
- 5.2.1. Low Temperature
- 5.2.2. High Temperature
- 5.3. Market Analysis, Insights and Forecast - by Region
- 5.3.1. North America
- 5.3.2. South America
- 5.3.3. Europe
- 5.3.4. Middle East & Africa
- 5.3.5. Asia Pacific
- 5.1. Market Analysis, Insights and Forecast - by Application
- 6. North America Inline Viscosity Sensors Analysis, Insights and Forecast, 2020-2032
- 6.1. Market Analysis, Insights and Forecast - by Application
- 6.1.1. Industrial
- 6.1.2. Commercial
- 6.2. Market Analysis, Insights and Forecast - by Type
- 6.2.1. Low Temperature
- 6.2.2. High Temperature
- 6.1. Market Analysis, Insights and Forecast - by Application
- 7. South America Inline Viscosity Sensors Analysis, Insights and Forecast, 2020-2032
- 7.1. Market Analysis, Insights and Forecast - by Application
- 7.1.1. Industrial
- 7.1.2. Commercial
- 7.2. Market Analysis, Insights and Forecast - by Type
- 7.2.1. Low Temperature
- 7.2.2. High Temperature
- 7.1. Market Analysis, Insights and Forecast - by Application
- 8. Europe Inline Viscosity Sensors Analysis, Insights and Forecast, 2020-2032
- 8.1. Market Analysis, Insights and Forecast - by Application
- 8.1.1. Industrial
- 8.1.2. Commercial
- 8.2. Market Analysis, Insights and Forecast - by Type
- 8.2.1. Low Temperature
- 8.2.2. High Temperature
- 8.1. Market Analysis, Insights and Forecast - by Application
- 9. Middle East & Africa Inline Viscosity Sensors Analysis, Insights and Forecast, 2020-2032
- 9.1. Market Analysis, Insights and Forecast - by Application
- 9.1.1. Industrial
- 9.1.2. Commercial
- 9.2. Market Analysis, Insights and Forecast - by Type
- 9.2.1. Low Temperature
- 9.2.2. High Temperature
- 9.1. Market Analysis, Insights and Forecast - by Application
- 10. Asia Pacific Inline Viscosity Sensors Analysis, Insights and Forecast, 2020-2032
- 10.1. Market Analysis, Insights and Forecast - by Application
- 10.1.1. Industrial
- 10.1.2. Commercial
- 10.2. Market Analysis, Insights and Forecast - by Type
- 10.2.1. Low Temperature
- 10.2.2. High Temperature
- 10.1. Market Analysis, Insights and Forecast - by Application
- 11. Competitive Analysis
- 11.1. Global Market Share Analysis 2025
- 11.2. Company Profiles
- 11.2.1 Brookfield
- 11.2.1.1. Overview
- 11.2.1.2. Products
- 11.2.1.3. SWOT Analysis
- 11.2.1.4. Recent Developments
- 11.2.1.5. Financials (Based on Availability)
- 11.2.2 Parker
- 11.2.2.1. Overview
- 11.2.2.2. Products
- 11.2.2.3. SWOT Analysis
- 11.2.2.4. Recent Developments
- 11.2.2.5. Financials (Based on Availability)
- 11.2.3 VAF Instruments
- 11.2.3.1. Overview
- 11.2.3.2. Products
- 11.2.3.3. SWOT Analysis
- 11.2.3.4. Recent Developments
- 11.2.3.5. Financials (Based on Availability)
- 11.2.4 Martechnic GmbH
- 11.2.4.1. Overview
- 11.2.4.2. Products
- 11.2.4.3. SWOT Analysis
- 11.2.4.4. Recent Developments
- 11.2.4.5. Financials (Based on Availability)
- 11.2.5 AVENISENSE
- 11.2.5.1. Overview
- 11.2.5.2. Products
- 11.2.5.3. SWOT Analysis
- 11.2.5.4. Recent Developments
- 11.2.5.5. Financials (Based on Availability)
- 11.2.6 Cambridge Viscosity
- 11.2.6.1. Overview
- 11.2.6.2. Products
- 11.2.6.3. SWOT Analysis
- 11.2.6.4. Recent Developments
- 11.2.6.5. Financials (Based on Availability)
- 11.2.7 Marimex Industries Corp.
- 11.2.7.1. Overview
- 11.2.7.2. Products
- 11.2.7.3. SWOT Analysis
- 11.2.7.4. Recent Developments
- 11.2.7.5. Financials (Based on Availability)
- 11.2.8 Hydramotion
- 11.2.8.1. Overview
- 11.2.8.2. Products
- 11.2.8.3. SWOT Analysis
- 11.2.8.4. Recent Developments
- 11.2.8.5. Financials (Based on Availability)
- 11.2.9 Emerson Electric
- 11.2.9.1. Overview
- 11.2.9.2. Products
- 11.2.9.3. SWOT Analysis
- 11.2.9.4. Recent Developments
- 11.2.9.5. Financials (Based on Availability)
- 11.2.10 Rheology Solutions
- 11.2.10.1. Overview
- 11.2.10.2. Products
- 11.2.10.3. SWOT Analysis
- 11.2.10.4. Recent Developments
- 11.2.10.5. Financials (Based on Availability)
- 11.2.11 Sofraser
- 11.2.11.1. Overview
- 11.2.11.2. Products
- 11.2.11.3. SWOT Analysis
- 11.2.11.4. Recent Developments
- 11.2.11.5. Financials (Based on Availability)
- 11.2.1 Brookfield
List of Figures
- Figure 1: Global Inline Viscosity Sensors Revenue Breakdown (million, %) by Region 2025 & 2033
- Figure 2: Global Inline Viscosity Sensors Volume Breakdown (K, %) by Region 2025 & 2033
- Figure 3: North America Inline Viscosity Sensors Revenue (million), by Application 2025 & 2033
- Figure 4: North America Inline Viscosity Sensors Volume (K), by Application 2025 & 2033
- Figure 5: North America Inline Viscosity Sensors Revenue Share (%), by Application 2025 & 2033
- Figure 6: North America Inline Viscosity Sensors Volume Share (%), by Application 2025 & 2033
- Figure 7: North America Inline Viscosity Sensors Revenue (million), by Type 2025 & 2033
- Figure 8: North America Inline Viscosity Sensors Volume (K), by Type 2025 & 2033
- Figure 9: North America Inline Viscosity Sensors Revenue Share (%), by Type 2025 & 2033
- Figure 10: North America Inline Viscosity Sensors Volume Share (%), by Type 2025 & 2033
- Figure 11: North America Inline Viscosity Sensors Revenue (million), by Country 2025 & 2033
- Figure 12: North America Inline Viscosity Sensors Volume (K), by Country 2025 & 2033
- Figure 13: North America Inline Viscosity Sensors Revenue Share (%), by Country 2025 & 2033
- Figure 14: North America Inline Viscosity Sensors Volume Share (%), by Country 2025 & 2033
- Figure 15: South America Inline Viscosity Sensors Revenue (million), by Application 2025 & 2033
- Figure 16: South America Inline Viscosity Sensors Volume (K), by Application 2025 & 2033
- Figure 17: South America Inline Viscosity Sensors Revenue Share (%), by Application 2025 & 2033
- Figure 18: South America Inline Viscosity Sensors Volume Share (%), by Application 2025 & 2033
- Figure 19: South America Inline Viscosity Sensors Revenue (million), by Type 2025 & 2033
- Figure 20: South America Inline Viscosity Sensors Volume (K), by Type 2025 & 2033
- Figure 21: South America Inline Viscosity Sensors Revenue Share (%), by Type 2025 & 2033
- Figure 22: South America Inline Viscosity Sensors Volume Share (%), by Type 2025 & 2033
- Figure 23: South America Inline Viscosity Sensors Revenue (million), by Country 2025 & 2033
- Figure 24: South America Inline Viscosity Sensors Volume (K), by Country 2025 & 2033
- Figure 25: South America Inline Viscosity Sensors Revenue Share (%), by Country 2025 & 2033
- Figure 26: South America Inline Viscosity Sensors Volume Share (%), by Country 2025 & 2033
- Figure 27: Europe Inline Viscosity Sensors Revenue (million), by Application 2025 & 2033
- Figure 28: Europe Inline Viscosity Sensors Volume (K), by Application 2025 & 2033
- Figure 29: Europe Inline Viscosity Sensors Revenue Share (%), by Application 2025 & 2033
- Figure 30: Europe Inline Viscosity Sensors Volume Share (%), by Application 2025 & 2033
- Figure 31: Europe Inline Viscosity Sensors Revenue (million), by Type 2025 & 2033
- Figure 32: Europe Inline Viscosity Sensors Volume (K), by Type 2025 & 2033
- Figure 33: Europe Inline Viscosity Sensors Revenue Share (%), by Type 2025 & 2033
- Figure 34: Europe Inline Viscosity Sensors Volume Share (%), by Type 2025 & 2033
- Figure 35: Europe Inline Viscosity Sensors Revenue (million), by Country 2025 & 2033
- Figure 36: Europe Inline Viscosity Sensors Volume (K), by Country 2025 & 2033
- Figure 37: Europe Inline Viscosity Sensors Revenue Share (%), by Country 2025 & 2033
- Figure 38: Europe Inline Viscosity Sensors Volume Share (%), by Country 2025 & 2033
- Figure 39: Middle East & Africa Inline Viscosity Sensors Revenue (million), by Application 2025 & 2033
- Figure 40: Middle East & Africa Inline Viscosity Sensors Volume (K), by Application 2025 & 2033
- Figure 41: Middle East & Africa Inline Viscosity Sensors Revenue Share (%), by Application 2025 & 2033
- Figure 42: Middle East & Africa Inline Viscosity Sensors Volume Share (%), by Application 2025 & 2033
- Figure 43: Middle East & Africa Inline Viscosity Sensors Revenue (million), by Type 2025 & 2033
- Figure 44: Middle East & Africa Inline Viscosity Sensors Volume (K), by Type 2025 & 2033
- Figure 45: Middle East & Africa Inline Viscosity Sensors Revenue Share (%), by Type 2025 & 2033
- Figure 46: Middle East & Africa Inline Viscosity Sensors Volume Share (%), by Type 2025 & 2033
- Figure 47: Middle East & Africa Inline Viscosity Sensors Revenue (million), by Country 2025 & 2033
- Figure 48: Middle East & Africa Inline Viscosity Sensors Volume (K), by Country 2025 & 2033
- Figure 49: Middle East & Africa Inline Viscosity Sensors Revenue Share (%), by Country 2025 & 2033
- Figure 50: Middle East & Africa Inline Viscosity Sensors Volume Share (%), by Country 2025 & 2033
- Figure 51: Asia Pacific Inline Viscosity Sensors Revenue (million), by Application 2025 & 2033
- Figure 52: Asia Pacific Inline Viscosity Sensors Volume (K), by Application 2025 & 2033
- Figure 53: Asia Pacific Inline Viscosity Sensors Revenue Share (%), by Application 2025 & 2033
- Figure 54: Asia Pacific Inline Viscosity Sensors Volume Share (%), by Application 2025 & 2033
- Figure 55: Asia Pacific Inline Viscosity Sensors Revenue (million), by Type 2025 & 2033
- Figure 56: Asia Pacific Inline Viscosity Sensors Volume (K), by Type 2025 & 2033
- Figure 57: Asia Pacific Inline Viscosity Sensors Revenue Share (%), by Type 2025 & 2033
- Figure 58: Asia Pacific Inline Viscosity Sensors Volume Share (%), by Type 2025 & 2033
- Figure 59: Asia Pacific Inline Viscosity Sensors Revenue (million), by Country 2025 & 2033
- Figure 60: Asia Pacific Inline Viscosity Sensors Volume (K), by Country 2025 & 2033
- Figure 61: Asia Pacific Inline Viscosity Sensors Revenue Share (%), by Country 2025 & 2033
- Figure 62: Asia Pacific Inline Viscosity Sensors Volume Share (%), by Country 2025 & 2033
List of Tables
- Table 1: Global Inline Viscosity Sensors Revenue million Forecast, by Application 2020 & 2033
- Table 2: Global Inline Viscosity Sensors Volume K Forecast, by Application 2020 & 2033
- Table 3: Global Inline Viscosity Sensors Revenue million Forecast, by Type 2020 & 2033
- Table 4: Global Inline Viscosity Sensors Volume K Forecast, by Type 2020 & 2033
- Table 5: Global Inline Viscosity Sensors Revenue million Forecast, by Region 2020 & 2033
- Table 6: Global Inline Viscosity Sensors Volume K Forecast, by Region 2020 & 2033
- Table 7: Global Inline Viscosity Sensors Revenue million Forecast, by Application 2020 & 2033
- Table 8: Global Inline Viscosity Sensors Volume K Forecast, by Application 2020 & 2033
- Table 9: Global Inline Viscosity Sensors Revenue million Forecast, by Type 2020 & 2033
- Table 10: Global Inline Viscosity Sensors Volume K Forecast, by Type 2020 & 2033
- Table 11: Global Inline Viscosity Sensors Revenue million Forecast, by Country 2020 & 2033
- Table 12: Global Inline Viscosity Sensors Volume K Forecast, by Country 2020 & 2033
- Table 13: United States Inline Viscosity Sensors Revenue (million) Forecast, by Application 2020 & 2033
- Table 14: United States Inline Viscosity Sensors Volume (K) Forecast, by Application 2020 & 2033
- Table 15: Canada Inline Viscosity Sensors Revenue (million) Forecast, by Application 2020 & 2033
- Table 16: Canada Inline Viscosity Sensors Volume (K) Forecast, by Application 2020 & 2033
- Table 17: Mexico Inline Viscosity Sensors Revenue (million) Forecast, by Application 2020 & 2033
- Table 18: Mexico Inline Viscosity Sensors Volume (K) Forecast, by Application 2020 & 2033
- Table 19: Global Inline Viscosity Sensors Revenue million Forecast, by Application 2020 & 2033
- Table 20: Global Inline Viscosity Sensors Volume K Forecast, by Application 2020 & 2033
- Table 21: Global Inline Viscosity Sensors Revenue million Forecast, by Type 2020 & 2033
- Table 22: Global Inline Viscosity Sensors Volume K Forecast, by Type 2020 & 2033
- Table 23: Global Inline Viscosity Sensors Revenue million Forecast, by Country 2020 & 2033
- Table 24: Global Inline Viscosity Sensors Volume K Forecast, by Country 2020 & 2033
- Table 25: Brazil Inline Viscosity Sensors Revenue (million) Forecast, by Application 2020 & 2033
- Table 26: Brazil Inline Viscosity Sensors Volume (K) Forecast, by Application 2020 & 2033
- Table 27: Argentina Inline Viscosity Sensors Revenue (million) Forecast, by Application 2020 & 2033
- Table 28: Argentina Inline Viscosity Sensors Volume (K) Forecast, by Application 2020 & 2033
- Table 29: Rest of South America Inline Viscosity Sensors Revenue (million) Forecast, by Application 2020 & 2033
- Table 30: Rest of South America Inline Viscosity Sensors Volume (K) Forecast, by Application 2020 & 2033
- Table 31: Global Inline Viscosity Sensors Revenue million Forecast, by Application 2020 & 2033
- Table 32: Global Inline Viscosity Sensors Volume K Forecast, by Application 2020 & 2033
- Table 33: Global Inline Viscosity Sensors Revenue million Forecast, by Type 2020 & 2033
- Table 34: Global Inline Viscosity Sensors Volume K Forecast, by Type 2020 & 2033
- Table 35: Global Inline Viscosity Sensors Revenue million Forecast, by Country 2020 & 2033
- Table 36: Global Inline Viscosity Sensors Volume K Forecast, by Country 2020 & 2033
- Table 37: United Kingdom Inline Viscosity Sensors Revenue (million) Forecast, by Application 2020 & 2033
- Table 38: United Kingdom Inline Viscosity Sensors Volume (K) Forecast, by Application 2020 & 2033
- Table 39: Germany Inline Viscosity Sensors Revenue (million) Forecast, by Application 2020 & 2033
- Table 40: Germany Inline Viscosity Sensors Volume (K) Forecast, by Application 2020 & 2033
- Table 41: France Inline Viscosity Sensors Revenue (million) Forecast, by Application 2020 & 2033
- Table 42: France Inline Viscosity Sensors Volume (K) Forecast, by Application 2020 & 2033
- Table 43: Italy Inline Viscosity Sensors Revenue (million) Forecast, by Application 2020 & 2033
- Table 44: Italy Inline Viscosity Sensors Volume (K) Forecast, by Application 2020 & 2033
- Table 45: Spain Inline Viscosity Sensors Revenue (million) Forecast, by Application 2020 & 2033
- Table 46: Spain Inline Viscosity Sensors Volume (K) Forecast, by Application 2020 & 2033
- Table 47: Russia Inline Viscosity Sensors Revenue (million) Forecast, by Application 2020 & 2033
- Table 48: Russia Inline Viscosity Sensors Volume (K) Forecast, by Application 2020 & 2033
- Table 49: Benelux Inline Viscosity Sensors Revenue (million) Forecast, by Application 2020 & 2033
- Table 50: Benelux Inline Viscosity Sensors Volume (K) Forecast, by Application 2020 & 2033
- Table 51: Nordics Inline Viscosity Sensors Revenue (million) Forecast, by Application 2020 & 2033
- Table 52: Nordics Inline Viscosity Sensors Volume (K) Forecast, by Application 2020 & 2033
- Table 53: Rest of Europe Inline Viscosity Sensors Revenue (million) Forecast, by Application 2020 & 2033
- Table 54: Rest of Europe Inline Viscosity Sensors Volume (K) Forecast, by Application 2020 & 2033
- Table 55: Global Inline Viscosity Sensors Revenue million Forecast, by Application 2020 & 2033
- Table 56: Global Inline Viscosity Sensors Volume K Forecast, by Application 2020 & 2033
- Table 57: Global Inline Viscosity Sensors Revenue million Forecast, by Type 2020 & 2033
- Table 58: Global Inline Viscosity Sensors Volume K Forecast, by Type 2020 & 2033
- Table 59: Global Inline Viscosity Sensors Revenue million Forecast, by Country 2020 & 2033
- Table 60: Global Inline Viscosity Sensors Volume K Forecast, by Country 2020 & 2033
- Table 61: Turkey Inline Viscosity Sensors Revenue (million) Forecast, by Application 2020 & 2033
- Table 62: Turkey Inline Viscosity Sensors Volume (K) Forecast, by Application 2020 & 2033
- Table 63: Israel Inline Viscosity Sensors Revenue (million) Forecast, by Application 2020 & 2033
- Table 64: Israel Inline Viscosity Sensors Volume (K) Forecast, by Application 2020 & 2033
- Table 65: GCC Inline Viscosity Sensors Revenue (million) Forecast, by Application 2020 & 2033
- Table 66: GCC Inline Viscosity Sensors Volume (K) Forecast, by Application 2020 & 2033
- Table 67: North Africa Inline Viscosity Sensors Revenue (million) Forecast, by Application 2020 & 2033
- Table 68: North Africa Inline Viscosity Sensors Volume (K) Forecast, by Application 2020 & 2033
- Table 69: South Africa Inline Viscosity Sensors Revenue (million) Forecast, by Application 2020 & 2033
- Table 70: South Africa Inline Viscosity Sensors Volume (K) Forecast, by Application 2020 & 2033
- Table 71: Rest of Middle East & Africa Inline Viscosity Sensors Revenue (million) Forecast, by Application 2020 & 2033
- Table 72: Rest of Middle East & Africa Inline Viscosity Sensors Volume (K) Forecast, by Application 2020 & 2033
- Table 73: Global Inline Viscosity Sensors Revenue million Forecast, by Application 2020 & 2033
- Table 74: Global Inline Viscosity Sensors Volume K Forecast, by Application 2020 & 2033
- Table 75: Global Inline Viscosity Sensors Revenue million Forecast, by Type 2020 & 2033
- Table 76: Global Inline Viscosity Sensors Volume K Forecast, by Type 2020 & 2033
- Table 77: Global Inline Viscosity Sensors Revenue million Forecast, by Country 2020 & 2033
- Table 78: Global Inline Viscosity Sensors Volume K Forecast, by Country 2020 & 2033
- Table 79: China Inline Viscosity Sensors Revenue (million) Forecast, by Application 2020 & 2033
- Table 80: China Inline Viscosity Sensors Volume (K) Forecast, by Application 2020 & 2033
- Table 81: India Inline Viscosity Sensors Revenue (million) Forecast, by Application 2020 & 2033
- Table 82: India Inline Viscosity Sensors Volume (K) Forecast, by Application 2020 & 2033
- Table 83: Japan Inline Viscosity Sensors Revenue (million) Forecast, by Application 2020 & 2033
- Table 84: Japan Inline Viscosity Sensors Volume (K) Forecast, by Application 2020 & 2033
- Table 85: South Korea Inline Viscosity Sensors Revenue (million) Forecast, by Application 2020 & 2033
- Table 86: South Korea Inline Viscosity Sensors Volume (K) Forecast, by Application 2020 & 2033
- Table 87: ASEAN Inline Viscosity Sensors Revenue (million) Forecast, by Application 2020 & 2033
- Table 88: ASEAN Inline Viscosity Sensors Volume (K) Forecast, by Application 2020 & 2033
- Table 89: Oceania Inline Viscosity Sensors Revenue (million) Forecast, by Application 2020 & 2033
- Table 90: Oceania Inline Viscosity Sensors Volume (K) Forecast, by Application 2020 & 2033
- Table 91: Rest of Asia Pacific Inline Viscosity Sensors Revenue (million) Forecast, by Application 2020 & 2033
- Table 92: Rest of Asia Pacific Inline Viscosity Sensors Volume (K) Forecast, by Application 2020 & 2033
Frequently Asked Questions
1. What is the projected Compound Annual Growth Rate (CAGR) of the Inline Viscosity Sensors?
The projected CAGR is approximately 5.2%.
2. Which companies are prominent players in the Inline Viscosity Sensors?
Key companies in the market include Brookfield, Parker, VAF Instruments, Martechnic GmbH, AVENISENSE, Cambridge Viscosity, Marimex Industries Corp., Hydramotion, Emerson Electric, Rheology Solutions, Sofraser.
3. What are the main segments of the Inline Viscosity Sensors?
The market segments include Application, Type.
4. Can you provide details about the market size?
The market size is estimated to be USD 157.28 million as of 2022.
5. What are some drivers contributing to market growth?
N/A
6. What are the notable trends driving market growth?
N/A
7. Are there any restraints impacting market growth?
N/A
8. Can you provide examples of recent developments in the market?
N/A
9. What pricing options are available for accessing the report?
Pricing options include single-user, multi-user, and enterprise licenses priced at USD 3950.00, USD 5925.00, and USD 7900.00 respectively.
10. Is the market size provided in terms of value or volume?
The market size is provided in terms of value, measured in million and volume, measured in K.
11. Are there any specific market keywords associated with the report?
Yes, the market keyword associated with the report is "Inline Viscosity Sensors," which aids in identifying and referencing the specific market segment covered.
12. How do I determine which pricing option suits my needs best?
The pricing options vary based on user requirements and access needs. Individual users may opt for single-user licenses, while businesses requiring broader access may choose multi-user or enterprise licenses for cost-effective access to the report.
13. Are there any additional resources or data provided in the Inline Viscosity Sensors report?
While the report offers comprehensive insights, it's advisable to review the specific contents or supplementary materials provided to ascertain if additional resources or data are available.
14. How can I stay updated on further developments or reports in the Inline Viscosity Sensors?
To stay informed about further developments, trends, and reports in the Inline Viscosity Sensors, consider subscribing to industry newsletters, following relevant companies and organizations, or regularly checking reputable industry news sources and publications.
Methodology
Step 1 - Identification of Relevant Samples Size from Population Database


Step 2 - Approaches for Defining Global Market Size (Value, Volume* & Price*)

Note*: In applicable scenarios
Step 3 - Data Sources
Primary Research
- Web Analytics
- Survey Reports
- Research Institute
- Latest Research Reports
- Opinion Leaders
Secondary Research
- Annual Reports
- White Paper
- Latest Press Release
- Industry Association
- Paid Database
- Investor Presentations

Step 4 - Data Triangulation
Involves using different sources of information in order to increase the validity of a study
These sources are likely to be stakeholders in a program - participants, other researchers, program staff, other community members, and so on.
Then we put all data in single framework & apply various statistical tools to find out the dynamic on the market.
During the analysis stage, feedback from the stakeholder groups would be compared to determine areas of agreement as well as areas of divergence