

Key Insights
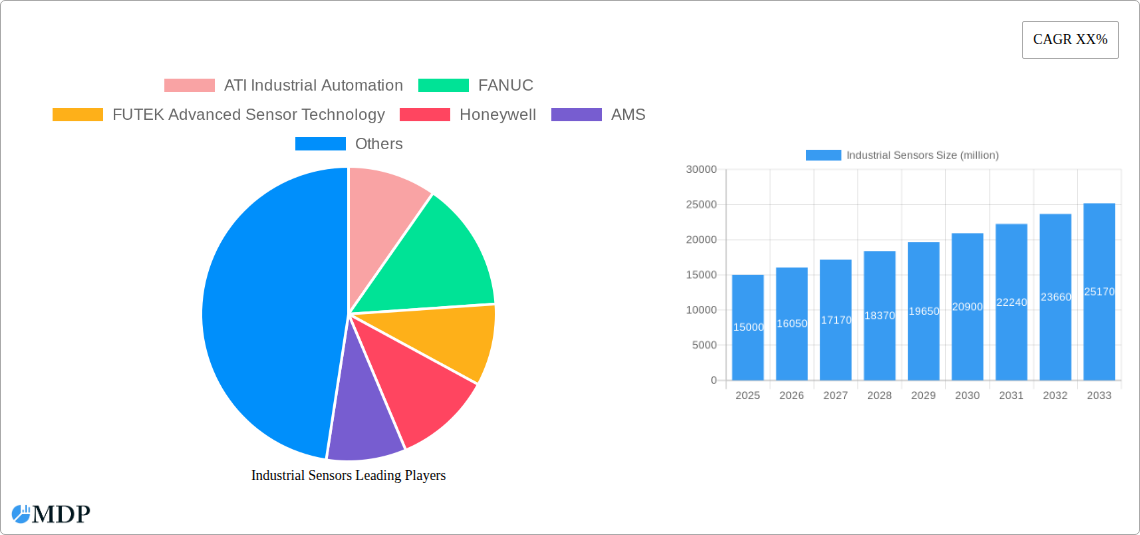
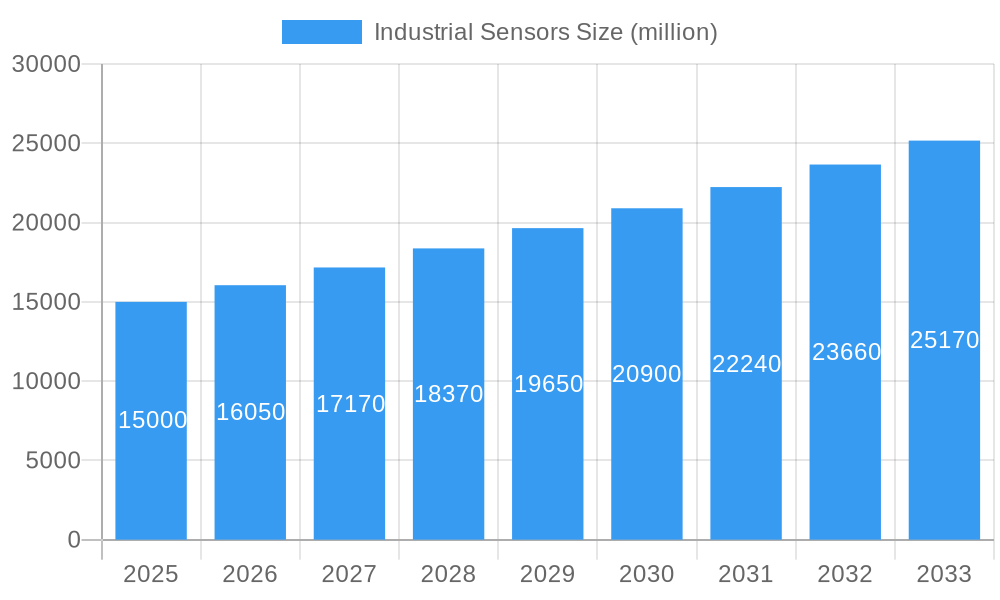
The industrial sensors market is experiencing robust growth, driven by the increasing automation in manufacturing, the rising adoption of Industry 4.0 technologies, and the growing demand for improved process efficiency and product quality. The market, currently estimated at $15 billion in 2025, is projected to expand significantly over the next decade, with a Compound Annual Growth Rate (CAGR) of 7%. This growth is fueled by several key factors, including the integration of advanced sensors in robotics and automation systems, the increasing use of data analytics for predictive maintenance, and the rising demand for sophisticated sensor technologies in various industrial sectors like automotive, electronics, and energy. Major players such as ATI Industrial Automation, FANUC, and Honeywell are driving innovation through the development of cutting-edge sensor technologies with enhanced accuracy, reliability, and connectivity. Furthermore, the ongoing trend toward miniaturization and the integration of sensor functionalities into other industrial equipment contribute to the market's expansion.
Industrial Sensors Market Size (In Billion)
However, several restraints are expected to impact market growth. The high initial investment required for sensor implementation and integration can be a barrier for some businesses, particularly smaller enterprises. Furthermore, the complexity of integrating different sensor technologies into existing infrastructure and the need for skilled personnel to manage and analyze the vast amount of data generated can pose challenges. Nevertheless, the long-term benefits of improved efficiency, reduced downtime, and enhanced product quality outweigh these limitations, making the adoption of industrial sensors a strategic imperative for many industrial players. The market segmentation will continue to evolve, with greater specialization in sensor types (e.g., proximity sensors, vision sensors, pressure sensors) and application areas. The regional market will see continued growth across North America, Europe, and Asia-Pacific, reflecting the high concentration of manufacturing activities and technological advancements in these regions.
Industrial Sensors Company Market Share
Industrial Sensors Market Report: A Comprehensive Analysis (2019-2033)
Unlocking the potential of the multi-billion dollar Industrial Sensors market with this in-depth analysis, projecting a market value of $xx billion by 2033. This comprehensive report offers actionable insights into market dynamics, technological advancements, leading players, and future growth opportunities within the Industrial Sensors sector. The study period covers 2019-2033, with a base year of 2025 and a forecast period of 2025-2033. This report is essential for industry stakeholders, investors, and businesses seeking a competitive edge in this rapidly evolving landscape.
Industrial Sensors Market Dynamics & Concentration
This section delves into the competitive landscape of the Industrial Sensors market, analyzing market concentration, innovation drivers, regulatory influences, and key industry activities. The market exhibits a moderately concentrated structure, with the top 5 players commanding an estimated xx% market share in 2025.
- Market Concentration: The Herfindahl-Hirschman Index (HHI) is estimated at xx in 2025, indicating a moderately concentrated market.
- Innovation Drivers: Technological advancements such as AI, IoT, and miniaturization are key drivers of innovation. The development of advanced sensor technologies, like smart sensors and MEMS, continues to fuel market expansion.
- Regulatory Frameworks: Stringent safety and environmental regulations across various industries are influencing the adoption of advanced and reliable sensors. Compliance costs and standards vary across regions, creating a complex regulatory environment.
- Product Substitutes: While few direct substitutes exist, technological advancements are leading to the emergence of alternative solutions offering similar functionalities at varying price points.
- End-User Trends: The increasing automation across manufacturing, automotive, and healthcare industries is driving the growth in sensor demand. The need for improved process efficiency and data-driven decision-making significantly influences end-user preferences.
- M&A Activities: The number of mergers and acquisitions (M&A) in the Industrial Sensors sector witnessed a notable increase in the historical period (2019-2024), with approximately xx deals recorded. These activities reflect the consolidation trend within the industry and the quest for technological advancements and market expansion.
Industrial Sensors Industry Trends & Analysis
This section provides a detailed analysis of the Industrial Sensors market trends, focusing on growth drivers, technological disruptions, consumer preferences, and competitive dynamics. The market exhibits a robust CAGR of xx% during the forecast period (2025-2033), driven by technological advancements and increasing demand from various industrial sectors.
Market penetration for advanced sensor technologies, like LiDAR and vision sensors, is expected to reach xx% by 2033. Technological disruptions, including the proliferation of 5G and advancements in AI, are creating new opportunities. The trend toward Industry 4.0 and smart factories is substantially impacting market growth. Competitive dynamics are characterized by fierce competition among established players and the emergence of new entrants with innovative technologies. The preference for high-performance, cost-effective, and reliable sensors is shaping the market trajectory.
Leading Markets & Segments in Industrial Sensors
The Asia-Pacific region is expected to dominate the Industrial Sensors market throughout the forecast period. China and Japan are projected as the key contributors to regional growth due to their robust manufacturing sectors and government investments in automation.
- Key Drivers for Asia-Pacific Dominance:
- Rapid industrialization and automation initiatives
- Government support for technological advancements
- Expanding automotive and electronics manufacturing sectors
- Favorable economic policies promoting technological innovation
The dominance of the Asia-Pacific region stems from factors such as rapid industrialization, favorable government policies, and a large consumer base. This region's growth significantly influences the overall global market performance. North America and Europe also present substantial opportunities, driven by automation trends and increasing regulatory mandates.
Industrial Sensors Product Developments
Recent years have witnessed significant advancements in Industrial Sensors, focusing on miniaturization, enhanced accuracy, and improved connectivity. The emergence of smart sensors with integrated processing capabilities is revolutionizing data acquisition and analysis. These developments are enhancing efficiency, improving safety, and enabling predictive maintenance across various industries. The integration of AI and machine learning is leading to the development of more intelligent sensors capable of real-time decision-making, impacting various applications in robotics, process automation, and manufacturing.
Key Drivers of Industrial Sensors Growth
The Industrial Sensors market's growth is driven by several interconnected factors.
- Technological advancements: Miniaturization, improved accuracy, and the incorporation of AI and IoT are propelling innovation.
- Economic factors: Increasing automation in manufacturing and other industries is driving demand. The need for enhanced productivity and efficiency is a significant contributing factor.
- Regulatory factors: Stringent safety and environmental regulations necessitate the use of reliable and advanced sensors.
Challenges in the Industrial Sensors Market
Several factors pose challenges to the Industrial Sensors market.
- High initial investment costs: Implementing advanced sensor technologies requires substantial upfront investments.
- Supply chain disruptions: Global supply chain complexities can impact sensor availability and cost. The global chip shortage, for example, affected various industries.
- Cybersecurity concerns: The interconnected nature of sensors raises concerns about data security and potential cyberattacks. This necessitates robust security measures.
Emerging Opportunities in Industrial Sensors
The long-term growth of the Industrial Sensors market is driven by several promising opportunities.
Technological breakthroughs in areas such as nanotechnology and quantum sensing promise to unlock new functionalities and applications. Strategic partnerships between sensor manufacturers and technology companies are accelerating innovation. Expanding market penetration into emerging economies presents significant opportunities for growth.
Leading Players in the Industrial Sensors Sector
Key Milestones in Industrial Sensors Industry
- 2020: Increased adoption of IoT-enabled sensors across various industries.
- 2021: Significant advancements in sensor miniaturization and power efficiency.
- 2022: Launch of several AI-powered industrial sensors.
- 2023: Several strategic partnerships among sensor manufacturers and technology firms.
- 2024: Increased investment in research and development of next-generation sensors.
Strategic Outlook for Industrial Sensors Market
The Industrial Sensors market presents a compelling investment opportunity, driven by long-term growth prospects across various sectors. Strategic partnerships, technological innovation, and expansion into new markets will be vital for companies seeking to capitalize on this growth. The market's future success hinges on the continuous development of intelligent, reliable, and cost-effective sensors that meet the evolving needs of industries.
Industrial Sensors Segmentation
-
1. Application
- 1.1. Energy & Power
- 1.2. Oil & Gas
- 1.3. Mining
- 1.4. Chemical
- 1.5. Manufacturing
- 1.6. Others
-
2. Types
- 2.1. Level Sensor
- 2.2. Temperature Sensor
- 2.3. Flow Sensor
- 2.4. Position Sensor
- 2.5. Pressure Sensor
- 2.6. Others
Industrial Sensors Segmentation By Geography
-
1. North America
- 1.1. United States
- 1.2. Canada
- 1.3. Mexico
-
2. South America
- 2.1. Brazil
- 2.2. Argentina
- 2.3. Rest of South America
-
3. Europe
- 3.1. United Kingdom
- 3.2. Germany
- 3.3. France
- 3.4. Italy
- 3.5. Spain
- 3.6. Russia
- 3.7. Benelux
- 3.8. Nordics
- 3.9. Rest of Europe
-
4. Middle East & Africa
- 4.1. Turkey
- 4.2. Israel
- 4.3. GCC
- 4.4. North Africa
- 4.5. South Africa
- 4.6. Rest of Middle East & Africa
-
5. Asia Pacific
- 5.1. China
- 5.2. India
- 5.3. Japan
- 5.4. South Korea
- 5.5. ASEAN
- 5.6. Oceania
- 5.7. Rest of Asia Pacific

Industrial Sensors Regional Market Share
Geographic Coverage of Industrial Sensors
Industrial Sensors REPORT HIGHLIGHTS
| Aspects | Details |
|---|---|
| Study Period | 2020-2034 |
| Base Year | 2025 |
| Estimated Year | 2026 |
| Forecast Period | 2026-2034 |
| Historical Period | 2020-2025 |
| Growth Rate | CAGR of XX% from 2020-2034 |
| Segmentation |
|
Table of Contents
- 1. Introduction
- 1.1. Research Scope
- 1.2. Market Segmentation
- 1.3. Research Objective
- 1.4. Definitions and Assumptions
- 2. Executive Summary
- 2.1. Market Snapshot
- 3. Market Dynamics
- 3.1. Market Drivers
- 3.2. Market Restrains
- 3.3. Market Trends
- 3.4. Market Opportunities
- 4. Market Factor Analysis
- 4.1. Porters Five Forces
- 4.1.1. Bargaining Power of Suppliers
- 4.1.2. Bargaining Power of Buyers
- 4.1.3. Threat of New Entrants
- 4.1.4. Threat of Substitutes
- 4.1.5. Competitive Rivalry
- 4.2. PESTEL analysis
- 4.3. BCG Analysis
- 4.3.1. Stars (High Growth, High Market Share)
- 4.3.2. Cash Cows (Low Growth, High Market Share)
- 4.3.3. Question Mark (High Growth, Low Market Share)
- 4.3.4. Dogs (Low Growth, Low Market Share)
- 4.4. Ansoff Matrix Analysis
- 4.5. Supply Chain Analysis
- 4.6. Regulatory Landscape
- 4.7. Current Market Potential and Opportunity Assessment (TAM–SAM–SOM Framework)
- 4.8. MDP Analyst Note
- 4.1. Porters Five Forces
- 5. Market Analysis, Insights and Forecast 2021-2033
- 5.1. Market Analysis, Insights and Forecast - by Application
- 5.1.1. Energy & Power
- 5.1.2. Oil & Gas
- 5.1.3. Mining
- 5.1.4. Chemical
- 5.1.5. Manufacturing
- 5.1.6. Others
- 5.2. Market Analysis, Insights and Forecast - by Types
- 5.2.1. Level Sensor
- 5.2.2. Temperature Sensor
- 5.2.3. Flow Sensor
- 5.2.4. Position Sensor
- 5.2.5. Pressure Sensor
- 5.2.6. Others
- 5.3. Market Analysis, Insights and Forecast - by Region
- 5.3.1. North America
- 5.3.2. South America
- 5.3.3. Europe
- 5.3.4. Middle East & Africa
- 5.3.5. Asia Pacific
- 5.1. Market Analysis, Insights and Forecast - by Application
- 6. Global Industrial Sensors Analysis, Insights and Forecast, 2021-2033
- 6.1. Market Analysis, Insights and Forecast - by Application
- 6.1.1. Energy & Power
- 6.1.2. Oil & Gas
- 6.1.3. Mining
- 6.1.4. Chemical
- 6.1.5. Manufacturing
- 6.1.6. Others
- 6.2. Market Analysis, Insights and Forecast - by Types
- 6.2.1. Level Sensor
- 6.2.2. Temperature Sensor
- 6.2.3. Flow Sensor
- 6.2.4. Position Sensor
- 6.2.5. Pressure Sensor
- 6.2.6. Others
- 6.1. Market Analysis, Insights and Forecast - by Application
- 7. North America Industrial Sensors Analysis, Insights and Forecast, 2020-2032
- 7.1. Market Analysis, Insights and Forecast - by Application
- 7.1.1. Energy & Power
- 7.1.2. Oil & Gas
- 7.1.3. Mining
- 7.1.4. Chemical
- 7.1.5. Manufacturing
- 7.1.6. Others
- 7.2. Market Analysis, Insights and Forecast - by Types
- 7.2.1. Level Sensor
- 7.2.2. Temperature Sensor
- 7.2.3. Flow Sensor
- 7.2.4. Position Sensor
- 7.2.5. Pressure Sensor
- 7.2.6. Others
- 7.1. Market Analysis, Insights and Forecast - by Application
- 8. South America Industrial Sensors Analysis, Insights and Forecast, 2020-2032
- 8.1. Market Analysis, Insights and Forecast - by Application
- 8.1.1. Energy & Power
- 8.1.2. Oil & Gas
- 8.1.3. Mining
- 8.1.4. Chemical
- 8.1.5. Manufacturing
- 8.1.6. Others
- 8.2. Market Analysis, Insights and Forecast - by Types
- 8.2.1. Level Sensor
- 8.2.2. Temperature Sensor
- 8.2.3. Flow Sensor
- 8.2.4. Position Sensor
- 8.2.5. Pressure Sensor
- 8.2.6. Others
- 8.1. Market Analysis, Insights and Forecast - by Application
- 9. Europe Industrial Sensors Analysis, Insights and Forecast, 2020-2032
- 9.1. Market Analysis, Insights and Forecast - by Application
- 9.1.1. Energy & Power
- 9.1.2. Oil & Gas
- 9.1.3. Mining
- 9.1.4. Chemical
- 9.1.5. Manufacturing
- 9.1.6. Others
- 9.2. Market Analysis, Insights and Forecast - by Types
- 9.2.1. Level Sensor
- 9.2.2. Temperature Sensor
- 9.2.3. Flow Sensor
- 9.2.4. Position Sensor
- 9.2.5. Pressure Sensor
- 9.2.6. Others
- 9.1. Market Analysis, Insights and Forecast - by Application
- 10. Middle East & Africa Industrial Sensors Analysis, Insights and Forecast, 2020-2032
- 10.1. Market Analysis, Insights and Forecast - by Application
- 10.1.1. Energy & Power
- 10.1.2. Oil & Gas
- 10.1.3. Mining
- 10.1.4. Chemical
- 10.1.5. Manufacturing
- 10.1.6. Others
- 10.2. Market Analysis, Insights and Forecast - by Types
- 10.2.1. Level Sensor
- 10.2.2. Temperature Sensor
- 10.2.3. Flow Sensor
- 10.2.4. Position Sensor
- 10.2.5. Pressure Sensor
- 10.2.6. Others
- 10.1. Market Analysis, Insights and Forecast - by Application
- 11. Asia Pacific Industrial Sensors Analysis, Insights and Forecast, 2020-2032
- 11.1. Market Analysis, Insights and Forecast - by Application
- 11.1.1. Energy & Power
- 11.1.2. Oil & Gas
- 11.1.3. Mining
- 11.1.4. Chemical
- 11.1.5. Manufacturing
- 11.1.6. Others
- 11.2. Market Analysis, Insights and Forecast - by Types
- 11.2.1. Level Sensor
- 11.2.2. Temperature Sensor
- 11.2.3. Flow Sensor
- 11.2.4. Position Sensor
- 11.2.5. Pressure Sensor
- 11.2.6. Others
- 11.1. Market Analysis, Insights and Forecast - by Application
- 12. Competitive Analysis
- 12.1. Company Profiles
- 12.1.1 ATI Industrial Automation
- 12.1.1.1. Company Overview
- 12.1.1.2. Products
- 12.1.1.3. Company Financials
- 12.1.1.4. SWOT Analysis
- 12.1.2 FANUC
- 12.1.2.1. Company Overview
- 12.1.2.2. Products
- 12.1.2.3. Company Financials
- 12.1.2.4. SWOT Analysis
- 12.1.3 FUTEK Advanced Sensor Technology
- 12.1.3.1. Company Overview
- 12.1.3.2. Products
- 12.1.3.3. Company Financials
- 12.1.3.4. SWOT Analysis
- 12.1.4 Honeywell
- 12.1.4.1. Company Overview
- 12.1.4.2. Products
- 12.1.4.3. Company Financials
- 12.1.4.4. SWOT Analysis
- 12.1.5 AMS
- 12.1.5.1. Company Overview
- 12.1.5.2. Products
- 12.1.5.3. Company Financials
- 12.1.5.4. SWOT Analysis
- 12.1.6 Cognex
- 12.1.6.1. Company Overview
- 12.1.6.2. Products
- 12.1.6.3. Company Financials
- 12.1.6.4. SWOT Analysis
- 12.1.7 OTC Daihen
- 12.1.7.1. Company Overview
- 12.1.7.2. Products
- 12.1.7.3. Company Financials
- 12.1.7.4. SWOT Analysis
- 12.1.8 Hermary Opto Electronics
- 12.1.8.1. Company Overview
- 12.1.8.2. Products
- 12.1.8.3. Company Financials
- 12.1.8.4. SWOT Analysis
- 12.1.9 iniLabs
- 12.1.9.1. Company Overview
- 12.1.9.2. Products
- 12.1.9.3. Company Financials
- 12.1.9.4. SWOT Analysis
- 12.1.10 MaxBotix
- 12.1.10.1. Company Overview
- 12.1.10.2. Products
- 12.1.10.3. Company Financials
- 12.1.10.4. SWOT Analysis
- 12.1.11 Perception Robotics
- 12.1.11.1. Company Overview
- 12.1.11.2. Products
- 12.1.11.3. Company Financials
- 12.1.11.4. SWOT Analysis
- 12.1.12 Roboception
- 12.1.12.1. Company Overview
- 12.1.12.2. Products
- 12.1.12.3. Company Financials
- 12.1.12.4. SWOT Analysis
- 12.1.13 EPSON
- 12.1.13.1. Company Overview
- 12.1.13.2. Products
- 12.1.13.3. Company Financials
- 12.1.13.4. SWOT Analysis
- 12.1.14 Tekscan
- 12.1.14.1. Company Overview
- 12.1.14.2. Products
- 12.1.14.3. Company Financials
- 12.1.14.4. SWOT Analysis
- 12.1.15 Omron
- 12.1.15.1. Company Overview
- 12.1.15.2. Products
- 12.1.15.3. Company Financials
- 12.1.15.4. SWOT Analysis
- 12.1.1 ATI Industrial Automation
- 12.2. Market Entropy
- 12.2.1 Company's Key Areas Served
- 12.2.2 Recent Developments
- 12.3. Company Market Share Analysis 2025
- 12.3.1 Top 5 Companies Market Share Analysis
- 12.3.2 Top 3 Companies Market Share Analysis
- 12.4. List of Potential Customers
- 13. Research Methodology
List of Figures
- Figure 1: Global Industrial Sensors Revenue Breakdown (million, %) by Region 2025 & 2033
- Figure 2: North America Industrial Sensors Revenue (million), by Application 2025 & 2033
- Figure 3: North America Industrial Sensors Revenue Share (%), by Application 2025 & 2033
- Figure 4: North America Industrial Sensors Revenue (million), by Types 2025 & 2033
- Figure 5: North America Industrial Sensors Revenue Share (%), by Types 2025 & 2033
- Figure 6: North America Industrial Sensors Revenue (million), by Country 2025 & 2033
- Figure 7: North America Industrial Sensors Revenue Share (%), by Country 2025 & 2033
- Figure 8: South America Industrial Sensors Revenue (million), by Application 2025 & 2033
- Figure 9: South America Industrial Sensors Revenue Share (%), by Application 2025 & 2033
- Figure 10: South America Industrial Sensors Revenue (million), by Types 2025 & 2033
- Figure 11: South America Industrial Sensors Revenue Share (%), by Types 2025 & 2033
- Figure 12: South America Industrial Sensors Revenue (million), by Country 2025 & 2033
- Figure 13: South America Industrial Sensors Revenue Share (%), by Country 2025 & 2033
- Figure 14: Europe Industrial Sensors Revenue (million), by Application 2025 & 2033
- Figure 15: Europe Industrial Sensors Revenue Share (%), by Application 2025 & 2033
- Figure 16: Europe Industrial Sensors Revenue (million), by Types 2025 & 2033
- Figure 17: Europe Industrial Sensors Revenue Share (%), by Types 2025 & 2033
- Figure 18: Europe Industrial Sensors Revenue (million), by Country 2025 & 2033
- Figure 19: Europe Industrial Sensors Revenue Share (%), by Country 2025 & 2033
- Figure 20: Middle East & Africa Industrial Sensors Revenue (million), by Application 2025 & 2033
- Figure 21: Middle East & Africa Industrial Sensors Revenue Share (%), by Application 2025 & 2033
- Figure 22: Middle East & Africa Industrial Sensors Revenue (million), by Types 2025 & 2033
- Figure 23: Middle East & Africa Industrial Sensors Revenue Share (%), by Types 2025 & 2033
- Figure 24: Middle East & Africa Industrial Sensors Revenue (million), by Country 2025 & 2033
- Figure 25: Middle East & Africa Industrial Sensors Revenue Share (%), by Country 2025 & 2033
- Figure 26: Asia Pacific Industrial Sensors Revenue (million), by Application 2025 & 2033
- Figure 27: Asia Pacific Industrial Sensors Revenue Share (%), by Application 2025 & 2033
- Figure 28: Asia Pacific Industrial Sensors Revenue (million), by Types 2025 & 2033
- Figure 29: Asia Pacific Industrial Sensors Revenue Share (%), by Types 2025 & 2033
- Figure 30: Asia Pacific Industrial Sensors Revenue (million), by Country 2025 & 2033
- Figure 31: Asia Pacific Industrial Sensors Revenue Share (%), by Country 2025 & 2033
List of Tables
- Table 1: Global Industrial Sensors Revenue million Forecast, by Application 2020 & 2033
- Table 2: Global Industrial Sensors Revenue million Forecast, by Types 2020 & 2033
- Table 3: Global Industrial Sensors Revenue million Forecast, by Region 2020 & 2033
- Table 4: Global Industrial Sensors Revenue million Forecast, by Application 2020 & 2033
- Table 5: Global Industrial Sensors Revenue million Forecast, by Types 2020 & 2033
- Table 6: Global Industrial Sensors Revenue million Forecast, by Country 2020 & 2033
- Table 7: United States Industrial Sensors Revenue (million) Forecast, by Application 2020 & 2033
- Table 8: Canada Industrial Sensors Revenue (million) Forecast, by Application 2020 & 2033
- Table 9: Mexico Industrial Sensors Revenue (million) Forecast, by Application 2020 & 2033
- Table 10: Global Industrial Sensors Revenue million Forecast, by Application 2020 & 2033
- Table 11: Global Industrial Sensors Revenue million Forecast, by Types 2020 & 2033
- Table 12: Global Industrial Sensors Revenue million Forecast, by Country 2020 & 2033
- Table 13: Brazil Industrial Sensors Revenue (million) Forecast, by Application 2020 & 2033
- Table 14: Argentina Industrial Sensors Revenue (million) Forecast, by Application 2020 & 2033
- Table 15: Rest of South America Industrial Sensors Revenue (million) Forecast, by Application 2020 & 2033
- Table 16: Global Industrial Sensors Revenue million Forecast, by Application 2020 & 2033
- Table 17: Global Industrial Sensors Revenue million Forecast, by Types 2020 & 2033
- Table 18: Global Industrial Sensors Revenue million Forecast, by Country 2020 & 2033
- Table 19: United Kingdom Industrial Sensors Revenue (million) Forecast, by Application 2020 & 2033
- Table 20: Germany Industrial Sensors Revenue (million) Forecast, by Application 2020 & 2033
- Table 21: France Industrial Sensors Revenue (million) Forecast, by Application 2020 & 2033
- Table 22: Italy Industrial Sensors Revenue (million) Forecast, by Application 2020 & 2033
- Table 23: Spain Industrial Sensors Revenue (million) Forecast, by Application 2020 & 2033
- Table 24: Russia Industrial Sensors Revenue (million) Forecast, by Application 2020 & 2033
- Table 25: Benelux Industrial Sensors Revenue (million) Forecast, by Application 2020 & 2033
- Table 26: Nordics Industrial Sensors Revenue (million) Forecast, by Application 2020 & 2033
- Table 27: Rest of Europe Industrial Sensors Revenue (million) Forecast, by Application 2020 & 2033
- Table 28: Global Industrial Sensors Revenue million Forecast, by Application 2020 & 2033
- Table 29: Global Industrial Sensors Revenue million Forecast, by Types 2020 & 2033
- Table 30: Global Industrial Sensors Revenue million Forecast, by Country 2020 & 2033
- Table 31: Turkey Industrial Sensors Revenue (million) Forecast, by Application 2020 & 2033
- Table 32: Israel Industrial Sensors Revenue (million) Forecast, by Application 2020 & 2033
- Table 33: GCC Industrial Sensors Revenue (million) Forecast, by Application 2020 & 2033
- Table 34: North Africa Industrial Sensors Revenue (million) Forecast, by Application 2020 & 2033
- Table 35: South Africa Industrial Sensors Revenue (million) Forecast, by Application 2020 & 2033
- Table 36: Rest of Middle East & Africa Industrial Sensors Revenue (million) Forecast, by Application 2020 & 2033
- Table 37: Global Industrial Sensors Revenue million Forecast, by Application 2020 & 2033
- Table 38: Global Industrial Sensors Revenue million Forecast, by Types 2020 & 2033
- Table 39: Global Industrial Sensors Revenue million Forecast, by Country 2020 & 2033
- Table 40: China Industrial Sensors Revenue (million) Forecast, by Application 2020 & 2033
- Table 41: India Industrial Sensors Revenue (million) Forecast, by Application 2020 & 2033
- Table 42: Japan Industrial Sensors Revenue (million) Forecast, by Application 2020 & 2033
- Table 43: South Korea Industrial Sensors Revenue (million) Forecast, by Application 2020 & 2033
- Table 44: ASEAN Industrial Sensors Revenue (million) Forecast, by Application 2020 & 2033
- Table 45: Oceania Industrial Sensors Revenue (million) Forecast, by Application 2020 & 2033
- Table 46: Rest of Asia Pacific Industrial Sensors Revenue (million) Forecast, by Application 2020 & 2033
Frequently Asked Questions
1. What is the projected Compound Annual Growth Rate (CAGR) of the Industrial Sensors?
The projected CAGR is approximately XX%.
2. Which companies are prominent players in the Industrial Sensors?
Key companies in the market include ATI Industrial Automation, FANUC, FUTEK Advanced Sensor Technology, Honeywell, AMS, Cognex, OTC Daihen, Hermary Opto Electronics, iniLabs, MaxBotix, Perception Robotics, Roboception, EPSON, Tekscan, Omron.
3. What are the main segments of the Industrial Sensors?
The market segments include Application, Types.
4. Can you provide details about the market size?
The market size is estimated to be USD XXX million as of 2022.
5. What are some drivers contributing to market growth?
N/A
6. What are the notable trends driving market growth?
N/A
7. Are there any restraints impacting market growth?
N/A
8. Can you provide examples of recent developments in the market?
N/A
9. What pricing options are available for accessing the report?
Pricing options include single-user, multi-user, and enterprise licenses priced at USD 2900.00, USD 4350.00, and USD 5800.00 respectively.
10. Is the market size provided in terms of value or volume?
The market size is provided in terms of value, measured in million.
11. Are there any specific market keywords associated with the report?
Yes, the market keyword associated with the report is "Industrial Sensors," which aids in identifying and referencing the specific market segment covered.
12. How do I determine which pricing option suits my needs best?
The pricing options vary based on user requirements and access needs. Individual users may opt for single-user licenses, while businesses requiring broader access may choose multi-user or enterprise licenses for cost-effective access to the report.
13. Are there any additional resources or data provided in the Industrial Sensors report?
While the report offers comprehensive insights, it's advisable to review the specific contents or supplementary materials provided to ascertain if additional resources or data are available.
14. How can I stay updated on further developments or reports in the Industrial Sensors?
To stay informed about further developments, trends, and reports in the Industrial Sensors, consider subscribing to industry newsletters, following relevant companies and organizations, or regularly checking reputable industry news sources and publications.
Methodology
Step 1 - Identification of Relevant Samples Size from Population Database


Step 2 - Approaches for Defining Global Market Size (Value, Volume* & Price*)

Note*: In applicable scenarios
Step 3 - Data Sources
Primary Research
- Web Analytics
- Survey Reports
- Research Institute
- Latest Research Reports
- Opinion Leaders
Secondary Research
- Annual Reports
- White Paper
- Latest Press Release
- Industry Association
- Paid Database
- Investor Presentations

Step 4 - Data Triangulation
Involves using different sources of information in order to increase the validity of a study
These sources are likely to be stakeholders in a program - participants, other researchers, program staff, other community members, and so on.
Then we put all data in single framework & apply various statistical tools to find out the dynamic on the market.
During the analysis stage, feedback from the stakeholder groups would be compared to determine areas of agreement as well as areas of divergence