


Key Insights
The global market for Immunoaffinity Cleanup Columns is poised for robust expansion, estimated at $372 million in 2025, and projected to grow at a Compound Annual Growth Rate (CAGR) of 6.5% throughout the forecast period extending to 2033. This significant growth is primarily driven by increasing global concerns regarding food safety and the rising prevalence of mycotoxin contamination in agricultural products. As regulatory bodies worldwide implement stricter testing protocols and consumer awareness about foodborne illnesses escalates, the demand for highly sensitive and specific mycotoxin detection methods, such as those employing immunoaffinity columns, is experiencing an unprecedented surge. The application segment is dominated by grains and feed, which constitute the largest share due to their susceptibility to mycotoxin contamination and their integral role in the food supply chain. The "Others" application segment, encompassing beverages, processed foods, and pharmaceuticals, is also demonstrating considerable growth as quality control measures become more stringent across diverse industries.
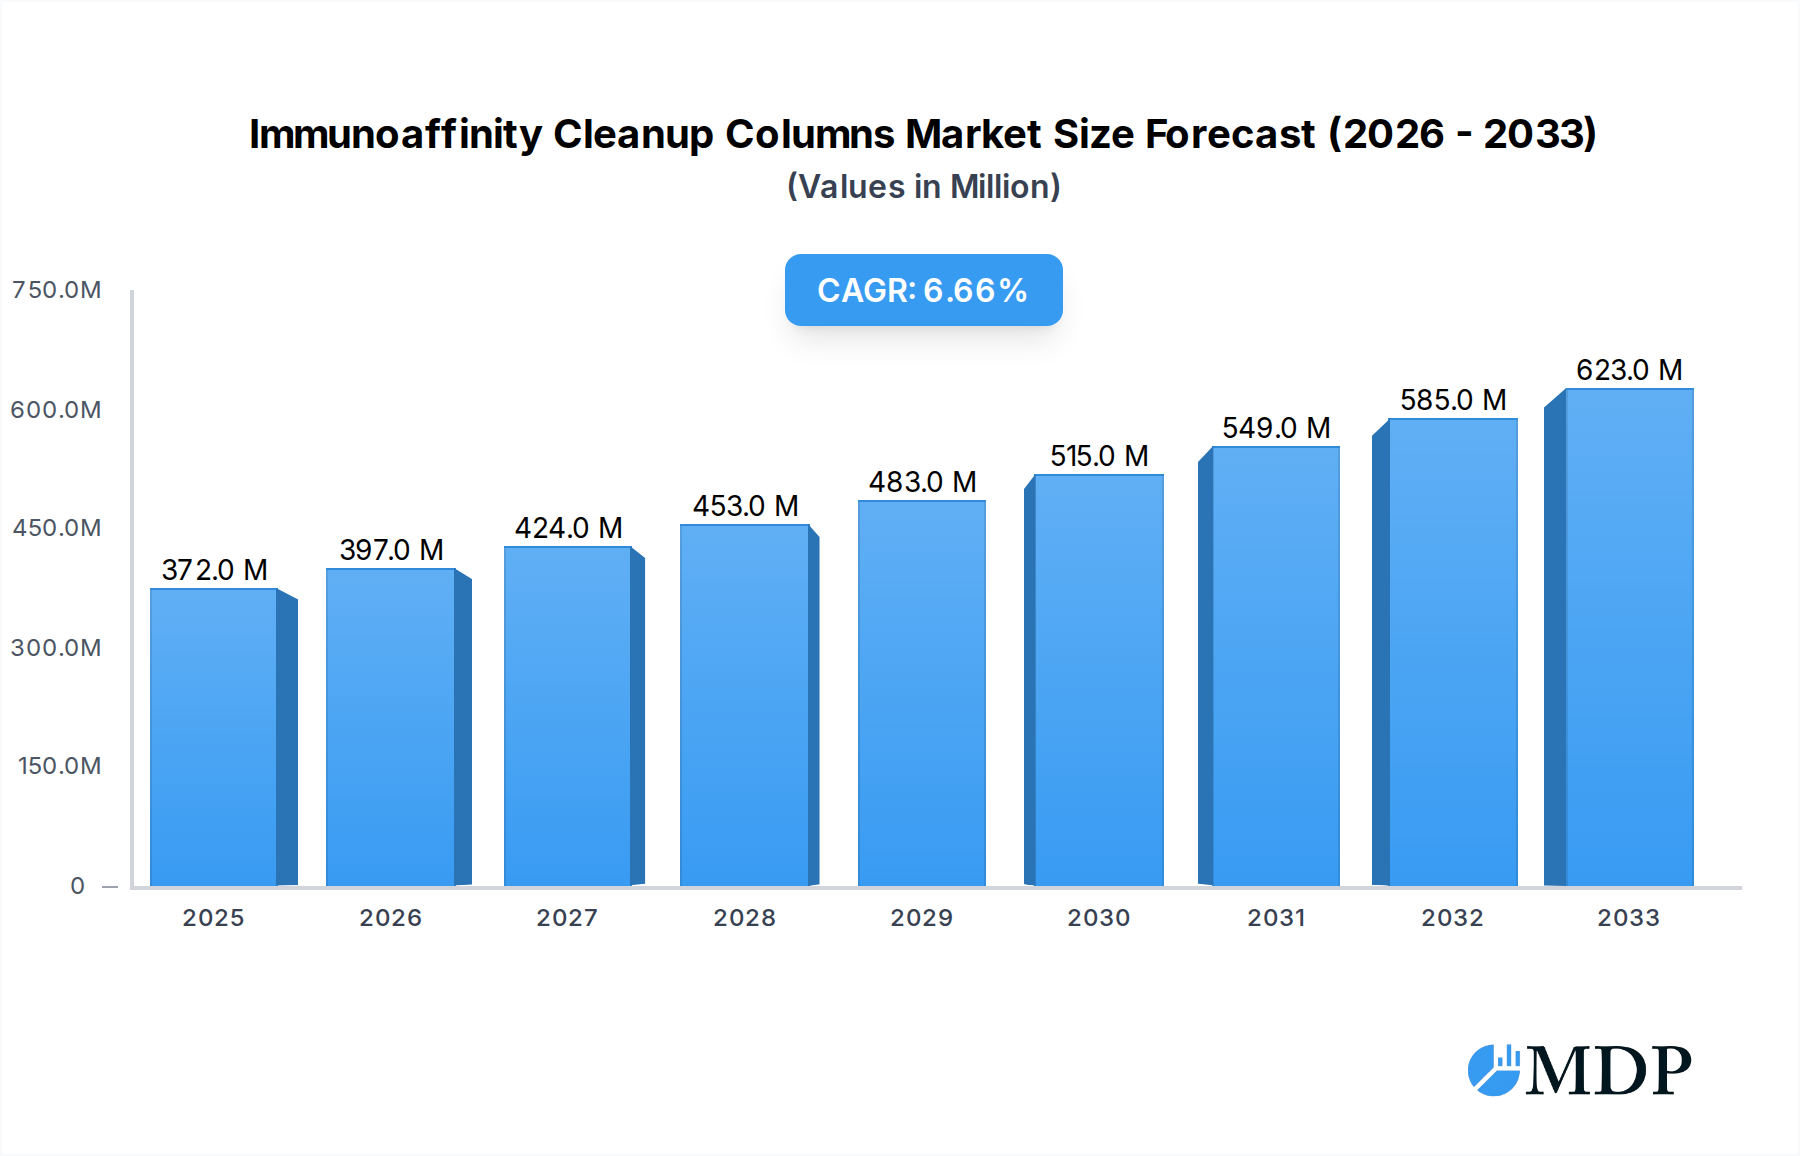
Immunoaffinity Cleanup Columns Market Size (In Million)

Key trends shaping this market include the ongoing development of faster, more automated, and cost-effective mycotoxin detection solutions. Manufacturers are investing heavily in research and development to enhance the specificity and sensitivity of their immunoaffinity columns, catering to a wider range of mycotoxins such as Aflatoxins, Ochratoxin, Zearalenone, Deoxynivalenol, and Fumonisins. Emerging economies, particularly in the Asia Pacific region, are emerging as significant growth pockets due to rapid industrialization, expanding agricultural sectors, and increasing investments in food safety infrastructure. However, the market faces certain restraints, including the relatively high cost of specialized equipment and reagents associated with immunoaffinity cleanup, and the need for skilled personnel to operate and interpret results. Despite these challenges, the persistent threat of mycotoxin contamination and the unwavering commitment to ensuring food security will continue to propel the immunoaffinity cleanup columns market forward.
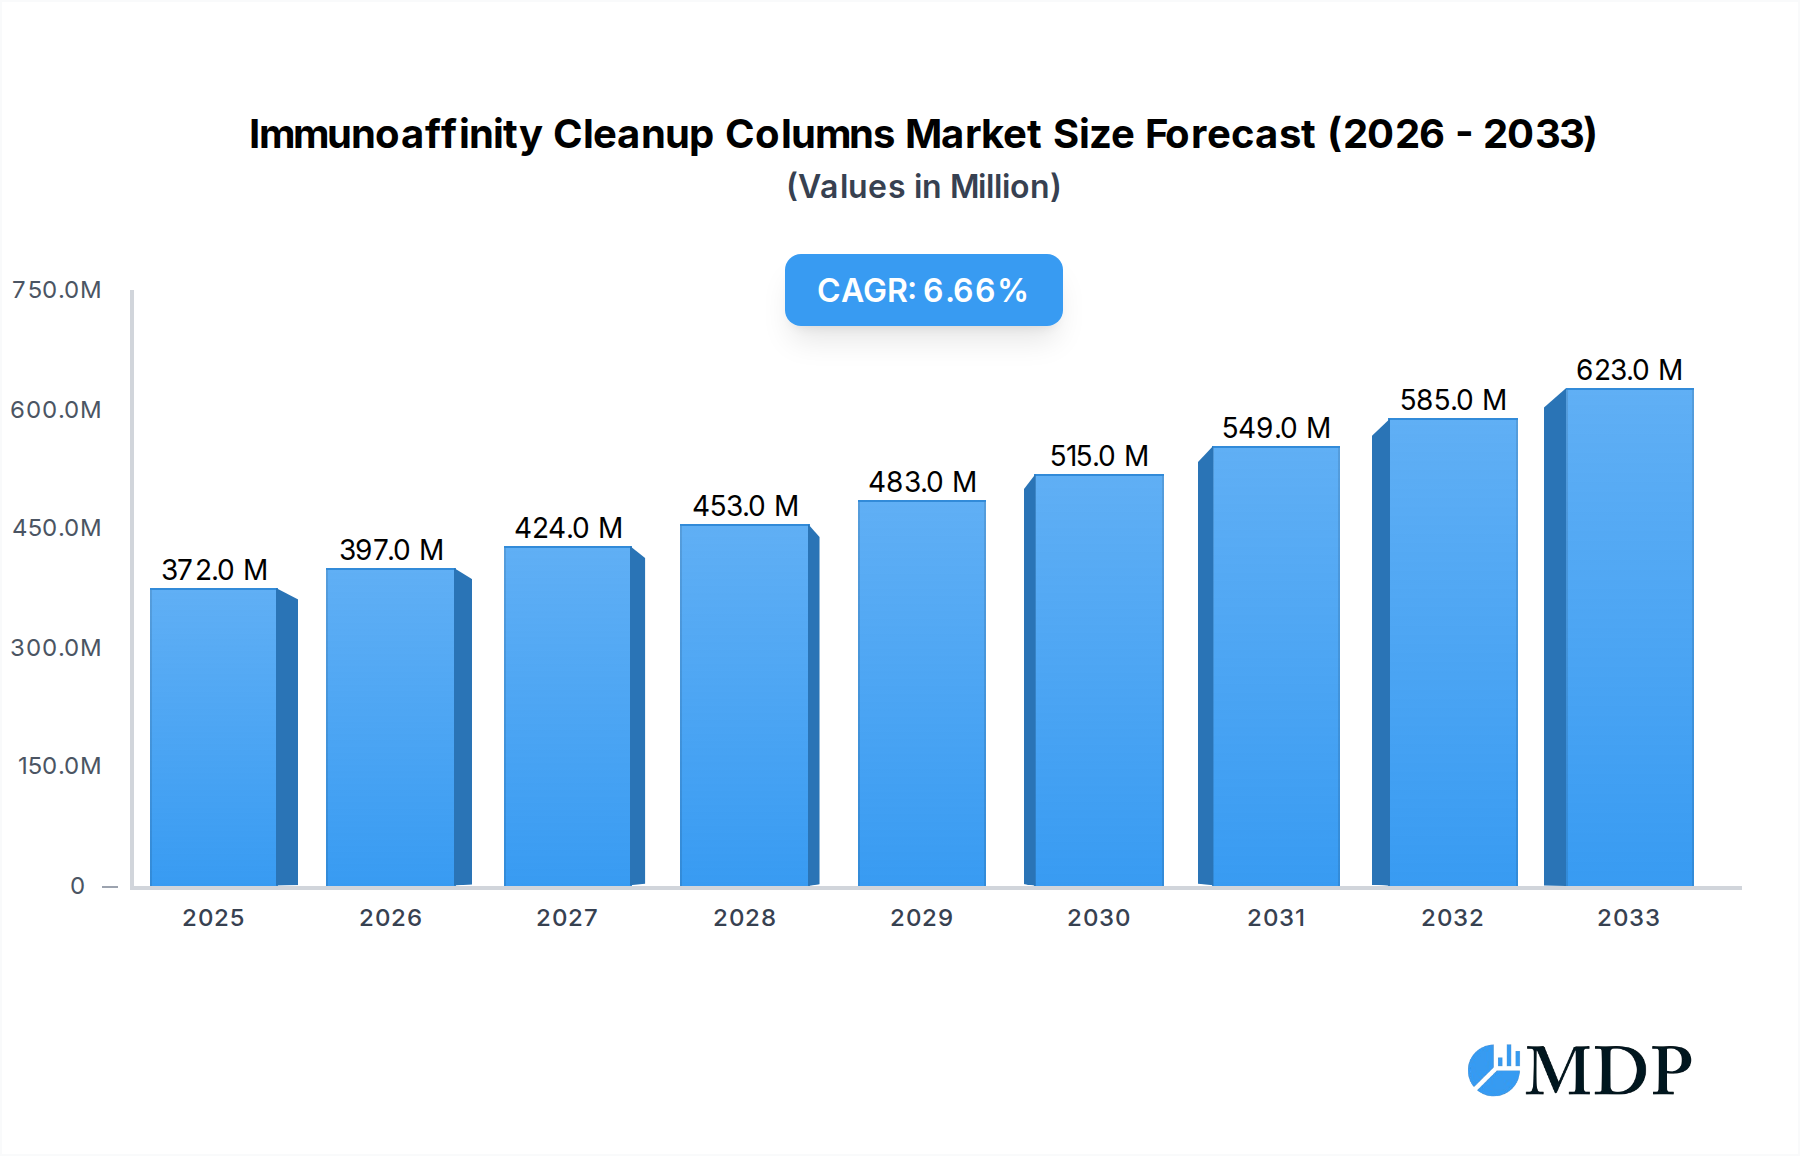
Immunoaffinity Cleanup Columns Company Market Share
Unveiling the Global Immunoaffinity Cleanup Columns Market: A Comprehensive Analysis (2019-2033)
This in-depth report offers a definitive look into the Immunoaffinity Cleanup Columns market, a critical component in ensuring food safety and agricultural product quality. Delving into market dynamics, key trends, leading segments, and future opportunities, this research provides actionable insights for stakeholders. Our analysis spans the historical period from 2019 to 2024, with a base year of 2025, and projects market evolution through 2033. We meticulously examine the competitive landscape, technological advancements, and regulatory influences shaping this vital industry. Discover the growth drivers, challenges, and strategic imperatives for success in the burgeoning global immunoaffinity cleanup columns sector.
Immunoaffinity Cleanup Columns Market Dynamics & Concentration
The Immunoaffinity Cleanup Columns market exhibits a moderate to high level of concentration, with a significant portion of the market share held by a few key players. Innovation is a primary driver, fueled by the continuous demand for enhanced sensitivity, specificity, and speed in mycotoxin and other contaminant detection. Stringent regulatory frameworks globally, particularly concerning food and feed safety, play a pivotal role in dictating market growth and product development. The presence of readily available, albeit less specific, product substitutes like solid-phase extraction (SPE) columns necessitates a strong emphasis on the superior performance of immunoaffinity columns. End-user trends are increasingly leaning towards automated systems and integrated testing solutions, demanding columns that are compatible with high-throughput workflows. Mergers and acquisitions (M&A) activities are anticipated to increase, as larger companies seek to consolidate their market position and acquire innovative technologies. We project an average of xx M&A deals per year during the forecast period, with an estimated market share consolidation of xx% by leading players by 2033.
Immunoaffinity Cleanup Columns Industry Trends & Analysis
The Immunoaffinity Cleanup Columns industry is poised for robust expansion, driven by escalating global concerns over food safety and the increasing prevalence of mycotoxin contamination in agricultural commodities. The compound annual growth rate (CAGR) for this market is estimated to be xx% from 2025 to 2033. Technological disruptions, such as the development of novel antibody conjugates and more efficient column matrices, are enhancing the precision and reducing assay times for detecting a wide array of contaminants. Consumer preferences are shifting towards greater transparency and assurance in food sourcing, directly impacting the demand for reliable analytical tools. The competitive dynamics are characterized by intense innovation and strategic collaborations between column manufacturers and instrument providers to offer comprehensive testing solutions. Market penetration is projected to reach xx% by 2033, driven by increased adoption in emerging economies and expanded applications beyond traditional food testing. The growing emphasis on regulatory compliance and the need to meet international standards for food and feed safety are foundational to this upward trajectory. Furthermore, the continuous evolution of testing methodologies, moving towards faster, more sensitive, and multiplexed detection systems, will fuel the demand for advanced immunoaffinity cleanup columns. The integration of these columns into portable and field-deployable analytical devices represents another significant trend, enabling on-site testing and rapid decision-making. The market is also witnessing a growing demand for columns tailored for specific applications and complex sample matrices, pushing manufacturers to diversify their product portfolios and invest in specialized research and development.
Leading Markets & Segments in Immunoaffinity Cleanup Columns
The Grains application segment currently dominates the Immunoaffinity Cleanup Columns market, driven by its susceptibility to widespread mycotoxin contamination, particularly aflatoxins and fumonisins. Within this segment, the Aflatoxins and Fumonisins types represent the most significant sub-segments due to their high toxicity and strict regulatory limits. Geographically, North America and Europe lead in market adoption, owing to well-established regulatory frameworks, advanced agricultural practices, and a high consumer demand for safe food products.
- Dominant Application Segment: Grains:
- Economic Policies: Stringent food safety regulations in major grain-producing and consuming nations mandating mycotoxin testing.
- Agricultural Practices: Widespread cultivation of crops like corn, wheat, and rice, which are prone to fungal growth and mycotoxin production.
- Consumer Demand: Growing consumer awareness and demand for toxin-free food products.
- Dominant Type Segment: Aflatoxins and Fumonisins:
- Toxicity: These mycotoxins are among the most potent and prevalent, posing significant health risks to humans and animals.
- Regulatory Limits: Strict international and national regulations set low tolerance levels for aflatoxins and fumonisins in food and feed.
- Global Prevalence: Widespread occurrence in various climatic conditions, making their detection crucial across diverse agricultural regions.
The continued growth in the Feed segment is also notable, as the economic impact of mycotoxin contamination on livestock health and productivity is substantial. Emerging markets in Asia and Latin America are projected to witness significant growth due to improving agricultural infrastructure, increasing regulatory oversight, and rising disposable incomes leading to greater demand for safe food. The "Others" application, encompassing beverages, spices, and processed foods, also presents a growing opportunity as testing protocols become more comprehensive.
Immunoaffinity Cleanup Columns Product Developments
Recent product developments in Immunoaffinity Cleanup Columns are characterized by enhanced antibody specificity, improved resin chemistries for higher binding capacities, and the development of multiplexed columns capable of simultaneously detecting multiple analytes. These innovations lead to faster assay times, reduced sample preparation efforts, and improved detection limits. For instance, the development of single-use, pre-packaged columns has streamlined laboratory workflows. Competitive advantages are being gained through the development of columns that offer superior recovery rates for challenging matrices and are compatible with automated analytical platforms, such as HPLC and LC-MS/MS systems. These advancements directly address the industry’s need for more efficient, accurate, and high-throughput testing solutions, solidifying the role of immunoaffinity cleanup in ensuring food and feed safety.
Key Drivers of Immunoaffinity Cleanup Columns Growth
The Immunoaffinity Cleanup Columns market is primarily propelled by increasingly stringent global regulations on food and feed safety, which mandate the detection and quantification of mycotoxins and other harmful contaminants. Technological advancements in antibody development and chromatography have led to more sensitive, specific, and faster testing methods, enhancing the efficiency of immunoaffinity cleanup. Growing consumer awareness regarding the health risks associated with contaminated food products is creating a sustained demand for reliable analytical tools. Furthermore, the economic imperative for the agricultural industry to ensure the quality and safety of its produce, thereby preventing trade restrictions and product recalls, acts as a significant growth catalyst. The expansion of the food processing industry and the rising demand for processed foods globally also contribute to the increased need for robust analytical solutions.
Challenges in the Immunoaffinity Cleanup Columns Market
Despite significant growth, the Immunoaffinity Cleanup Columns market faces several challenges. The high cost of developing and manufacturing highly specific antibodies can translate to higher product prices, posing a barrier for price-sensitive markets. Intense competition from alternative, albeit less specific, analytical techniques like solid-phase extraction (SPE) necessitates continuous innovation and cost optimization. Evolving regulatory landscapes can require constant adaptation of testing methodologies and column specificities. Supply chain disruptions, particularly for specialized reagents and raw materials, can impact production and availability. Furthermore, the need for skilled personnel to operate and interpret results from advanced analytical instrumentation can limit widespread adoption in certain regions.
Emerging Opportunities in Immunoaffinity Cleanup Columns
Emerging opportunities in the Immunoaffinity Cleanup Columns market are being driven by several key factors. The development of multiplexed immunoaffinity columns capable of detecting multiple mycotoxins simultaneously in a single run presents a significant opportunity for enhanced efficiency and cost savings. Advancements in nanotechnology are enabling the creation of novel affinity ligands with superior binding properties, leading to improved sensitivity and reduced assay times. Strategic partnerships between immunoaffinity column manufacturers and manufacturers of analytical instruments, such as HPLC and LC-MS/MS systems, are creating integrated testing solutions that are more user-friendly and efficient. Furthermore, the expansion of food safety testing into emerging economies, coupled with a growing emphasis on regulatory compliance in these regions, opens up substantial market potential for immunoaffinity cleanup technologies. The increasing focus on testing for emerging contaminants beyond traditional mycotoxins also presents a promising avenue for market growth and product diversification.
Leading Players in the Immunoaffinity Cleanup Columns Sector
- Gold Standard Diagnostics Horsham
- LCTech
- Shimadzu
- Biotez Berlin
- PerkinElmer
- VICAM
- Ring Biotechnology
- R-Biopharm AG
- CHROMATIFIC
- Neogen
- Shenzhen Bioeasy Biotechnology
- Kwinbon Biotechnology
- Shandong Meizheng Bio-Tech
- Shandong Lvdu Bio-Sciences & Technology
- Beijing Nano-Ace Technology
- Pribolab
- Jiangsu Suwei Micro-Biology Research
- BIOCOMMA
- Jiangsu Wisdom Engineering & Technology
- Anavo
- Prufunglab
- Femdetection
- Welch Materials
- Wuhan Huamei Wisherkon Biotech
- Shandong Vnya Bio-technology
Key Milestones in Immunoaffinity Cleanup Columns Industry
- 2019: Introduction of advanced monoclonal antibody-based columns for enhanced specificity in aflatoxin detection.
- 2020: Development of multiplexed columns capable of simultaneous detection of multiple mycotoxins, streamlining lab workflows.
- 2021: Emergence of user-friendly, single-use immunoaffinity columns for point-of-need testing applications.
- 2022: Significant investment in R&D for novel affinity ligands with higher binding capacities and improved stability.
- 2023: Increased integration of immunoaffinity cleanup columns with automated liquid handling systems for high-throughput analysis.
- 2024: Focus on developing columns for emerging contaminants and novel mycotoxin detection, expanding the application scope.
Strategic Outlook for Immunoaffinity Cleanup Columns Market
The strategic outlook for the Immunoaffinity Cleanup Columns market is overwhelmingly positive, driven by persistent global demand for food safety assurance. Future growth accelerators will stem from continued technological innovation in antibody engineering and matrix development, leading to more cost-effective and efficient analytical solutions. Strategic partnerships and collaborations between manufacturers, research institutions, and regulatory bodies will be crucial for market expansion and the development of standardized testing protocols. The increasing adoption of advanced analytical instrumentation, such as LC-MS/MS, will further propel the demand for high-quality immunoaffinity cleanup columns. Furthermore, the growing global emphasis on precision agriculture and sustainable food production systems will necessitate robust and reliable testing methods, creating sustained opportunities for market leaders to innovate and capture market share. The expansion into untapped geographic markets and the development of specialized columns for niche applications will also be key strategic imperatives.
Immunoaffinity Cleanup Columns Segmentation
-
1. Application
- 1.1. Grains
- 1.2. Feed
- 1.3. Others
-
2. Type
- 2.1. Aflatoxins
- 2.2. Ochratoxin
- 2.3. Zearalenone
- 2.4. Deoxynivalenol
- 2.5. Fumonisins
- 2.6. Others
Immunoaffinity Cleanup Columns Segmentation By Geography
-
1. North America
- 1.1. United States
- 1.2. Canada
- 1.3. Mexico
-
2. South America
- 2.1. Brazil
- 2.2. Argentina
- 2.3. Rest of South America
-
3. Europe
- 3.1. United Kingdom
- 3.2. Germany
- 3.3. France
- 3.4. Italy
- 3.5. Spain
- 3.6. Russia
- 3.7. Benelux
- 3.8. Nordics
- 3.9. Rest of Europe
-
4. Middle East & Africa
- 4.1. Turkey
- 4.2. Israel
- 4.3. GCC
- 4.4. North Africa
- 4.5. South Africa
- 4.6. Rest of Middle East & Africa
-
5. Asia Pacific
- 5.1. China
- 5.2. India
- 5.3. Japan
- 5.4. South Korea
- 5.5. ASEAN
- 5.6. Oceania
- 5.7. Rest of Asia Pacific
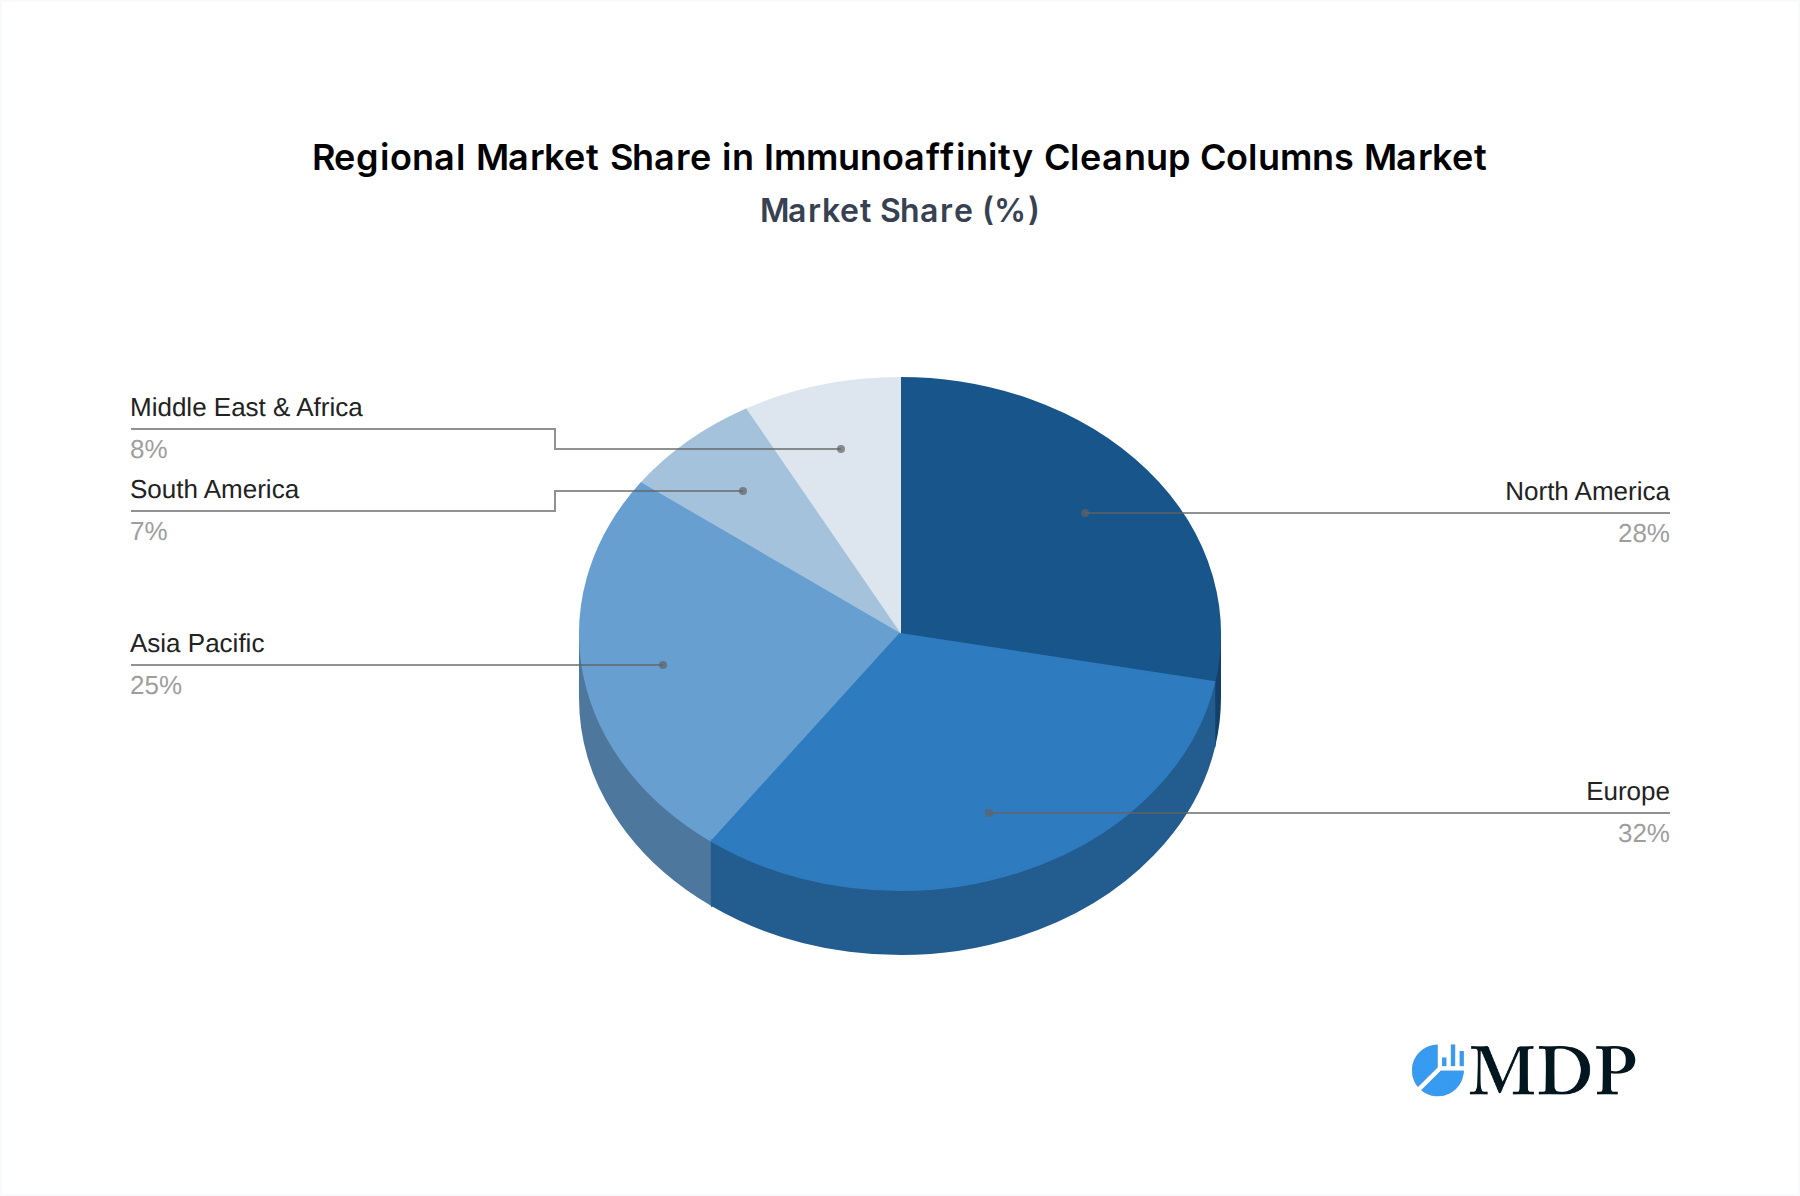
Immunoaffinity Cleanup Columns Regional Market Share
Geographic Coverage of Immunoaffinity Cleanup Columns
Immunoaffinity Cleanup Columns REPORT HIGHLIGHTS
| Aspects | Details |
|---|---|
| Study Period | 2020-2034 |
| Base Year | 2025 |
| Estimated Year | 2026 |
| Forecast Period | 2026-2034 |
| Historical Period | 2020-2025 |
| Growth Rate | CAGR of 6.5% from 2020-2034 |
| Segmentation |
|
Table of Contents
- 1. Introduction
- 1.1. Research Scope
- 1.2. Market Segmentation
- 1.3. Research Objective
- 1.4. Definitions and Assumptions
- 2. Executive Summary
- 2.1. Market Snapshot
- 3. Market Dynamics
- 3.1. Market Drivers
- 3.2. Market Restrains
- 3.3. Market Trends
- 3.4. Market Opportunities
- 4. Market Factor Analysis
- 4.1. Porters Five Forces
- 4.1.1. Bargaining Power of Suppliers
- 4.1.2. Bargaining Power of Buyers
- 4.1.3. Threat of New Entrants
- 4.1.4. Threat of Substitutes
- 4.1.5. Competitive Rivalry
- 4.2. PESTEL analysis
- 4.3. BCG Analysis
- 4.3.1. Stars (High Growth, High Market Share)
- 4.3.2. Cash Cows (Low Growth, High Market Share)
- 4.3.3. Question Mark (High Growth, Low Market Share)
- 4.3.4. Dogs (Low Growth, Low Market Share)
- 4.4. Ansoff Matrix Analysis
- 4.5. Supply Chain Analysis
- 4.6. Regulatory Landscape
- 4.7. Current Market Potential and Opportunity Assessment (TAM–SAM–SOM Framework)
- 4.8. MDP Analyst Note
- 4.1. Porters Five Forces
- 5. Market Analysis, Insights and Forecast 2021-2033
- 5.1. Market Analysis, Insights and Forecast - by Application
- 5.1.1. Grains
- 5.1.2. Feed
- 5.1.3. Others
- 5.2. Market Analysis, Insights and Forecast - by Type
- 5.2.1. Aflatoxins
- 5.2.2. Ochratoxin
- 5.2.3. Zearalenone
- 5.2.4. Deoxynivalenol
- 5.2.5. Fumonisins
- 5.2.6. Others
- 5.3. Market Analysis, Insights and Forecast - by Region
- 5.3.1. North America
- 5.3.2. South America
- 5.3.3. Europe
- 5.3.4. Middle East & Africa
- 5.3.5. Asia Pacific
- 5.1. Market Analysis, Insights and Forecast - by Application
- 6. Global Immunoaffinity Cleanup Columns Analysis, Insights and Forecast, 2021-2033
- 6.1. Market Analysis, Insights and Forecast - by Application
- 6.1.1. Grains
- 6.1.2. Feed
- 6.1.3. Others
- 6.2. Market Analysis, Insights and Forecast - by Type
- 6.2.1. Aflatoxins
- 6.2.2. Ochratoxin
- 6.2.3. Zearalenone
- 6.2.4. Deoxynivalenol
- 6.2.5. Fumonisins
- 6.2.6. Others
- 6.1. Market Analysis, Insights and Forecast - by Application
- 7. North America Immunoaffinity Cleanup Columns Analysis, Insights and Forecast, 2020-2032
- 7.1. Market Analysis, Insights and Forecast - by Application
- 7.1.1. Grains
- 7.1.2. Feed
- 7.1.3. Others
- 7.2. Market Analysis, Insights and Forecast - by Type
- 7.2.1. Aflatoxins
- 7.2.2. Ochratoxin
- 7.2.3. Zearalenone
- 7.2.4. Deoxynivalenol
- 7.2.5. Fumonisins
- 7.2.6. Others
- 7.1. Market Analysis, Insights and Forecast - by Application
- 8. South America Immunoaffinity Cleanup Columns Analysis, Insights and Forecast, 2020-2032
- 8.1. Market Analysis, Insights and Forecast - by Application
- 8.1.1. Grains
- 8.1.2. Feed
- 8.1.3. Others
- 8.2. Market Analysis, Insights and Forecast - by Type
- 8.2.1. Aflatoxins
- 8.2.2. Ochratoxin
- 8.2.3. Zearalenone
- 8.2.4. Deoxynivalenol
- 8.2.5. Fumonisins
- 8.2.6. Others
- 8.1. Market Analysis, Insights and Forecast - by Application
- 9. Europe Immunoaffinity Cleanup Columns Analysis, Insights and Forecast, 2020-2032
- 9.1. Market Analysis, Insights and Forecast - by Application
- 9.1.1. Grains
- 9.1.2. Feed
- 9.1.3. Others
- 9.2. Market Analysis, Insights and Forecast - by Type
- 9.2.1. Aflatoxins
- 9.2.2. Ochratoxin
- 9.2.3. Zearalenone
- 9.2.4. Deoxynivalenol
- 9.2.5. Fumonisins
- 9.2.6. Others
- 9.1. Market Analysis, Insights and Forecast - by Application
- 10. Middle East & Africa Immunoaffinity Cleanup Columns Analysis, Insights and Forecast, 2020-2032
- 10.1. Market Analysis, Insights and Forecast - by Application
- 10.1.1. Grains
- 10.1.2. Feed
- 10.1.3. Others
- 10.2. Market Analysis, Insights and Forecast - by Type
- 10.2.1. Aflatoxins
- 10.2.2. Ochratoxin
- 10.2.3. Zearalenone
- 10.2.4. Deoxynivalenol
- 10.2.5. Fumonisins
- 10.2.6. Others
- 10.1. Market Analysis, Insights and Forecast - by Application
- 11. Asia Pacific Immunoaffinity Cleanup Columns Analysis, Insights and Forecast, 2020-2032
- 11.1. Market Analysis, Insights and Forecast - by Application
- 11.1.1. Grains
- 11.1.2. Feed
- 11.1.3. Others
- 11.2. Market Analysis, Insights and Forecast - by Type
- 11.2.1. Aflatoxins
- 11.2.2. Ochratoxin
- 11.2.3. Zearalenone
- 11.2.4. Deoxynivalenol
- 11.2.5. Fumonisins
- 11.2.6. Others
- 11.1. Market Analysis, Insights and Forecast - by Application
- 12. Competitive Analysis
- 12.1. Company Profiles
- 12.1.1 Gold Standard Diagnostics Horsham
- 12.1.1.1. Company Overview
- 12.1.1.2. Products
- 12.1.1.3. Company Financials
- 12.1.1.4. SWOT Analysis
- 12.1.2 LCTech
- 12.1.2.1. Company Overview
- 12.1.2.2. Products
- 12.1.2.3. Company Financials
- 12.1.2.4. SWOT Analysis
- 12.1.3 Shimadzu
- 12.1.3.1. Company Overview
- 12.1.3.2. Products
- 12.1.3.3. Company Financials
- 12.1.3.4. SWOT Analysis
- 12.1.4 Biotez Berlin
- 12.1.4.1. Company Overview
- 12.1.4.2. Products
- 12.1.4.3. Company Financials
- 12.1.4.4. SWOT Analysis
- 12.1.5 PerkinElmer
- 12.1.5.1. Company Overview
- 12.1.5.2. Products
- 12.1.5.3. Company Financials
- 12.1.5.4. SWOT Analysis
- 12.1.6 VICAM
- 12.1.6.1. Company Overview
- 12.1.6.2. Products
- 12.1.6.3. Company Financials
- 12.1.6.4. SWOT Analysis
- 12.1.7 Ring Biotechnology
- 12.1.7.1. Company Overview
- 12.1.7.2. Products
- 12.1.7.3. Company Financials
- 12.1.7.4. SWOT Analysis
- 12.1.8 R-Biopharm AG
- 12.1.8.1. Company Overview
- 12.1.8.2. Products
- 12.1.8.3. Company Financials
- 12.1.8.4. SWOT Analysis
- 12.1.9 CHROMATIFIC
- 12.1.9.1. Company Overview
- 12.1.9.2. Products
- 12.1.9.3. Company Financials
- 12.1.9.4. SWOT Analysis
- 12.1.10 Neogen
- 12.1.10.1. Company Overview
- 12.1.10.2. Products
- 12.1.10.3. Company Financials
- 12.1.10.4. SWOT Analysis
- 12.1.11 Shenzhen Bioeasy Biotechnology
- 12.1.11.1. Company Overview
- 12.1.11.2. Products
- 12.1.11.3. Company Financials
- 12.1.11.4. SWOT Analysis
- 12.1.12 Kwinbon Biotechnology
- 12.1.12.1. Company Overview
- 12.1.12.2. Products
- 12.1.12.3. Company Financials
- 12.1.12.4. SWOT Analysis
- 12.1.13 Shandong Meizheng Bio-Tech
- 12.1.13.1. Company Overview
- 12.1.13.2. Products
- 12.1.13.3. Company Financials
- 12.1.13.4. SWOT Analysis
- 12.1.14 Shandong Lvdu Bio-Sciences & Technology
- 12.1.14.1. Company Overview
- 12.1.14.2. Products
- 12.1.14.3. Company Financials
- 12.1.14.4. SWOT Analysis
- 12.1.15 Beijing Nano-Ace Technology
- 12.1.15.1. Company Overview
- 12.1.15.2. Products
- 12.1.15.3. Company Financials
- 12.1.15.4. SWOT Analysis
- 12.1.16 Pribolab
- 12.1.16.1. Company Overview
- 12.1.16.2. Products
- 12.1.16.3. Company Financials
- 12.1.16.4. SWOT Analysis
- 12.1.17 Jiangsu Suwei Micro-Biology Research
- 12.1.17.1. Company Overview
- 12.1.17.2. Products
- 12.1.17.3. Company Financials
- 12.1.17.4. SWOT Analysis
- 12.1.18 BIOCOMMA
- 12.1.18.1. Company Overview
- 12.1.18.2. Products
- 12.1.18.3. Company Financials
- 12.1.18.4. SWOT Analysis
- 12.1.19 Jiangsu Wisdom Engineering & Technology
- 12.1.19.1. Company Overview
- 12.1.19.2. Products
- 12.1.19.3. Company Financials
- 12.1.19.4. SWOT Analysis
- 12.1.20 Anavo
- 12.1.20.1. Company Overview
- 12.1.20.2. Products
- 12.1.20.3. Company Financials
- 12.1.20.4. SWOT Analysis
- 12.1.21 Prufunglab
- 12.1.21.1. Company Overview
- 12.1.21.2. Products
- 12.1.21.3. Company Financials
- 12.1.21.4. SWOT Analysis
- 12.1.22 Femdetection
- 12.1.22.1. Company Overview
- 12.1.22.2. Products
- 12.1.22.3. Company Financials
- 12.1.22.4. SWOT Analysis
- 12.1.23 Welch Materials
- 12.1.23.1. Company Overview
- 12.1.23.2. Products
- 12.1.23.3. Company Financials
- 12.1.23.4. SWOT Analysis
- 12.1.24 Wuhan Huamei Wisherkon Biotech
- 12.1.24.1. Company Overview
- 12.1.24.2. Products
- 12.1.24.3. Company Financials
- 12.1.24.4. SWOT Analysis
- 12.1.25 Shandong Vnya Bio-technology
- 12.1.25.1. Company Overview
- 12.1.25.2. Products
- 12.1.25.3. Company Financials
- 12.1.25.4. SWOT Analysis
- 12.1.1 Gold Standard Diagnostics Horsham
- 12.2. Market Entropy
- 12.2.1 Company's Key Areas Served
- 12.2.2 Recent Developments
- 12.3. Company Market Share Analysis 2025
- 12.3.1 Top 5 Companies Market Share Analysis
- 12.3.2 Top 3 Companies Market Share Analysis
- 12.4. List of Potential Customers
- 13. Research Methodology
List of Figures
- Figure 1: Global Immunoaffinity Cleanup Columns Revenue Breakdown (million, %) by Region 2025 & 2033
- Figure 2: North America Immunoaffinity Cleanup Columns Revenue (million), by Application 2025 & 2033
- Figure 3: North America Immunoaffinity Cleanup Columns Revenue Share (%), by Application 2025 & 2033
- Figure 4: North America Immunoaffinity Cleanup Columns Revenue (million), by Type 2025 & 2033
- Figure 5: North America Immunoaffinity Cleanup Columns Revenue Share (%), by Type 2025 & 2033
- Figure 6: North America Immunoaffinity Cleanup Columns Revenue (million), by Country 2025 & 2033
- Figure 7: North America Immunoaffinity Cleanup Columns Revenue Share (%), by Country 2025 & 2033
- Figure 8: South America Immunoaffinity Cleanup Columns Revenue (million), by Application 2025 & 2033
- Figure 9: South America Immunoaffinity Cleanup Columns Revenue Share (%), by Application 2025 & 2033
- Figure 10: South America Immunoaffinity Cleanup Columns Revenue (million), by Type 2025 & 2033
- Figure 11: South America Immunoaffinity Cleanup Columns Revenue Share (%), by Type 2025 & 2033
- Figure 12: South America Immunoaffinity Cleanup Columns Revenue (million), by Country 2025 & 2033
- Figure 13: South America Immunoaffinity Cleanup Columns Revenue Share (%), by Country 2025 & 2033
- Figure 14: Europe Immunoaffinity Cleanup Columns Revenue (million), by Application 2025 & 2033
- Figure 15: Europe Immunoaffinity Cleanup Columns Revenue Share (%), by Application 2025 & 2033
- Figure 16: Europe Immunoaffinity Cleanup Columns Revenue (million), by Type 2025 & 2033
- Figure 17: Europe Immunoaffinity Cleanup Columns Revenue Share (%), by Type 2025 & 2033
- Figure 18: Europe Immunoaffinity Cleanup Columns Revenue (million), by Country 2025 & 2033
- Figure 19: Europe Immunoaffinity Cleanup Columns Revenue Share (%), by Country 2025 & 2033
- Figure 20: Middle East & Africa Immunoaffinity Cleanup Columns Revenue (million), by Application 2025 & 2033
- Figure 21: Middle East & Africa Immunoaffinity Cleanup Columns Revenue Share (%), by Application 2025 & 2033
- Figure 22: Middle East & Africa Immunoaffinity Cleanup Columns Revenue (million), by Type 2025 & 2033
- Figure 23: Middle East & Africa Immunoaffinity Cleanup Columns Revenue Share (%), by Type 2025 & 2033
- Figure 24: Middle East & Africa Immunoaffinity Cleanup Columns Revenue (million), by Country 2025 & 2033
- Figure 25: Middle East & Africa Immunoaffinity Cleanup Columns Revenue Share (%), by Country 2025 & 2033
- Figure 26: Asia Pacific Immunoaffinity Cleanup Columns Revenue (million), by Application 2025 & 2033
- Figure 27: Asia Pacific Immunoaffinity Cleanup Columns Revenue Share (%), by Application 2025 & 2033
- Figure 28: Asia Pacific Immunoaffinity Cleanup Columns Revenue (million), by Type 2025 & 2033
- Figure 29: Asia Pacific Immunoaffinity Cleanup Columns Revenue Share (%), by Type 2025 & 2033
- Figure 30: Asia Pacific Immunoaffinity Cleanup Columns Revenue (million), by Country 2025 & 2033
- Figure 31: Asia Pacific Immunoaffinity Cleanup Columns Revenue Share (%), by Country 2025 & 2033
List of Tables
- Table 1: Global Immunoaffinity Cleanup Columns Revenue million Forecast, by Application 2020 & 2033
- Table 2: Global Immunoaffinity Cleanup Columns Revenue million Forecast, by Type 2020 & 2033
- Table 3: Global Immunoaffinity Cleanup Columns Revenue million Forecast, by Region 2020 & 2033
- Table 4: Global Immunoaffinity Cleanup Columns Revenue million Forecast, by Application 2020 & 2033
- Table 5: Global Immunoaffinity Cleanup Columns Revenue million Forecast, by Type 2020 & 2033
- Table 6: Global Immunoaffinity Cleanup Columns Revenue million Forecast, by Country 2020 & 2033
- Table 7: United States Immunoaffinity Cleanup Columns Revenue (million) Forecast, by Application 2020 & 2033
- Table 8: Canada Immunoaffinity Cleanup Columns Revenue (million) Forecast, by Application 2020 & 2033
- Table 9: Mexico Immunoaffinity Cleanup Columns Revenue (million) Forecast, by Application 2020 & 2033
- Table 10: Global Immunoaffinity Cleanup Columns Revenue million Forecast, by Application 2020 & 2033
- Table 11: Global Immunoaffinity Cleanup Columns Revenue million Forecast, by Type 2020 & 2033
- Table 12: Global Immunoaffinity Cleanup Columns Revenue million Forecast, by Country 2020 & 2033
- Table 13: Brazil Immunoaffinity Cleanup Columns Revenue (million) Forecast, by Application 2020 & 2033
- Table 14: Argentina Immunoaffinity Cleanup Columns Revenue (million) Forecast, by Application 2020 & 2033
- Table 15: Rest of South America Immunoaffinity Cleanup Columns Revenue (million) Forecast, by Application 2020 & 2033
- Table 16: Global Immunoaffinity Cleanup Columns Revenue million Forecast, by Application 2020 & 2033
- Table 17: Global Immunoaffinity Cleanup Columns Revenue million Forecast, by Type 2020 & 2033
- Table 18: Global Immunoaffinity Cleanup Columns Revenue million Forecast, by Country 2020 & 2033
- Table 19: United Kingdom Immunoaffinity Cleanup Columns Revenue (million) Forecast, by Application 2020 & 2033
- Table 20: Germany Immunoaffinity Cleanup Columns Revenue (million) Forecast, by Application 2020 & 2033
- Table 21: France Immunoaffinity Cleanup Columns Revenue (million) Forecast, by Application 2020 & 2033
- Table 22: Italy Immunoaffinity Cleanup Columns Revenue (million) Forecast, by Application 2020 & 2033
- Table 23: Spain Immunoaffinity Cleanup Columns Revenue (million) Forecast, by Application 2020 & 2033
- Table 24: Russia Immunoaffinity Cleanup Columns Revenue (million) Forecast, by Application 2020 & 2033
- Table 25: Benelux Immunoaffinity Cleanup Columns Revenue (million) Forecast, by Application 2020 & 2033
- Table 26: Nordics Immunoaffinity Cleanup Columns Revenue (million) Forecast, by Application 2020 & 2033
- Table 27: Rest of Europe Immunoaffinity Cleanup Columns Revenue (million) Forecast, by Application 2020 & 2033
- Table 28: Global Immunoaffinity Cleanup Columns Revenue million Forecast, by Application 2020 & 2033
- Table 29: Global Immunoaffinity Cleanup Columns Revenue million Forecast, by Type 2020 & 2033
- Table 30: Global Immunoaffinity Cleanup Columns Revenue million Forecast, by Country 2020 & 2033
- Table 31: Turkey Immunoaffinity Cleanup Columns Revenue (million) Forecast, by Application 2020 & 2033
- Table 32: Israel Immunoaffinity Cleanup Columns Revenue (million) Forecast, by Application 2020 & 2033
- Table 33: GCC Immunoaffinity Cleanup Columns Revenue (million) Forecast, by Application 2020 & 2033
- Table 34: North Africa Immunoaffinity Cleanup Columns Revenue (million) Forecast, by Application 2020 & 2033
- Table 35: South Africa Immunoaffinity Cleanup Columns Revenue (million) Forecast, by Application 2020 & 2033
- Table 36: Rest of Middle East & Africa Immunoaffinity Cleanup Columns Revenue (million) Forecast, by Application 2020 & 2033
- Table 37: Global Immunoaffinity Cleanup Columns Revenue million Forecast, by Application 2020 & 2033
- Table 38: Global Immunoaffinity Cleanup Columns Revenue million Forecast, by Type 2020 & 2033
- Table 39: Global Immunoaffinity Cleanup Columns Revenue million Forecast, by Country 2020 & 2033
- Table 40: China Immunoaffinity Cleanup Columns Revenue (million) Forecast, by Application 2020 & 2033
- Table 41: India Immunoaffinity Cleanup Columns Revenue (million) Forecast, by Application 2020 & 2033
- Table 42: Japan Immunoaffinity Cleanup Columns Revenue (million) Forecast, by Application 2020 & 2033
- Table 43: South Korea Immunoaffinity Cleanup Columns Revenue (million) Forecast, by Application 2020 & 2033
- Table 44: ASEAN Immunoaffinity Cleanup Columns Revenue (million) Forecast, by Application 2020 & 2033
- Table 45: Oceania Immunoaffinity Cleanup Columns Revenue (million) Forecast, by Application 2020 & 2033
- Table 46: Rest of Asia Pacific Immunoaffinity Cleanup Columns Revenue (million) Forecast, by Application 2020 & 2033
Frequently Asked Questions
1. What is the projected Compound Annual Growth Rate (CAGR) of the Immunoaffinity Cleanup Columns?
The projected CAGR is approximately 6.5%.
2. Which companies are prominent players in the Immunoaffinity Cleanup Columns?
Key companies in the market include Gold Standard Diagnostics Horsham, LCTech, Shimadzu, Biotez Berlin, PerkinElmer, VICAM, Ring Biotechnology, R-Biopharm AG, CHROMATIFIC, Neogen, Shenzhen Bioeasy Biotechnology, Kwinbon Biotechnology, Shandong Meizheng Bio-Tech, Shandong Lvdu Bio-Sciences & Technology, Beijing Nano-Ace Technology, Pribolab, Jiangsu Suwei Micro-Biology Research, BIOCOMMA, Jiangsu Wisdom Engineering & Technology, Anavo, Prufunglab, Femdetection, Welch Materials, Wuhan Huamei Wisherkon Biotech, Shandong Vnya Bio-technology.
3. What are the main segments of the Immunoaffinity Cleanup Columns?
The market segments include Application, Type.
4. Can you provide details about the market size?
The market size is estimated to be USD 372 million as of 2022.
5. What are some drivers contributing to market growth?
N/A
6. What are the notable trends driving market growth?
N/A
7. Are there any restraints impacting market growth?
N/A
8. Can you provide examples of recent developments in the market?
N/A
9. What pricing options are available for accessing the report?
Pricing options include single-user, multi-user, and enterprise licenses priced at USD 4250.00, USD 6375.00, and USD 8500.00 respectively.
10. Is the market size provided in terms of value or volume?
The market size is provided in terms of value, measured in million.
11. Are there any specific market keywords associated with the report?
Yes, the market keyword associated with the report is "Immunoaffinity Cleanup Columns," which aids in identifying and referencing the specific market segment covered.
12. How do I determine which pricing option suits my needs best?
The pricing options vary based on user requirements and access needs. Individual users may opt for single-user licenses, while businesses requiring broader access may choose multi-user or enterprise licenses for cost-effective access to the report.
13. Are there any additional resources or data provided in the Immunoaffinity Cleanup Columns report?
While the report offers comprehensive insights, it's advisable to review the specific contents or supplementary materials provided to ascertain if additional resources or data are available.
14. How can I stay updated on further developments or reports in the Immunoaffinity Cleanup Columns?
To stay informed about further developments, trends, and reports in the Immunoaffinity Cleanup Columns, consider subscribing to industry newsletters, following relevant companies and organizations, or regularly checking reputable industry news sources and publications.
Methodology
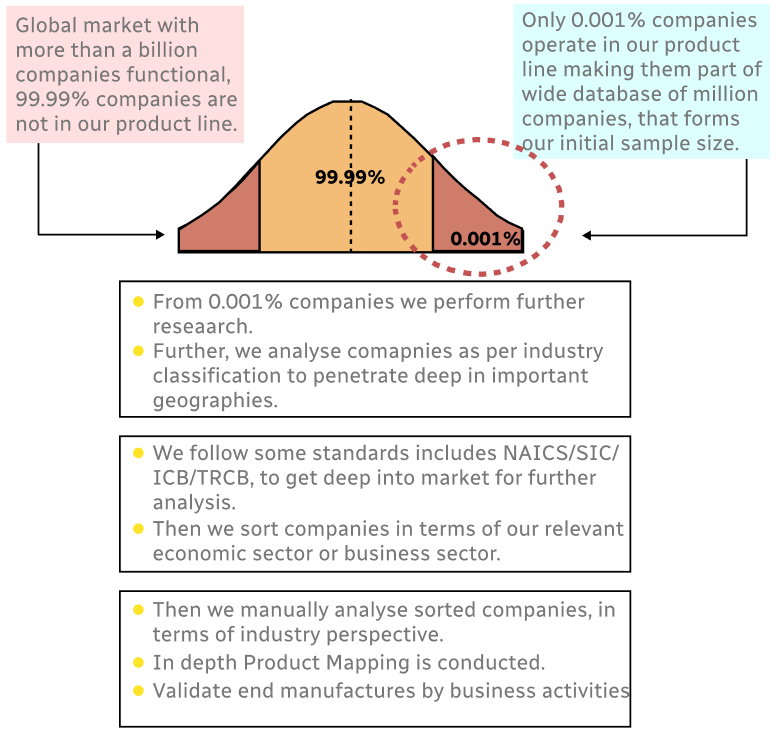
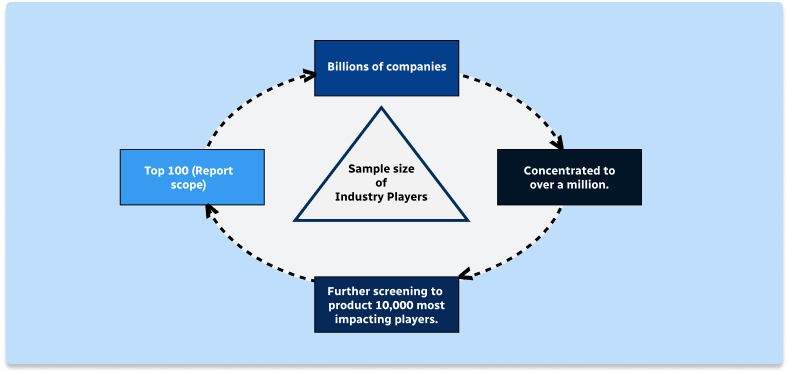
Step 1 - Identification of Relevant Samples Size from Population Database
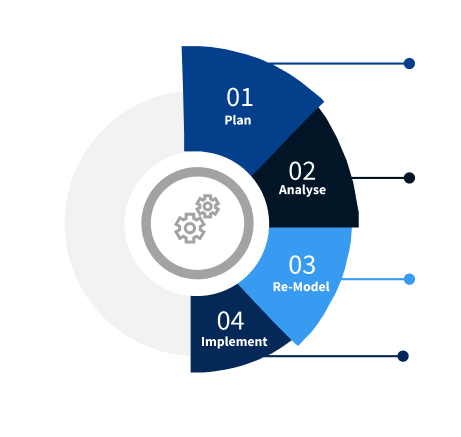
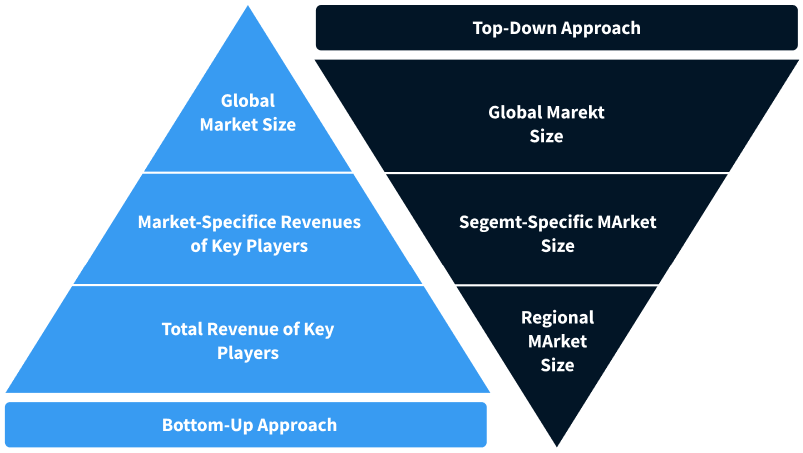
Step 2 - Approaches for Defining Global Market Size (Value, Volume* & Price*)
Note*: In applicable scenarios
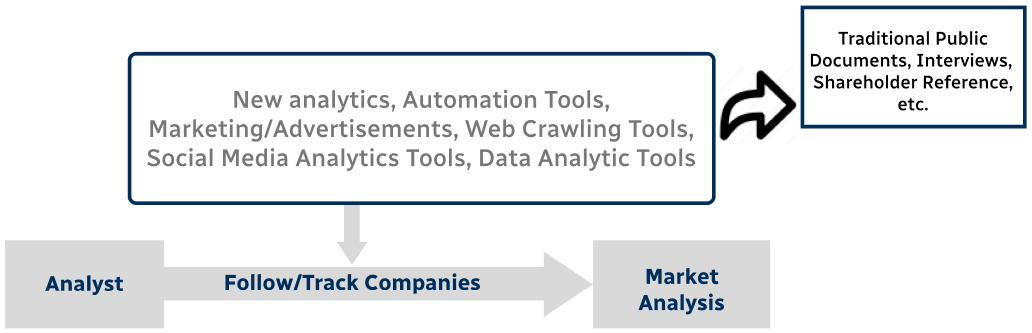
Step 3 - Data Sources
Primary Research
- Web Analytics
- Survey Reports
- Research Institute
- Latest Research Reports
- Opinion Leaders
Secondary Research
- Annual Reports
- White Paper
- Latest Press Release
- Industry Association
- Paid Database
- Investor Presentations
Step 4 - Data Triangulation
Involves using different sources of information in order to increase the validity of a study
These sources are likely to be stakeholders in a program - participants, other researchers, program staff, other community members, and so on.
Then we put all data in single framework & apply various statistical tools to find out the dynamic on the market.
During the analysis stage, feedback from the stakeholder groups would be compared to determine areas of agreement as well as areas of divergence