

Key Insights
The global Hot Pot Bean Sauce market is projected to reach an estimated USD 1.2 billion by 2024, exhibiting a Compound Annual Growth Rate (CAGR) of 7.5% through 2033. This growth is driven by the increasing global adoption of hot pot cuisine, characterized by its communal nature and diverse flavor profiles. The rising demand for ethnic foods and growing disposable incomes in emerging economies are key contributors. The online sales channel is experiencing rapid expansion due to e-commerce convenience and wider ingredient accessibility, enabling consumers to recreate authentic culinary experiences at home.
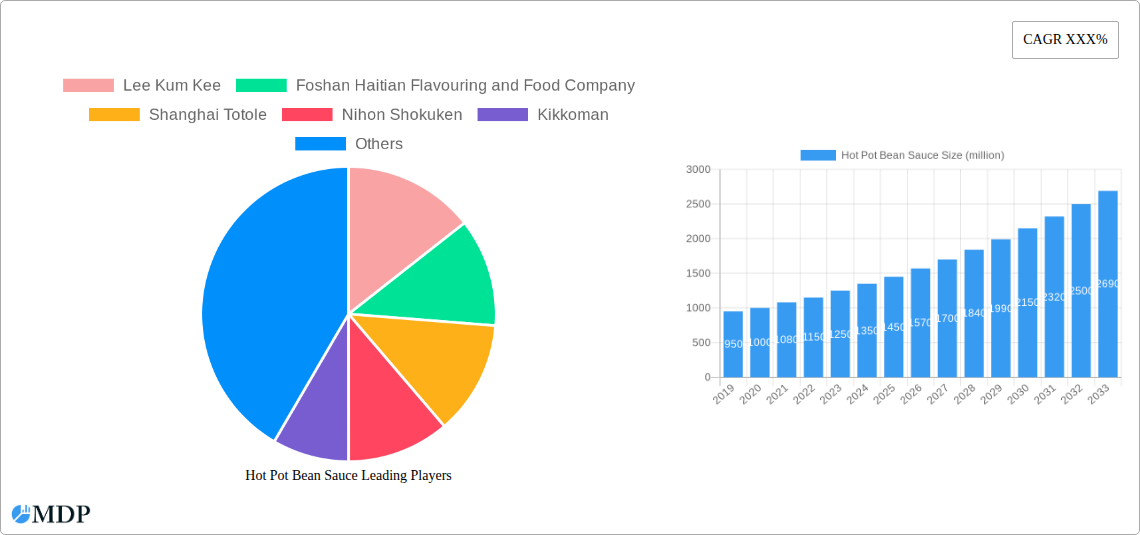
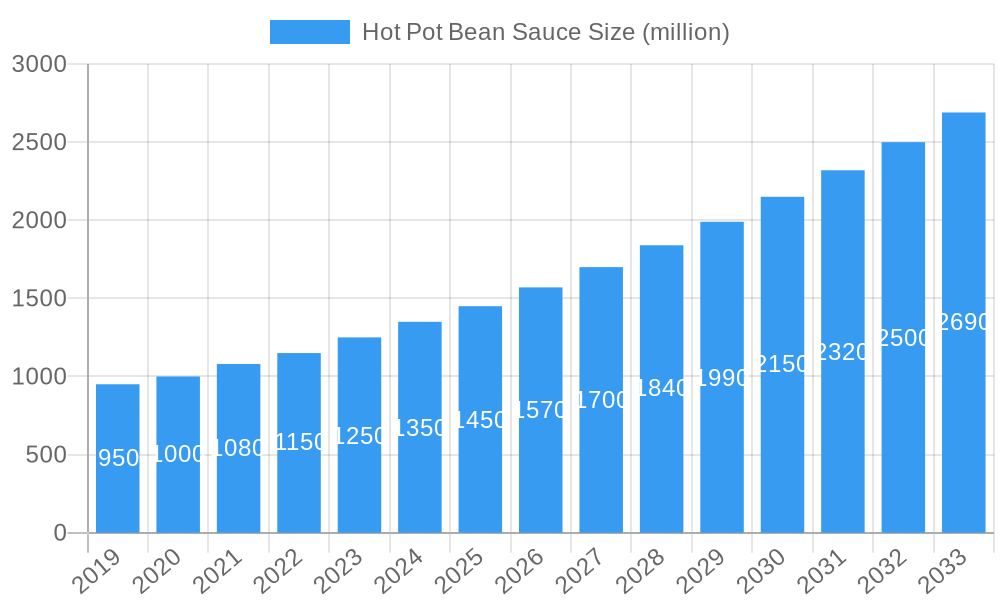
Hot Pot Bean Sauce Market Size (In Billion)
Market expansion is further supported by product innovation, including healthier and specialized hot pot bean sauce varieties addressing evolving consumer tastes. The growth of quick-service restaurants and casual dining featuring hot pot also drives demand. Key restraints include fluctuating raw material prices, particularly soybeans, and intense market competition. Nevertheless, the enduring appeal of hot pot and ongoing innovation in the bean sauce segment are expected to ensure sustained market growth.
Hot Pot Bean Sauce Company Market Share
Hot Pot Bean Sauce Market Research Report: Navigating Global Demand and Innovation (2019-2033)
This comprehensive hot pot bean sauce market report provides an in-depth analysis of the global bean paste for hot pot industry, offering critical insights for stakeholders. Covering the study period 2019–2033, with a base year of 2025, this report details historical trends, current market dynamics, and future projections. Discover actionable intelligence on hot pot seasonings, fermented bean paste, and Chinese hot pot sauces, crucial for understanding food ingredient markets and Asian food product growth.
Hot Pot Bean Sauce Market Dynamics & Concentration
The global hot pot bean sauce market exhibits a moderate to high concentration, with key players like Lee Kum Kee, Foshan Haitian Flavouring and Food Company, and Shanghai Totole holding significant market share. Innovation drivers are primarily fueled by evolving consumer preferences for diverse flavor profiles and the increasing demand for convenience, pushing manufacturers towards developing ready-to-use and premium hot pot sauce formulations. Regulatory frameworks, particularly concerning food safety standards and labeling requirements across different regions, play a crucial role in shaping market entry and product development. Product substitutes, such as other dipping sauces and spice blends, present a constant competitive challenge, necessitating continuous product differentiation and quality enhancement. End-user trends are increasingly leaning towards healthier options, with a growing demand for low-sodium, organic, and plant-based bean sauces. Mergers and acquisitions (M&A) activities are projected to remain a significant strategy for market consolidation and expansion, with an estimated 150 M&A deals expected over the forecast period. The market share of leading companies is estimated to range between 10 million to 25 million units annually.
Hot Pot Bean Sauce Industry Trends & Analysis
The hot pot bean sauce industry is poised for robust growth, driven by a confluence of factors including the escalating popularity of hot pot cuisine globally and the increasing adoption of diverse culinary experiences by consumers. The compound annual growth rate (CAGR) for the bean sauce market is projected at a healthy 7.5% during the forecast period of 2025–2033. Technological disruptions, such as advancements in fermentation techniques and ingredient processing, are enabling the creation of more sophisticated and shelf-stable hot pot bean sauces, catering to a wider consumer base. Consumer preferences are evolving rapidly, with a pronounced shift towards authentic flavors, artisanal products, and sauces that offer unique taste sensations, moving beyond traditional offerings. The competitive dynamics are intensifying, with both established global brands and agile local players vying for market dominance. This includes companies like Nihon Shokuken, Kikkoman, and Lao Gan Ma, who are actively innovating their product portfolios. Market penetration for specialized hot pot bean sauces is estimated to reach 65% in key markets by 2033. The increasing availability of these sauces through various sales channels, including online sales (to C) and offline sales (to C), further fuels market expansion. The growth is also significantly influenced by the burgeoning restaurant (to B) segment, where a demand for consistent and high-quality ingredients drives bulk purchases. The food processing plant (to B) segment also contributes to market growth as manufacturers integrate these sauces into their ready-to-eat meal solutions. The total market size is anticipated to reach USD 8,500 million by 2033.
Leading Markets & Segments in Hot Pot Bean Sauce
The Chinese Hot Pot segment is the undisputed leader in the hot pot bean sauce market, reflecting the dish's deep cultural roots and widespread appeal in Asia and beyond. This dominance is supported by robust economic policies fostering the growth of the culinary sector and well-established distribution infrastructure within China and surrounding regions. Furthermore, the widespread availability of authentic Chinese hot pot sauces and the strong brand recognition of companies like Yihai International and Teway Food contribute significantly to this segment's leadership.
Application Dominance:
- Restaurant (to B): This segment holds a commanding market share, driven by the high volume of hot pot consumption in dining establishments. Restaurants require consistent quality, diverse flavor options, and efficient supply chains, making specialized hot pot bean sauces indispensable. The estimated volume for this segment is 3,200 million units.
- Offline Sales (to C): Traditional retail channels remain a vital avenue for consumers to purchase hot pot bean sauces for home consumption. The accessibility and familiarity of supermarkets and local grocery stores contribute to its strong performance. This segment is estimated to generate 2,500 million in revenue.
- Online Sales (to C): The rapid growth of e-commerce platforms has significantly boosted online sales of hot pot bean sauces, catering to the convenience-seeking modern consumer. This segment is projected for substantial future expansion.
- Food Processing Plant (to B): This segment, while smaller, is crucial for the development of pre-packaged meals and convenience foods that incorporate hot pot flavors, further expanding the reach of these sauces.
Type Dominance:
- Chinese Hot Pot: As mentioned, this type of hot pot sauce dominates due to its traditional appeal and extensive variety of regional variations, offering a broad spectrum of flavors from spicy Sichuan to savory Northern styles.
- Japanese and Korean Hot Pot: While currently a smaller segment, these styles are experiencing significant growth due to the rising global popularity of K-culture and Japanese cuisine, creating demand for specialized sauces like those offered by Kewpie Food and House Foods.
- Western Hot Pot: This emerging segment, characterized by fusion flavors and innovative ingredients, presents an opportunity for new product development and market diversification, with companies like Ajinomoto exploring these frontiers. The market size for Chinese Hot Pot sauces is estimated at 6,000 million units.
Hot Pot Bean Sauce Product Developments
Product innovation in the hot pot bean sauce market is centered on enhancing flavor complexity, catering to diverse dietary needs, and improving convenience. Manufacturers are focusing on developing artisanal, gourmet, and limited-edition sauces that offer unique taste experiences, such as truffle-infused or fermented mushroom varieties. The integration of plant-based ingredients and the reduction of sodium content are key trends addressing health-conscious consumers. Furthermore, the development of concentrated pastes and meal kits streamlines preparation for home cooks and restaurants alike. Competitive advantages are being built through superior ingredient sourcing, traditional fermentation techniques, and appealing packaging that highlights authenticity and quality, as exemplified by brands like Zhumadian Wangshouyi Multi-Flavoured Spice Group.
Key Drivers of Hot Pot Bean Sauce Growth
The hot pot bean sauce market is propelled by several key drivers. The escalating global popularity of hot pot as a social and culinary experience is a primary catalyst, increasing demand across all segments. Evolving consumer tastes and a desire for authentic and diverse flavor profiles are encouraging product innovation and differentiation. Technological advancements in food processing and fermentation techniques are enabling the creation of higher-quality, shelf-stable, and healthier bean sauce options. Furthermore, favorable economic conditions in emerging markets and supportive government initiatives promoting food industry growth are contributing to market expansion. The growing trend of cross-cultural culinary exploration also fuels interest in Asian flavors, including those found in hot pot.
Challenges in the Hot Pot Bean Sauce Market
Despite strong growth prospects, the hot pot bean sauce market faces several challenges. Stringent food safety regulations and differing compliance standards across international markets can create barriers to entry and increase operational costs. Fluctuations in the prices of key raw materials, such as soybeans and chili peppers, can impact profitability and pricing strategies. Intense competition from both established brands and new market entrants necessitates continuous investment in product development and marketing. Supply chain disruptions, exacerbated by geopolitical factors and logistical complexities, can affect product availability and lead times. Consumer perception regarding the health implications of traditional fermented sauces also presents a challenge, requiring manufacturers to focus on health-oriented product lines. The market faces an estimated 10% impact from supply chain volatility annually.
Emerging Opportunities in Hot Pot Bean Sauce
Emerging opportunities in the hot pot bean sauce market lie in the continuous innovation of flavor profiles to cater to evolving global palates, including the development of plant-based and allergen-free options. The expansion of e-commerce channels presents a significant avenue for reaching a wider consumer base and driving direct-to-consumer sales. Strategic partnerships with food bloggers, influencers, and celebrity chefs can amplify brand visibility and product adoption. Furthermore, tapping into the growing demand for convenient meal solutions through the development of ready-to-cook hot pot kits and sauces for food processing plants offers substantial growth potential. Exploring niche markets, such as premium or organic bean sauces, can also unlock new revenue streams. The estimated market expansion in niche segments is projected at 20% annually.
Leading Players in the Hot Pot Bean Sauce Sector
- Lee Kum Kee
- Foshan Haitian Flavouring and Food Company
- Shanghai Totole
- Nihon Shokuken
- Kikkoman
- Lao Gan Ma
- Yihai International
- Teway Food
- Kewpie Food
- House Foods
- Ajinomoto
- Zhumadian Wangshouyi Multi-Flavoured Spice Group
- Hong Jiujiu
Key Milestones in Hot Pot Bean Sauce Industry
- 2019: Launch of a premium, organic range of Chinese hot pot bean sauces by a leading manufacturer, responding to growing health consciousness.
- 2020: Significant surge in online sales of hot pot bean sauces due to global lockdowns and increased home cooking.
- 2021: Major player, Foshan Haitian Flavouring and Food Company, announces a strategic acquisition to expand its international distribution network.
- 2022: Introduction of plant-based hot pot bean sauce alternatives by several companies, targeting vegan and vegetarian consumers.
- 2023: Increased investment in R&D for novel fermentation techniques to create more complex and nuanced flavor profiles.
- 2024: Launch of ready-to-eat hot pot meal kits featuring specialized bean sauces, enhancing convenience for consumers.
Strategic Outlook for Hot Pot Bean Sauce Market
The strategic outlook for the hot pot bean sauce market is overwhelmingly positive, driven by sustained global demand for authentic and convenient culinary experiences. Key growth accelerators include the continued expansion of hot pot cuisine into new geographical territories and the increasing diversification of flavor offerings to cater to a broader range of consumer preferences. Investments in product innovation, particularly in healthier and plant-based formulations, will be crucial for capturing evolving market trends. Strategic partnerships and aggressive marketing campaigns, especially through digital channels, will be vital for enhancing brand visibility and driving market penetration. The estimated future market growth is projected at USD 10,000 million by 2033.
Hot Pot Bean Sauce Segmentation
-
1. Application
- 1.1. Online Sales (to C)
- 1.2. Offline Sales (to C)
- 1.3. Restaurant (to B)
- 1.4. Food Processing Plant (to B)
-
2. Type
- 2.1. Chinese Hot Pot
- 2.2. Japanese and Korean Hot Pot
- 2.3. Western Hot Pot
Hot Pot Bean Sauce Segmentation By Geography
-
1. North America
- 1.1. United States
- 1.2. Canada
- 1.3. Mexico
-
2. South America
- 2.1. Brazil
- 2.2. Argentina
- 2.3. Rest of South America
-
3. Europe
- 3.1. United Kingdom
- 3.2. Germany
- 3.3. France
- 3.4. Italy
- 3.5. Spain
- 3.6. Russia
- 3.7. Benelux
- 3.8. Nordics
- 3.9. Rest of Europe
-
4. Middle East & Africa
- 4.1. Turkey
- 4.2. Israel
- 4.3. GCC
- 4.4. North Africa
- 4.5. South Africa
- 4.6. Rest of Middle East & Africa
-
5. Asia Pacific
- 5.1. China
- 5.2. India
- 5.3. Japan
- 5.4. South Korea
- 5.5. ASEAN
- 5.6. Oceania
- 5.7. Rest of Asia Pacific
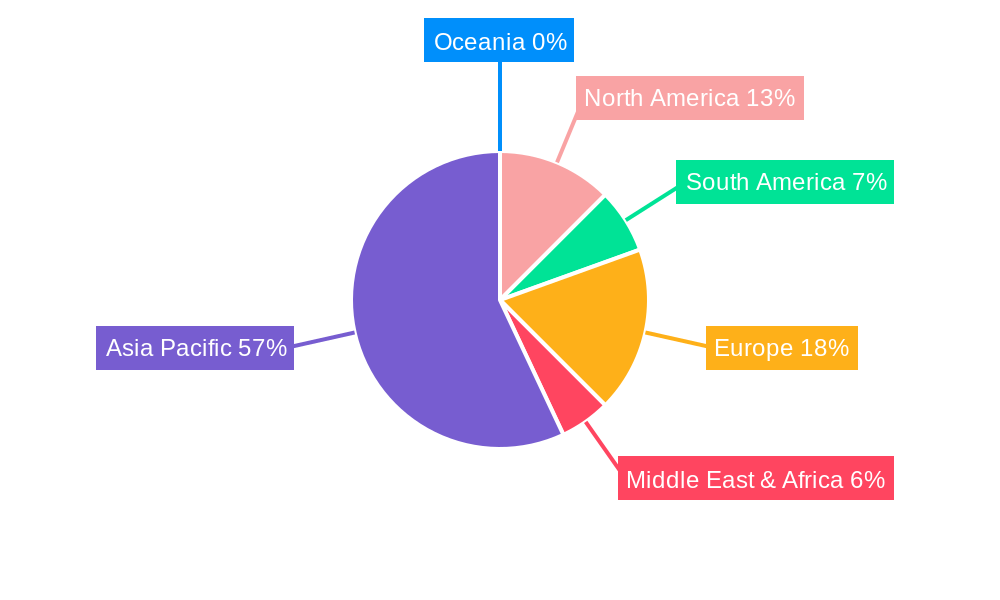
Hot Pot Bean Sauce Regional Market Share
Geographic Coverage of Hot Pot Bean Sauce
Hot Pot Bean Sauce REPORT HIGHLIGHTS
| Aspects | Details |
|---|---|
| Study Period | 2020-2034 |
| Base Year | 2025 |
| Estimated Year | 2026 |
| Forecast Period | 2026-2034 |
| Historical Period | 2020-2025 |
| Growth Rate | CAGR of 7.5% from 2020-2034 |
| Segmentation |
|
Table of Contents
- 1. Introduction
- 1.1. Research Scope
- 1.2. Market Segmentation
- 1.3. Research Objective
- 1.4. Definitions and Assumptions
- 2. Executive Summary
- 2.1. Market Snapshot
- 3. Market Dynamics
- 3.1. Market Drivers
- 3.2. Market Restrains
- 3.3. Market Trends
- 3.4. Market Opportunities
- 4. Market Factor Analysis
- 4.1. Porters Five Forces
- 4.1.1. Bargaining Power of Suppliers
- 4.1.2. Bargaining Power of Buyers
- 4.1.3. Threat of New Entrants
- 4.1.4. Threat of Substitutes
- 4.1.5. Competitive Rivalry
- 4.2. PESTEL analysis
- 4.3. BCG Analysis
- 4.3.1. Stars (High Growth, High Market Share)
- 4.3.2. Cash Cows (Low Growth, High Market Share)
- 4.3.3. Question Mark (High Growth, Low Market Share)
- 4.3.4. Dogs (Low Growth, Low Market Share)
- 4.4. Ansoff Matrix Analysis
- 4.5. Supply Chain Analysis
- 4.6. Regulatory Landscape
- 4.7. Current Market Potential and Opportunity Assessment (TAM–SAM–SOM Framework)
- 4.8. MDP Analyst Note
- 4.1. Porters Five Forces
- 5. Market Analysis, Insights and Forecast 2021-2033
- 5.1. Market Analysis, Insights and Forecast - by Application
- 5.1.1. Online Sales (to C)
- 5.1.2. Offline Sales (to C)
- 5.1.3. Restaurant (to B)
- 5.1.4. Food Processing Plant (to B)
- 5.2. Market Analysis, Insights and Forecast - by Type
- 5.2.1. Chinese Hot Pot
- 5.2.2. Japanese and Korean Hot Pot
- 5.2.3. Western Hot Pot
- 5.3. Market Analysis, Insights and Forecast - by Region
- 5.3.1. North America
- 5.3.2. South America
- 5.3.3. Europe
- 5.3.4. Middle East & Africa
- 5.3.5. Asia Pacific
- 5.1. Market Analysis, Insights and Forecast - by Application
- 6. Global Hot Pot Bean Sauce Analysis, Insights and Forecast, 2021-2033
- 6.1. Market Analysis, Insights and Forecast - by Application
- 6.1.1. Online Sales (to C)
- 6.1.2. Offline Sales (to C)
- 6.1.3. Restaurant (to B)
- 6.1.4. Food Processing Plant (to B)
- 6.2. Market Analysis, Insights and Forecast - by Type
- 6.2.1. Chinese Hot Pot
- 6.2.2. Japanese and Korean Hot Pot
- 6.2.3. Western Hot Pot
- 6.1. Market Analysis, Insights and Forecast - by Application
- 7. North America Hot Pot Bean Sauce Analysis, Insights and Forecast, 2020-2032
- 7.1. Market Analysis, Insights and Forecast - by Application
- 7.1.1. Online Sales (to C)
- 7.1.2. Offline Sales (to C)
- 7.1.3. Restaurant (to B)
- 7.1.4. Food Processing Plant (to B)
- 7.2. Market Analysis, Insights and Forecast - by Type
- 7.2.1. Chinese Hot Pot
- 7.2.2. Japanese and Korean Hot Pot
- 7.2.3. Western Hot Pot
- 7.1. Market Analysis, Insights and Forecast - by Application
- 8. South America Hot Pot Bean Sauce Analysis, Insights and Forecast, 2020-2032
- 8.1. Market Analysis, Insights and Forecast - by Application
- 8.1.1. Online Sales (to C)
- 8.1.2. Offline Sales (to C)
- 8.1.3. Restaurant (to B)
- 8.1.4. Food Processing Plant (to B)
- 8.2. Market Analysis, Insights and Forecast - by Type
- 8.2.1. Chinese Hot Pot
- 8.2.2. Japanese and Korean Hot Pot
- 8.2.3. Western Hot Pot
- 8.1. Market Analysis, Insights and Forecast - by Application
- 9. Europe Hot Pot Bean Sauce Analysis, Insights and Forecast, 2020-2032
- 9.1. Market Analysis, Insights and Forecast - by Application
- 9.1.1. Online Sales (to C)
- 9.1.2. Offline Sales (to C)
- 9.1.3. Restaurant (to B)
- 9.1.4. Food Processing Plant (to B)
- 9.2. Market Analysis, Insights and Forecast - by Type
- 9.2.1. Chinese Hot Pot
- 9.2.2. Japanese and Korean Hot Pot
- 9.2.3. Western Hot Pot
- 9.1. Market Analysis, Insights and Forecast - by Application
- 10. Middle East & Africa Hot Pot Bean Sauce Analysis, Insights and Forecast, 2020-2032
- 10.1. Market Analysis, Insights and Forecast - by Application
- 10.1.1. Online Sales (to C)
- 10.1.2. Offline Sales (to C)
- 10.1.3. Restaurant (to B)
- 10.1.4. Food Processing Plant (to B)
- 10.2. Market Analysis, Insights and Forecast - by Type
- 10.2.1. Chinese Hot Pot
- 10.2.2. Japanese and Korean Hot Pot
- 10.2.3. Western Hot Pot
- 10.1. Market Analysis, Insights and Forecast - by Application
- 11. Asia Pacific Hot Pot Bean Sauce Analysis, Insights and Forecast, 2020-2032
- 11.1. Market Analysis, Insights and Forecast - by Application
- 11.1.1. Online Sales (to C)
- 11.1.2. Offline Sales (to C)
- 11.1.3. Restaurant (to B)
- 11.1.4. Food Processing Plant (to B)
- 11.2. Market Analysis, Insights and Forecast - by Type
- 11.2.1. Chinese Hot Pot
- 11.2.2. Japanese and Korean Hot Pot
- 11.2.3. Western Hot Pot
- 11.1. Market Analysis, Insights and Forecast - by Application
- 12. Competitive Analysis
- 12.1. Company Profiles
- 12.1.1 Lee Kum Kee
- 12.1.1.1. Company Overview
- 12.1.1.2. Products
- 12.1.1.3. Company Financials
- 12.1.1.4. SWOT Analysis
- 12.1.2 Foshan Haitian Flavouring and Food Company
- 12.1.2.1. Company Overview
- 12.1.2.2. Products
- 12.1.2.3. Company Financials
- 12.1.2.4. SWOT Analysis
- 12.1.3 Shanghai Totole
- 12.1.3.1. Company Overview
- 12.1.3.2. Products
- 12.1.3.3. Company Financials
- 12.1.3.4. SWOT Analysis
- 12.1.4 Nihon Shokuken
- 12.1.4.1. Company Overview
- 12.1.4.2. Products
- 12.1.4.3. Company Financials
- 12.1.4.4. SWOT Analysis
- 12.1.5 Kikkoman
- 12.1.5.1. Company Overview
- 12.1.5.2. Products
- 12.1.5.3. Company Financials
- 12.1.5.4. SWOT Analysis
- 12.1.6 Lao Gan Ma
- 12.1.6.1. Company Overview
- 12.1.6.2. Products
- 12.1.6.3. Company Financials
- 12.1.6.4. SWOT Analysis
- 12.1.7 Yihai International
- 12.1.7.1. Company Overview
- 12.1.7.2. Products
- 12.1.7.3. Company Financials
- 12.1.7.4. SWOT Analysis
- 12.1.8 Teway Food
- 12.1.8.1. Company Overview
- 12.1.8.2. Products
- 12.1.8.3. Company Financials
- 12.1.8.4. SWOT Analysis
- 12.1.9 Kewpie Food
- 12.1.9.1. Company Overview
- 12.1.9.2. Products
- 12.1.9.3. Company Financials
- 12.1.9.4. SWOT Analysis
- 12.1.10 House Foods
- 12.1.10.1. Company Overview
- 12.1.10.2. Products
- 12.1.10.3. Company Financials
- 12.1.10.4. SWOT Analysis
- 12.1.11 Ajinomoto
- 12.1.11.1. Company Overview
- 12.1.11.2. Products
- 12.1.11.3. Company Financials
- 12.1.11.4. SWOT Analysis
- 12.1.12 Zhumadian Wangshouyi Multi-Flavoured Spice Group
- 12.1.12.1. Company Overview
- 12.1.12.2. Products
- 12.1.12.3. Company Financials
- 12.1.12.4. SWOT Analysis
- 12.1.13 Hong Jiujiu
- 12.1.13.1. Company Overview
- 12.1.13.2. Products
- 12.1.13.3. Company Financials
- 12.1.13.4. SWOT Analysis
- 12.1.1 Lee Kum Kee
- 12.2. Market Entropy
- 12.2.1 Company's Key Areas Served
- 12.2.2 Recent Developments
- 12.3. Company Market Share Analysis 2025
- 12.3.1 Top 5 Companies Market Share Analysis
- 12.3.2 Top 3 Companies Market Share Analysis
- 12.4. List of Potential Customers
- 13. Research Methodology
List of Figures
- Figure 1: Global Hot Pot Bean Sauce Revenue Breakdown (billion, %) by Region 2025 & 2033
- Figure 2: Global Hot Pot Bean Sauce Volume Breakdown (K, %) by Region 2025 & 2033
- Figure 3: North America Hot Pot Bean Sauce Revenue (billion), by Application 2025 & 2033
- Figure 4: North America Hot Pot Bean Sauce Volume (K), by Application 2025 & 2033
- Figure 5: North America Hot Pot Bean Sauce Revenue Share (%), by Application 2025 & 2033
- Figure 6: North America Hot Pot Bean Sauce Volume Share (%), by Application 2025 & 2033
- Figure 7: North America Hot Pot Bean Sauce Revenue (billion), by Type 2025 & 2033
- Figure 8: North America Hot Pot Bean Sauce Volume (K), by Type 2025 & 2033
- Figure 9: North America Hot Pot Bean Sauce Revenue Share (%), by Type 2025 & 2033
- Figure 10: North America Hot Pot Bean Sauce Volume Share (%), by Type 2025 & 2033
- Figure 11: North America Hot Pot Bean Sauce Revenue (billion), by Country 2025 & 2033
- Figure 12: North America Hot Pot Bean Sauce Volume (K), by Country 2025 & 2033
- Figure 13: North America Hot Pot Bean Sauce Revenue Share (%), by Country 2025 & 2033
- Figure 14: North America Hot Pot Bean Sauce Volume Share (%), by Country 2025 & 2033
- Figure 15: South America Hot Pot Bean Sauce Revenue (billion), by Application 2025 & 2033
- Figure 16: South America Hot Pot Bean Sauce Volume (K), by Application 2025 & 2033
- Figure 17: South America Hot Pot Bean Sauce Revenue Share (%), by Application 2025 & 2033
- Figure 18: South America Hot Pot Bean Sauce Volume Share (%), by Application 2025 & 2033
- Figure 19: South America Hot Pot Bean Sauce Revenue (billion), by Type 2025 & 2033
- Figure 20: South America Hot Pot Bean Sauce Volume (K), by Type 2025 & 2033
- Figure 21: South America Hot Pot Bean Sauce Revenue Share (%), by Type 2025 & 2033
- Figure 22: South America Hot Pot Bean Sauce Volume Share (%), by Type 2025 & 2033
- Figure 23: South America Hot Pot Bean Sauce Revenue (billion), by Country 2025 & 2033
- Figure 24: South America Hot Pot Bean Sauce Volume (K), by Country 2025 & 2033
- Figure 25: South America Hot Pot Bean Sauce Revenue Share (%), by Country 2025 & 2033
- Figure 26: South America Hot Pot Bean Sauce Volume Share (%), by Country 2025 & 2033
- Figure 27: Europe Hot Pot Bean Sauce Revenue (billion), by Application 2025 & 2033
- Figure 28: Europe Hot Pot Bean Sauce Volume (K), by Application 2025 & 2033
- Figure 29: Europe Hot Pot Bean Sauce Revenue Share (%), by Application 2025 & 2033
- Figure 30: Europe Hot Pot Bean Sauce Volume Share (%), by Application 2025 & 2033
- Figure 31: Europe Hot Pot Bean Sauce Revenue (billion), by Type 2025 & 2033
- Figure 32: Europe Hot Pot Bean Sauce Volume (K), by Type 2025 & 2033
- Figure 33: Europe Hot Pot Bean Sauce Revenue Share (%), by Type 2025 & 2033
- Figure 34: Europe Hot Pot Bean Sauce Volume Share (%), by Type 2025 & 2033
- Figure 35: Europe Hot Pot Bean Sauce Revenue (billion), by Country 2025 & 2033
- Figure 36: Europe Hot Pot Bean Sauce Volume (K), by Country 2025 & 2033
- Figure 37: Europe Hot Pot Bean Sauce Revenue Share (%), by Country 2025 & 2033
- Figure 38: Europe Hot Pot Bean Sauce Volume Share (%), by Country 2025 & 2033
- Figure 39: Middle East & Africa Hot Pot Bean Sauce Revenue (billion), by Application 2025 & 2033
- Figure 40: Middle East & Africa Hot Pot Bean Sauce Volume (K), by Application 2025 & 2033
- Figure 41: Middle East & Africa Hot Pot Bean Sauce Revenue Share (%), by Application 2025 & 2033
- Figure 42: Middle East & Africa Hot Pot Bean Sauce Volume Share (%), by Application 2025 & 2033
- Figure 43: Middle East & Africa Hot Pot Bean Sauce Revenue (billion), by Type 2025 & 2033
- Figure 44: Middle East & Africa Hot Pot Bean Sauce Volume (K), by Type 2025 & 2033
- Figure 45: Middle East & Africa Hot Pot Bean Sauce Revenue Share (%), by Type 2025 & 2033
- Figure 46: Middle East & Africa Hot Pot Bean Sauce Volume Share (%), by Type 2025 & 2033
- Figure 47: Middle East & Africa Hot Pot Bean Sauce Revenue (billion), by Country 2025 & 2033
- Figure 48: Middle East & Africa Hot Pot Bean Sauce Volume (K), by Country 2025 & 2033
- Figure 49: Middle East & Africa Hot Pot Bean Sauce Revenue Share (%), by Country 2025 & 2033
- Figure 50: Middle East & Africa Hot Pot Bean Sauce Volume Share (%), by Country 2025 & 2033
- Figure 51: Asia Pacific Hot Pot Bean Sauce Revenue (billion), by Application 2025 & 2033
- Figure 52: Asia Pacific Hot Pot Bean Sauce Volume (K), by Application 2025 & 2033
- Figure 53: Asia Pacific Hot Pot Bean Sauce Revenue Share (%), by Application 2025 & 2033
- Figure 54: Asia Pacific Hot Pot Bean Sauce Volume Share (%), by Application 2025 & 2033
- Figure 55: Asia Pacific Hot Pot Bean Sauce Revenue (billion), by Type 2025 & 2033
- Figure 56: Asia Pacific Hot Pot Bean Sauce Volume (K), by Type 2025 & 2033
- Figure 57: Asia Pacific Hot Pot Bean Sauce Revenue Share (%), by Type 2025 & 2033
- Figure 58: Asia Pacific Hot Pot Bean Sauce Volume Share (%), by Type 2025 & 2033
- Figure 59: Asia Pacific Hot Pot Bean Sauce Revenue (billion), by Country 2025 & 2033
- Figure 60: Asia Pacific Hot Pot Bean Sauce Volume (K), by Country 2025 & 2033
- Figure 61: Asia Pacific Hot Pot Bean Sauce Revenue Share (%), by Country 2025 & 2033
- Figure 62: Asia Pacific Hot Pot Bean Sauce Volume Share (%), by Country 2025 & 2033
List of Tables
- Table 1: Global Hot Pot Bean Sauce Revenue billion Forecast, by Application 2020 & 2033
- Table 2: Global Hot Pot Bean Sauce Volume K Forecast, by Application 2020 & 2033
- Table 3: Global Hot Pot Bean Sauce Revenue billion Forecast, by Type 2020 & 2033
- Table 4: Global Hot Pot Bean Sauce Volume K Forecast, by Type 2020 & 2033
- Table 5: Global Hot Pot Bean Sauce Revenue billion Forecast, by Region 2020 & 2033
- Table 6: Global Hot Pot Bean Sauce Volume K Forecast, by Region 2020 & 2033
- Table 7: Global Hot Pot Bean Sauce Revenue billion Forecast, by Application 2020 & 2033
- Table 8: Global Hot Pot Bean Sauce Volume K Forecast, by Application 2020 & 2033
- Table 9: Global Hot Pot Bean Sauce Revenue billion Forecast, by Type 2020 & 2033
- Table 10: Global Hot Pot Bean Sauce Volume K Forecast, by Type 2020 & 2033
- Table 11: Global Hot Pot Bean Sauce Revenue billion Forecast, by Country 2020 & 2033
- Table 12: Global Hot Pot Bean Sauce Volume K Forecast, by Country 2020 & 2033
- Table 13: United States Hot Pot Bean Sauce Revenue (billion) Forecast, by Application 2020 & 2033
- Table 14: United States Hot Pot Bean Sauce Volume (K) Forecast, by Application 2020 & 2033
- Table 15: Canada Hot Pot Bean Sauce Revenue (billion) Forecast, by Application 2020 & 2033
- Table 16: Canada Hot Pot Bean Sauce Volume (K) Forecast, by Application 2020 & 2033
- Table 17: Mexico Hot Pot Bean Sauce Revenue (billion) Forecast, by Application 2020 & 2033
- Table 18: Mexico Hot Pot Bean Sauce Volume (K) Forecast, by Application 2020 & 2033
- Table 19: Global Hot Pot Bean Sauce Revenue billion Forecast, by Application 2020 & 2033
- Table 20: Global Hot Pot Bean Sauce Volume K Forecast, by Application 2020 & 2033
- Table 21: Global Hot Pot Bean Sauce Revenue billion Forecast, by Type 2020 & 2033
- Table 22: Global Hot Pot Bean Sauce Volume K Forecast, by Type 2020 & 2033
- Table 23: Global Hot Pot Bean Sauce Revenue billion Forecast, by Country 2020 & 2033
- Table 24: Global Hot Pot Bean Sauce Volume K Forecast, by Country 2020 & 2033
- Table 25: Brazil Hot Pot Bean Sauce Revenue (billion) Forecast, by Application 2020 & 2033
- Table 26: Brazil Hot Pot Bean Sauce Volume (K) Forecast, by Application 2020 & 2033
- Table 27: Argentina Hot Pot Bean Sauce Revenue (billion) Forecast, by Application 2020 & 2033
- Table 28: Argentina Hot Pot Bean Sauce Volume (K) Forecast, by Application 2020 & 2033
- Table 29: Rest of South America Hot Pot Bean Sauce Revenue (billion) Forecast, by Application 2020 & 2033
- Table 30: Rest of South America Hot Pot Bean Sauce Volume (K) Forecast, by Application 2020 & 2033
- Table 31: Global Hot Pot Bean Sauce Revenue billion Forecast, by Application 2020 & 2033
- Table 32: Global Hot Pot Bean Sauce Volume K Forecast, by Application 2020 & 2033
- Table 33: Global Hot Pot Bean Sauce Revenue billion Forecast, by Type 2020 & 2033
- Table 34: Global Hot Pot Bean Sauce Volume K Forecast, by Type 2020 & 2033
- Table 35: Global Hot Pot Bean Sauce Revenue billion Forecast, by Country 2020 & 2033
- Table 36: Global Hot Pot Bean Sauce Volume K Forecast, by Country 2020 & 2033
- Table 37: United Kingdom Hot Pot Bean Sauce Revenue (billion) Forecast, by Application 2020 & 2033
- Table 38: United Kingdom Hot Pot Bean Sauce Volume (K) Forecast, by Application 2020 & 2033
- Table 39: Germany Hot Pot Bean Sauce Revenue (billion) Forecast, by Application 2020 & 2033
- Table 40: Germany Hot Pot Bean Sauce Volume (K) Forecast, by Application 2020 & 2033
- Table 41: France Hot Pot Bean Sauce Revenue (billion) Forecast, by Application 2020 & 2033
- Table 42: France Hot Pot Bean Sauce Volume (K) Forecast, by Application 2020 & 2033
- Table 43: Italy Hot Pot Bean Sauce Revenue (billion) Forecast, by Application 2020 & 2033
- Table 44: Italy Hot Pot Bean Sauce Volume (K) Forecast, by Application 2020 & 2033
- Table 45: Spain Hot Pot Bean Sauce Revenue (billion) Forecast, by Application 2020 & 2033
- Table 46: Spain Hot Pot Bean Sauce Volume (K) Forecast, by Application 2020 & 2033
- Table 47: Russia Hot Pot Bean Sauce Revenue (billion) Forecast, by Application 2020 & 2033
- Table 48: Russia Hot Pot Bean Sauce Volume (K) Forecast, by Application 2020 & 2033
- Table 49: Benelux Hot Pot Bean Sauce Revenue (billion) Forecast, by Application 2020 & 2033
- Table 50: Benelux Hot Pot Bean Sauce Volume (K) Forecast, by Application 2020 & 2033
- Table 51: Nordics Hot Pot Bean Sauce Revenue (billion) Forecast, by Application 2020 & 2033
- Table 52: Nordics Hot Pot Bean Sauce Volume (K) Forecast, by Application 2020 & 2033
- Table 53: Rest of Europe Hot Pot Bean Sauce Revenue (billion) Forecast, by Application 2020 & 2033
- Table 54: Rest of Europe Hot Pot Bean Sauce Volume (K) Forecast, by Application 2020 & 2033
- Table 55: Global Hot Pot Bean Sauce Revenue billion Forecast, by Application 2020 & 2033
- Table 56: Global Hot Pot Bean Sauce Volume K Forecast, by Application 2020 & 2033
- Table 57: Global Hot Pot Bean Sauce Revenue billion Forecast, by Type 2020 & 2033
- Table 58: Global Hot Pot Bean Sauce Volume K Forecast, by Type 2020 & 2033
- Table 59: Global Hot Pot Bean Sauce Revenue billion Forecast, by Country 2020 & 2033
- Table 60: Global Hot Pot Bean Sauce Volume K Forecast, by Country 2020 & 2033
- Table 61: Turkey Hot Pot Bean Sauce Revenue (billion) Forecast, by Application 2020 & 2033
- Table 62: Turkey Hot Pot Bean Sauce Volume (K) Forecast, by Application 2020 & 2033
- Table 63: Israel Hot Pot Bean Sauce Revenue (billion) Forecast, by Application 2020 & 2033
- Table 64: Israel Hot Pot Bean Sauce Volume (K) Forecast, by Application 2020 & 2033
- Table 65: GCC Hot Pot Bean Sauce Revenue (billion) Forecast, by Application 2020 & 2033
- Table 66: GCC Hot Pot Bean Sauce Volume (K) Forecast, by Application 2020 & 2033
- Table 67: North Africa Hot Pot Bean Sauce Revenue (billion) Forecast, by Application 2020 & 2033
- Table 68: North Africa Hot Pot Bean Sauce Volume (K) Forecast, by Application 2020 & 2033
- Table 69: South Africa Hot Pot Bean Sauce Revenue (billion) Forecast, by Application 2020 & 2033
- Table 70: South Africa Hot Pot Bean Sauce Volume (K) Forecast, by Application 2020 & 2033
- Table 71: Rest of Middle East & Africa Hot Pot Bean Sauce Revenue (billion) Forecast, by Application 2020 & 2033
- Table 72: Rest of Middle East & Africa Hot Pot Bean Sauce Volume (K) Forecast, by Application 2020 & 2033
- Table 73: Global Hot Pot Bean Sauce Revenue billion Forecast, by Application 2020 & 2033
- Table 74: Global Hot Pot Bean Sauce Volume K Forecast, by Application 2020 & 2033
- Table 75: Global Hot Pot Bean Sauce Revenue billion Forecast, by Type 2020 & 2033
- Table 76: Global Hot Pot Bean Sauce Volume K Forecast, by Type 2020 & 2033
- Table 77: Global Hot Pot Bean Sauce Revenue billion Forecast, by Country 2020 & 2033
- Table 78: Global Hot Pot Bean Sauce Volume K Forecast, by Country 2020 & 2033
- Table 79: China Hot Pot Bean Sauce Revenue (billion) Forecast, by Application 2020 & 2033
- Table 80: China Hot Pot Bean Sauce Volume (K) Forecast, by Application 2020 & 2033
- Table 81: India Hot Pot Bean Sauce Revenue (billion) Forecast, by Application 2020 & 2033
- Table 82: India Hot Pot Bean Sauce Volume (K) Forecast, by Application 2020 & 2033
- Table 83: Japan Hot Pot Bean Sauce Revenue (billion) Forecast, by Application 2020 & 2033
- Table 84: Japan Hot Pot Bean Sauce Volume (K) Forecast, by Application 2020 & 2033
- Table 85: South Korea Hot Pot Bean Sauce Revenue (billion) Forecast, by Application 2020 & 2033
- Table 86: South Korea Hot Pot Bean Sauce Volume (K) Forecast, by Application 2020 & 2033
- Table 87: ASEAN Hot Pot Bean Sauce Revenue (billion) Forecast, by Application 2020 & 2033
- Table 88: ASEAN Hot Pot Bean Sauce Volume (K) Forecast, by Application 2020 & 2033
- Table 89: Oceania Hot Pot Bean Sauce Revenue (billion) Forecast, by Application 2020 & 2033
- Table 90: Oceania Hot Pot Bean Sauce Volume (K) Forecast, by Application 2020 & 2033
- Table 91: Rest of Asia Pacific Hot Pot Bean Sauce Revenue (billion) Forecast, by Application 2020 & 2033
- Table 92: Rest of Asia Pacific Hot Pot Bean Sauce Volume (K) Forecast, by Application 2020 & 2033
Frequently Asked Questions
1. What is the projected Compound Annual Growth Rate (CAGR) of the Hot Pot Bean Sauce?
The projected CAGR is approximately 7.5%.
2. Which companies are prominent players in the Hot Pot Bean Sauce?
Key companies in the market include Lee Kum Kee, Foshan Haitian Flavouring and Food Company, Shanghai Totole, Nihon Shokuken, Kikkoman, Lao Gan Ma, Yihai International, Teway Food, Kewpie Food, House Foods, Ajinomoto, Zhumadian Wangshouyi Multi-Flavoured Spice Group, Hong Jiujiu.
3. What are the main segments of the Hot Pot Bean Sauce?
The market segments include Application, Type.
4. Can you provide details about the market size?
The market size is estimated to be USD 1.2 billion as of 2022.
5. What are some drivers contributing to market growth?
N/A
6. What are the notable trends driving market growth?
N/A
7. Are there any restraints impacting market growth?
N/A
8. Can you provide examples of recent developments in the market?
N/A
9. What pricing options are available for accessing the report?
Pricing options include single-user, multi-user, and enterprise licenses priced at USD 3950.00, USD 5925.00, and USD 7900.00 respectively.
10. Is the market size provided in terms of value or volume?
The market size is provided in terms of value, measured in billion and volume, measured in K.
11. Are there any specific market keywords associated with the report?
Yes, the market keyword associated with the report is "Hot Pot Bean Sauce," which aids in identifying and referencing the specific market segment covered.
12. How do I determine which pricing option suits my needs best?
The pricing options vary based on user requirements and access needs. Individual users may opt for single-user licenses, while businesses requiring broader access may choose multi-user or enterprise licenses for cost-effective access to the report.
13. Are there any additional resources or data provided in the Hot Pot Bean Sauce report?
While the report offers comprehensive insights, it's advisable to review the specific contents or supplementary materials provided to ascertain if additional resources or data are available.
14. How can I stay updated on further developments or reports in the Hot Pot Bean Sauce?
To stay informed about further developments, trends, and reports in the Hot Pot Bean Sauce, consider subscribing to industry newsletters, following relevant companies and organizations, or regularly checking reputable industry news sources and publications.
Methodology
Step 1 - Identification of Relevant Samples Size from Population Database


Step 2 - Approaches for Defining Global Market Size (Value, Volume* & Price*)

Note*: In applicable scenarios
Step 3 - Data Sources
Primary Research
- Web Analytics
- Survey Reports
- Research Institute
- Latest Research Reports
- Opinion Leaders
Secondary Research
- Annual Reports
- White Paper
- Latest Press Release
- Industry Association
- Paid Database
- Investor Presentations

Step 4 - Data Triangulation
Involves using different sources of information in order to increase the validity of a study
These sources are likely to be stakeholders in a program - participants, other researchers, program staff, other community members, and so on.
Then we put all data in single framework & apply various statistical tools to find out the dynamic on the market.
During the analysis stage, feedback from the stakeholder groups would be compared to determine areas of agreement as well as areas of divergence