

Key Insights
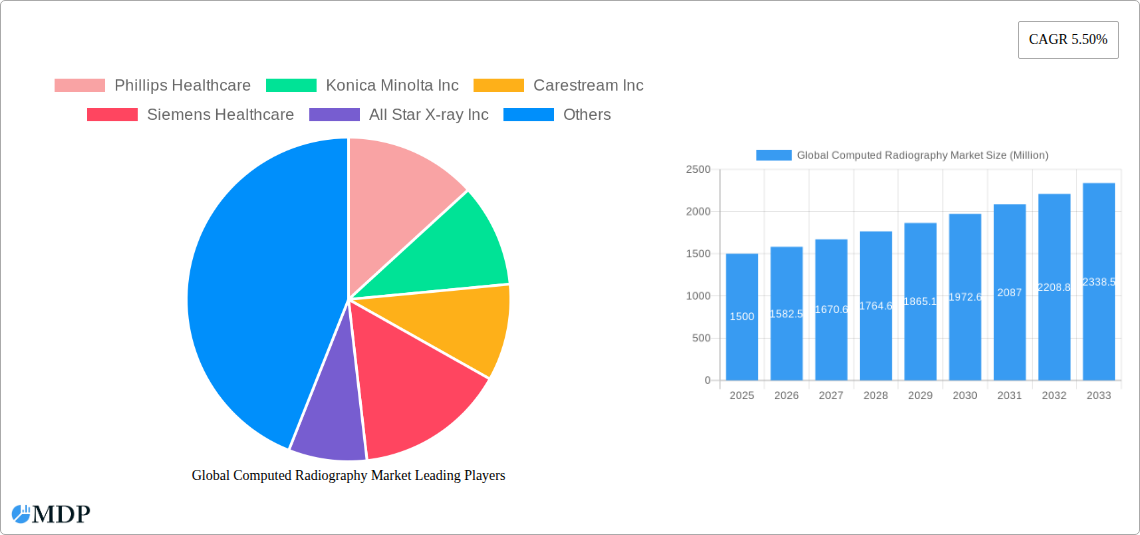
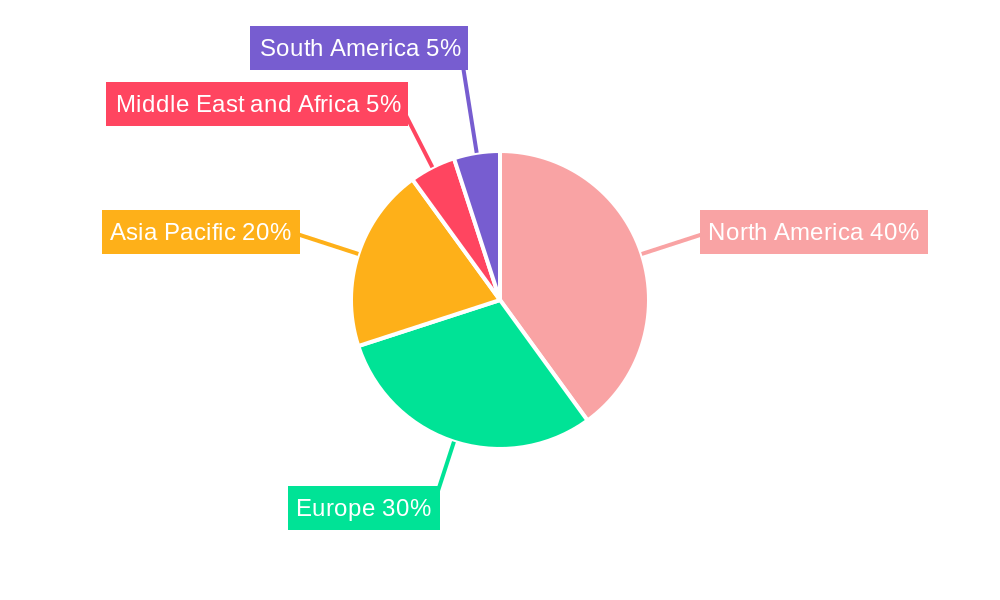
The global computed radiography (CR) market, valued at approximately $1.5 billion in 2025, is projected to experience steady growth, driven by a Compound Annual Growth Rate (CAGR) of 5.50% from 2025 to 2033. This growth is fueled by several key factors. The increasing prevalence of chronic diseases, such as cancer and cardiovascular conditions, necessitates more frequent diagnostic imaging, boosting demand for CR systems. Technological advancements leading to improved image quality, faster processing speeds, and more compact and portable systems are further driving market expansion. The rising adoption of CR in emerging economies with growing healthcare infrastructure is also contributing to this growth. However, the market faces certain restraints, including the high initial investment cost associated with CR systems and the increasing competition from digital radiography (DR) which offers potentially superior image quality and workflow efficiencies. Nevertheless, the cost-effectiveness of CR compared to DR, particularly in resource-constrained settings, continues to support its market presence. Segmentation reveals significant contributions from orthopedic and cancer applications, with hospitals as the major end-users. North America and Europe are currently the dominant markets, yet the Asia-Pacific region is expected to exhibit significant growth potential in the coming years due to increasing healthcare spending and rising awareness about the benefits of early diagnosis.
The competitive landscape is characterized by both established players like Philips Healthcare, GE Healthcare, and Fujifilm Corporation, and smaller specialized companies like All Star X-Ray Inc and Desert Health Imaging Technologies LLC. These companies are actively engaged in strategic partnerships, product innovations, and geographical expansion to maintain their market share. Future market success will depend on companies' ability to offer cost-effective, high-quality systems, coupled with robust after-sales support and service capabilities, especially in emerging markets. The market is expected to witness consolidation as larger companies acquire smaller players to expand their product portfolio and geographical reach. Technological innovation focused on improving image quality, reducing radiation dose, and enhancing system integration with other medical imaging modalities will be critical for continued growth in the CR market throughout the forecast period.
Global Computed Radiography Market Report: 2019-2033
This comprehensive report provides an in-depth analysis of the global computed radiography (CR) market, offering invaluable insights for stakeholders across the healthcare industry. Covering the period 2019-2033, with a base year of 2025, this study forecasts market trends, identifies key players, and highlights emerging opportunities. The report leverages a robust methodology incorporating historical data (2019-2024), current estimations (2025), and future projections (2025-2033) to provide a clear and actionable understanding of this dynamic market.
Global Computed Radiography Market Market Dynamics & Concentration
The global computed radiography market is characterized by a moderately concentrated landscape, with key players like Philips Healthcare, Konica Minolta Inc., Carestream Inc., and Siemens Healthcare holding significant market share. The market's dynamics are shaped by several factors:
- Innovation Drivers: Continuous advancements in digital imaging technology, such as improved image quality, faster processing speeds, and enhanced software capabilities, are driving market growth. The development of portable and wireless CR systems is also expanding market reach.
- Regulatory Frameworks: Stringent regulatory approvals and safety standards influence market entry and product development. Compliance with these regulations is crucial for market success.
- Product Substitutes: While CR systems still hold a significant market share, the emergence of digital radiography (DR) systems presents a competitive challenge. The report analyses the competitive dynamics between CR and DR, considering factors like cost, image quality, and workflow efficiency.
- End-User Trends: The increasing prevalence of chronic diseases, the growing elderly population, and a rising demand for efficient diagnostic tools are fueling market demand. Hospitals and diagnostic centers remain the primary end-users, but other end-users are emerging.
- M&A Activities: The market has witnessed a moderate level of mergers and acquisitions (M&A) activity in recent years, with xx deals recorded between 2019 and 2024. These activities aim to consolidate market share, enhance product portfolios, and expand geographical reach. The report analyzes the impact of these M&A activities on market concentration and competitive landscape. The market share of the top 5 players is estimated at xx% in 2025.
Global Computed Radiography Market Industry Trends & Analysis
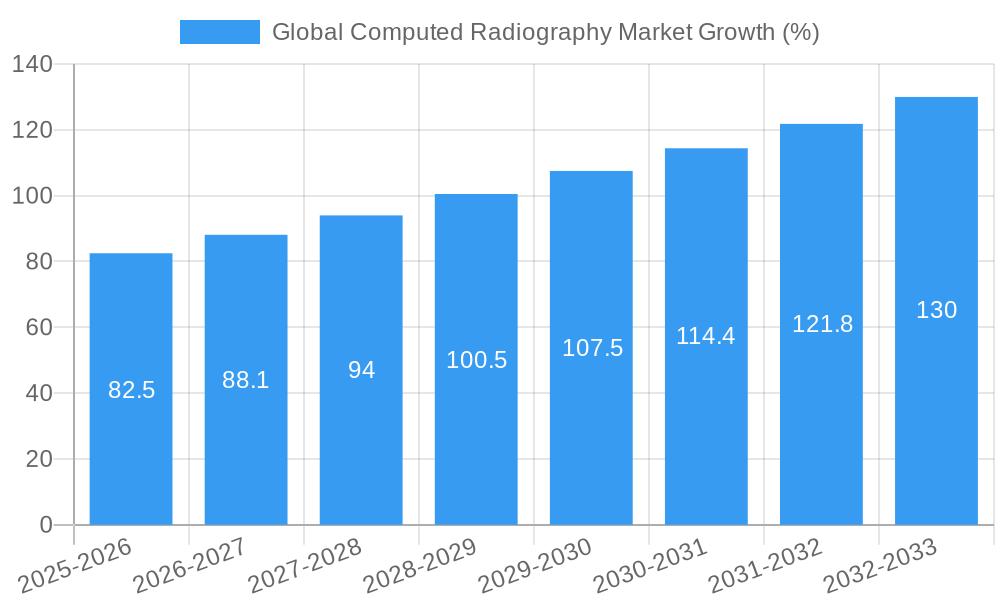
The global computed radiography market is experiencing significant growth, driven by several key factors. Technological advancements, such as the development of wireless and portable CR systems, have increased accessibility and convenience, leading to higher adoption rates. The rising prevalence of chronic diseases necessitates increased diagnostic imaging procedures, further bolstering market demand. The market is estimated to grow at a CAGR of xx% during the forecast period (2025-2033), with market penetration expected to reach xx% by 2033. Consumer preference for faster, higher-quality images, coupled with increasing healthcare expenditure, contributes significantly to this growth. However, the competitive landscape, characterized by the presence of established players and the emergence of new entrants, necessitates a strategic approach to maintain a competitive edge. The increasing adoption of DR systems poses a significant challenge to CR market growth. The report provides a detailed analysis of these trends, evaluating their impact on market size, segmentation, and future growth trajectory.
Leading Markets & Segments in Global Computed Radiography Market
The North American region is currently the dominant market for computed radiography, driven by strong healthcare infrastructure, high healthcare expenditure, and the early adoption of advanced medical technologies. Within applications, orthopedic imaging holds the largest market share due to its high prevalence and demand for accurate diagnostics.
Key Drivers for North America:
- Well-established healthcare infrastructure.
- High level of healthcare spending.
- Early adoption of new medical technologies.
- Stringent regulatory frameworks promoting advanced imaging techniques.
Orthopedic Application Dominance:
- High prevalence of orthopedic injuries and conditions.
- Demand for accurate and timely diagnostics for fracture detection, joint evaluation, and other orthopedic applications.
Hospitals as Leading End-Users:
- High volume of patient throughput in hospitals.
- Availability of sophisticated imaging equipment and skilled radiologists.
Other regions, such as Europe and Asia-Pacific, are also exhibiting significant growth potential, driven by factors such as increasing healthcare investments, growing awareness of advanced imaging technologies, and rising prevalence of chronic diseases. The report provides a detailed regional and segment-wise analysis, identifying key growth drivers and opportunities in each market. The report also addresses the significant growth in the dental application segment due to the rising demand for improved dental diagnostics.
Global Computed Radiography Market Product Developments
Recent product developments in the computed radiography market focus on enhancing image quality, improving workflow efficiency, and increasing system portability. Several manufacturers are introducing systems with advanced image processing algorithms to reduce noise and improve image clarity. The incorporation of wireless capabilities and user-friendly interfaces is enhancing the usability of CR systems, making them more accessible to a wider range of healthcare facilities. These innovations are aimed at addressing the challenges posed by competing technologies, like digital radiography, and at capturing market share in various applications.
Key Drivers of Global Computed Radiography Market Growth
Several factors contribute to the growth of the global computed radiography market. Technological advancements, resulting in improved image quality, faster processing, and increased portability, are driving adoption. Furthermore, the rising prevalence of chronic diseases necessitates more diagnostic imaging, boosting demand. Favorable regulatory environments supporting the adoption of advanced medical imaging technologies also play a crucial role.
Challenges in the Global Computed Radiography Market Market
The market faces challenges such as competition from DR technology, which offers superior image quality and faster processing times. The high initial investment cost of CR systems can also limit adoption in resource-constrained settings. Supply chain disruptions impacting the availability of components can affect production and market supply. Furthermore, stringent regulatory requirements and compliance costs represent significant barriers to market entry and expansion. The overall impact of these challenges on market growth is estimated to be around xx% during the forecast period.
Emerging Opportunities in Global Computed Radiography Market
The global computed radiography market presents several promising opportunities. Strategic partnerships between CR manufacturers and healthcare providers can drive market penetration and expand access to CR systems in underserved areas. The development of AI-powered image analysis tools can improve diagnostic accuracy and efficiency. The integration of CR technology into existing healthcare IT infrastructure can optimize workflow and data management. Expansion into emerging markets with increasing healthcare infrastructure investment presents significant growth potential.
Leading Players in the Global Computed Radiography Market Sector
- Philips Healthcare
- Konica Minolta Inc
- Carestream Inc
- Siemens Healthcare
- All Star X-ray Inc
- Desert Health Imaging Technologies LLC
- GE Healthcare
- Fujifilm Corporation
- Multi Imager Service Inc
- Jones X-Ray Inc
- EuroTeck Systems Ltd
Key Milestones in Global Computed Radiography Market Industry
- April 2022: FUJIFILM Healthcare Americas Corporation secured a DoD contract to standardize DIN-PACS across the US Pacific Air Force/Navy, signifying a significant adoption of CR technology in the defense sector.
- April 2022: Boston Imaging launched the GM85 Fit, a new CR device emphasizing user-centric design for efficient patient care, reflecting the ongoing focus on improved usability and workflow.
Strategic Outlook for Global Computed Radiography Market Market
The global computed radiography market holds significant long-term growth potential. Strategic investments in research and development, focused on enhancing image quality, portability, and workflow efficiency, will be crucial for maintaining competitiveness. Expanding into emerging markets and forging strategic partnerships with healthcare providers will also play a vital role in future growth. The market is expected to witness further consolidation as companies seek to expand their market share and product portfolios through strategic acquisitions and alliances. The adoption of AI and machine learning in CR technology offers significant opportunities for improving diagnostic accuracy and streamlining workflow processes.
Global Computed Radiography Market Segmentation
-
1. Application
- 1.1. Orthopedic
- 1.2. Cancer
- 1.3. Dental
- 1.4. Cardiovascular
- 1.5. Other Applications
-
2. End-User
- 2.1. Hospitals
- 2.2. Diagnostic Centers
- 2.3. Other End Users
Global Computed Radiography Market Segmentation By Geography
-
1. North America
- 1.1. United States
- 1.2. Canada
- 1.3. Mexico
-
2. Europe
- 2.1. Germany
- 2.2. United Kingdom
- 2.3. France
- 2.4. Italy
- 2.5. Spain
- 2.6. Rest of Europe
-
3. Asia Pacific
- 3.1. China
- 3.2. Japan
- 3.3. India
- 3.4. Australia
- 3.5. South Korea
- 3.6. Rest of Asia Pacific
-
4. Middle East and Africa
- 4.1. GCC
- 4.2. South Africa
- 4.3. Rest of Middle East and Africa
-
5. South America
- 5.1. Brazil
- 5.2. Argentina
- 5.3. Rest of South America
Global Computed Radiography Market REPORT HIGHLIGHTS
| Aspects | Details |
|---|---|
| Study Period | 2019-2033 |
| Base Year | 2024 |
| Estimated Year | 2025 |
| Forecast Period | 2025-2033 |
| Historical Period | 2019-2024 |
| Growth Rate | CAGR of 5.50% from 2019-2033 |
| Segmentation |
|
Table of Contents
- 1. Introduction
- 1.1. Research Scope
- 1.2. Market Segmentation
- 1.3. Research Methodology
- 1.4. Definitions and Assumptions
- 2. Executive Summary
- 2.1. Introduction
- 3. Market Dynamics
- 3.1. Introduction
- 3.2. Market Drivers
- 3.2.1. Increasing Occurrence of Orthopedic and other Chronic Diseases; Technological Advancements
- 3.3. Market Restrains
- 3.3.1. High Initial Cost of Installation and High Device Cost
- 3.4. Market Trends
- 3.4.1. Orthopedic Segment is Expected to Projected Significant Growth Over the Forecast Period.
- 4. Market Factor Analysis
- 4.1. Porters Five Forces
- 4.2. Supply/Value Chain
- 4.3. PESTEL analysis
- 4.4. Market Entropy
- 4.5. Patent/Trademark Analysis
- 5. Global Computed Radiography Market Analysis, Insights and Forecast, 2019-2031
- 5.1. Market Analysis, Insights and Forecast - by Application
- 5.1.1. Orthopedic
- 5.1.2. Cancer
- 5.1.3. Dental
- 5.1.4. Cardiovascular
- 5.1.5. Other Applications
- 5.2. Market Analysis, Insights and Forecast - by End-User
- 5.2.1. Hospitals
- 5.2.2. Diagnostic Centers
- 5.2.3. Other End Users
- 5.3. Market Analysis, Insights and Forecast - by Region
- 5.3.1. North America
- 5.3.2. Europe
- 5.3.3. Asia Pacific
- 5.3.4. Middle East and Africa
- 5.3.5. South America
- 5.1. Market Analysis, Insights and Forecast - by Application
- 6. North America Global Computed Radiography Market Analysis, Insights and Forecast, 2019-2031
- 6.1. Market Analysis, Insights and Forecast - by Application
- 6.1.1. Orthopedic
- 6.1.2. Cancer
- 6.1.3. Dental
- 6.1.4. Cardiovascular
- 6.1.5. Other Applications
- 6.2. Market Analysis, Insights and Forecast - by End-User
- 6.2.1. Hospitals
- 6.2.2. Diagnostic Centers
- 6.2.3. Other End Users
- 6.1. Market Analysis, Insights and Forecast - by Application
- 7. Europe Global Computed Radiography Market Analysis, Insights and Forecast, 2019-2031
- 7.1. Market Analysis, Insights and Forecast - by Application
- 7.1.1. Orthopedic
- 7.1.2. Cancer
- 7.1.3. Dental
- 7.1.4. Cardiovascular
- 7.1.5. Other Applications
- 7.2. Market Analysis, Insights and Forecast - by End-User
- 7.2.1. Hospitals
- 7.2.2. Diagnostic Centers
- 7.2.3. Other End Users
- 7.1. Market Analysis, Insights and Forecast - by Application
- 8. Asia Pacific Global Computed Radiography Market Analysis, Insights and Forecast, 2019-2031
- 8.1. Market Analysis, Insights and Forecast - by Application
- 8.1.1. Orthopedic
- 8.1.2. Cancer
- 8.1.3. Dental
- 8.1.4. Cardiovascular
- 8.1.5. Other Applications
- 8.2. Market Analysis, Insights and Forecast - by End-User
- 8.2.1. Hospitals
- 8.2.2. Diagnostic Centers
- 8.2.3. Other End Users
- 8.1. Market Analysis, Insights and Forecast - by Application
- 9. Middle East and Africa Global Computed Radiography Market Analysis, Insights and Forecast, 2019-2031
- 9.1. Market Analysis, Insights and Forecast - by Application
- 9.1.1. Orthopedic
- 9.1.2. Cancer
- 9.1.3. Dental
- 9.1.4. Cardiovascular
- 9.1.5. Other Applications
- 9.2. Market Analysis, Insights and Forecast - by End-User
- 9.2.1. Hospitals
- 9.2.2. Diagnostic Centers
- 9.2.3. Other End Users
- 9.1. Market Analysis, Insights and Forecast - by Application
- 10. South America Global Computed Radiography Market Analysis, Insights and Forecast, 2019-2031
- 10.1. Market Analysis, Insights and Forecast - by Application
- 10.1.1. Orthopedic
- 10.1.2. Cancer
- 10.1.3. Dental
- 10.1.4. Cardiovascular
- 10.1.5. Other Applications
- 10.2. Market Analysis, Insights and Forecast - by End-User
- 10.2.1. Hospitals
- 10.2.2. Diagnostic Centers
- 10.2.3. Other End Users
- 10.1. Market Analysis, Insights and Forecast - by Application
- 11. North America Global Computed Radiography Market Analysis, Insights and Forecast, 2019-2031
- 11.1. Market Analysis, Insights and Forecast - By Country/Sub-region
- 11.1.1 United States
- 11.1.2 Canada
- 11.1.3 Mexico
- 12. Europe Global Computed Radiography Market Analysis, Insights and Forecast, 2019-2031
- 12.1. Market Analysis, Insights and Forecast - By Country/Sub-region
- 12.1.1 Germany
- 12.1.2 United Kingdom
- 12.1.3 France
- 12.1.4 Italy
- 12.1.5 Spain
- 12.1.6 Rest of Europe
- 13. Asia Pacific Global Computed Radiography Market Analysis, Insights and Forecast, 2019-2031
- 13.1. Market Analysis, Insights and Forecast - By Country/Sub-region
- 13.1.1 China
- 13.1.2 Japan
- 13.1.3 India
- 13.1.4 Australia
- 13.1.5 South Korea
- 13.1.6 Rest of Asia Pacific
- 14. Middle East and Africa Global Computed Radiography Market Analysis, Insights and Forecast, 2019-2031
- 14.1. Market Analysis, Insights and Forecast - By Country/Sub-region
- 14.1.1 GCC
- 14.1.2 South Africa
- 14.1.3 Rest of Middle East and Africa
- 15. South America Global Computed Radiography Market Analysis, Insights and Forecast, 2019-2031
- 15.1. Market Analysis, Insights and Forecast - By Country/Sub-region
- 15.1.1 Brazil
- 15.1.2 Argentina
- 15.1.3 Rest of South America
- 16. Competitive Analysis
- 16.1. Market Share Analysis 2024
- 16.2. Company Profiles
- 16.2.1 Phillips Healthcare
- 16.2.1.1. Overview
- 16.2.1.2. Products
- 16.2.1.3. SWOT Analysis
- 16.2.1.4. Recent Developments
- 16.2.1.5. Financials (Based on Availability)
- 16.2.2 Konica Minolta Inc
- 16.2.2.1. Overview
- 16.2.2.2. Products
- 16.2.2.3. SWOT Analysis
- 16.2.2.4. Recent Developments
- 16.2.2.5. Financials (Based on Availability)
- 16.2.3 Carestream Inc
- 16.2.3.1. Overview
- 16.2.3.2. Products
- 16.2.3.3. SWOT Analysis
- 16.2.3.4. Recent Developments
- 16.2.3.5. Financials (Based on Availability)
- 16.2.4 Siemens Healthcare
- 16.2.4.1. Overview
- 16.2.4.2. Products
- 16.2.4.3. SWOT Analysis
- 16.2.4.4. Recent Developments
- 16.2.4.5. Financials (Based on Availability)
- 16.2.5 All Star X-ray Inc
- 16.2.5.1. Overview
- 16.2.5.2. Products
- 16.2.5.3. SWOT Analysis
- 16.2.5.4. Recent Developments
- 16.2.5.5. Financials (Based on Availability)
- 16.2.6 Desert Health Imaging Technologies LLC
- 16.2.6.1. Overview
- 16.2.6.2. Products
- 16.2.6.3. SWOT Analysis
- 16.2.6.4. Recent Developments
- 16.2.6.5. Financials (Based on Availability)
- 16.2.7 GE Healthcare
- 16.2.7.1. Overview
- 16.2.7.2. Products
- 16.2.7.3. SWOT Analysis
- 16.2.7.4. Recent Developments
- 16.2.7.5. Financials (Based on Availability)
- 16.2.8 Fujifilm Corporation
- 16.2.8.1. Overview
- 16.2.8.2. Products
- 16.2.8.3. SWOT Analysis
- 16.2.8.4. Recent Developments
- 16.2.8.5. Financials (Based on Availability)
- 16.2.9 Multi Imager Service Inc
- 16.2.9.1. Overview
- 16.2.9.2. Products
- 16.2.9.3. SWOT Analysis
- 16.2.9.4. Recent Developments
- 16.2.9.5. Financials (Based on Availability)
- 16.2.10 Jones X-Ray Inc
- 16.2.10.1. Overview
- 16.2.10.2. Products
- 16.2.10.3. SWOT Analysis
- 16.2.10.4. Recent Developments
- 16.2.10.5. Financials (Based on Availability)
- 16.2.11 EuroTeck Systems Ltd
- 16.2.11.1. Overview
- 16.2.11.2. Products
- 16.2.11.3. SWOT Analysis
- 16.2.11.4. Recent Developments
- 16.2.11.5. Financials (Based on Availability)
- 16.2.1 Phillips Healthcare
List of Figures
- Figure 1: Global Global Computed Radiography Market Revenue Breakdown (Million, %) by Region 2024 & 2032
- Figure 2: North America Global Computed Radiography Market Revenue (Million), by Country 2024 & 2032
- Figure 3: North America Global Computed Radiography Market Revenue Share (%), by Country 2024 & 2032
- Figure 4: Europe Global Computed Radiography Market Revenue (Million), by Country 2024 & 2032
- Figure 5: Europe Global Computed Radiography Market Revenue Share (%), by Country 2024 & 2032
- Figure 6: Asia Pacific Global Computed Radiography Market Revenue (Million), by Country 2024 & 2032
- Figure 7: Asia Pacific Global Computed Radiography Market Revenue Share (%), by Country 2024 & 2032
- Figure 8: Middle East and Africa Global Computed Radiography Market Revenue (Million), by Country 2024 & 2032
- Figure 9: Middle East and Africa Global Computed Radiography Market Revenue Share (%), by Country 2024 & 2032
- Figure 10: South America Global Computed Radiography Market Revenue (Million), by Country 2024 & 2032
- Figure 11: South America Global Computed Radiography Market Revenue Share (%), by Country 2024 & 2032
- Figure 12: North America Global Computed Radiography Market Revenue (Million), by Application 2024 & 2032
- Figure 13: North America Global Computed Radiography Market Revenue Share (%), by Application 2024 & 2032
- Figure 14: North America Global Computed Radiography Market Revenue (Million), by End-User 2024 & 2032
- Figure 15: North America Global Computed Radiography Market Revenue Share (%), by End-User 2024 & 2032
- Figure 16: North America Global Computed Radiography Market Revenue (Million), by Country 2024 & 2032
- Figure 17: North America Global Computed Radiography Market Revenue Share (%), by Country 2024 & 2032
- Figure 18: Europe Global Computed Radiography Market Revenue (Million), by Application 2024 & 2032
- Figure 19: Europe Global Computed Radiography Market Revenue Share (%), by Application 2024 & 2032
- Figure 20: Europe Global Computed Radiography Market Revenue (Million), by End-User 2024 & 2032
- Figure 21: Europe Global Computed Radiography Market Revenue Share (%), by End-User 2024 & 2032
- Figure 22: Europe Global Computed Radiography Market Revenue (Million), by Country 2024 & 2032
- Figure 23: Europe Global Computed Radiography Market Revenue Share (%), by Country 2024 & 2032
- Figure 24: Asia Pacific Global Computed Radiography Market Revenue (Million), by Application 2024 & 2032
- Figure 25: Asia Pacific Global Computed Radiography Market Revenue Share (%), by Application 2024 & 2032
- Figure 26: Asia Pacific Global Computed Radiography Market Revenue (Million), by End-User 2024 & 2032
- Figure 27: Asia Pacific Global Computed Radiography Market Revenue Share (%), by End-User 2024 & 2032
- Figure 28: Asia Pacific Global Computed Radiography Market Revenue (Million), by Country 2024 & 2032
- Figure 29: Asia Pacific Global Computed Radiography Market Revenue Share (%), by Country 2024 & 2032
- Figure 30: Middle East and Africa Global Computed Radiography Market Revenue (Million), by Application 2024 & 2032
- Figure 31: Middle East and Africa Global Computed Radiography Market Revenue Share (%), by Application 2024 & 2032
- Figure 32: Middle East and Africa Global Computed Radiography Market Revenue (Million), by End-User 2024 & 2032
- Figure 33: Middle East and Africa Global Computed Radiography Market Revenue Share (%), by End-User 2024 & 2032
- Figure 34: Middle East and Africa Global Computed Radiography Market Revenue (Million), by Country 2024 & 2032
- Figure 35: Middle East and Africa Global Computed Radiography Market Revenue Share (%), by Country 2024 & 2032
- Figure 36: South America Global Computed Radiography Market Revenue (Million), by Application 2024 & 2032
- Figure 37: South America Global Computed Radiography Market Revenue Share (%), by Application 2024 & 2032
- Figure 38: South America Global Computed Radiography Market Revenue (Million), by End-User 2024 & 2032
- Figure 39: South America Global Computed Radiography Market Revenue Share (%), by End-User 2024 & 2032
- Figure 40: South America Global Computed Radiography Market Revenue (Million), by Country 2024 & 2032
- Figure 41: South America Global Computed Radiography Market Revenue Share (%), by Country 2024 & 2032
List of Tables
- Table 1: Global Computed Radiography Market Revenue Million Forecast, by Region 2019 & 2032
- Table 2: Global Computed Radiography Market Revenue Million Forecast, by Application 2019 & 2032
- Table 3: Global Computed Radiography Market Revenue Million Forecast, by End-User 2019 & 2032
- Table 4: Global Computed Radiography Market Revenue Million Forecast, by Region 2019 & 2032
- Table 5: Global Computed Radiography Market Revenue Million Forecast, by Country 2019 & 2032
- Table 6: United States Global Computed Radiography Market Revenue (Million) Forecast, by Application 2019 & 2032
- Table 7: Canada Global Computed Radiography Market Revenue (Million) Forecast, by Application 2019 & 2032
- Table 8: Mexico Global Computed Radiography Market Revenue (Million) Forecast, by Application 2019 & 2032
- Table 9: Global Computed Radiography Market Revenue Million Forecast, by Country 2019 & 2032
- Table 10: Germany Global Computed Radiography Market Revenue (Million) Forecast, by Application 2019 & 2032
- Table 11: United Kingdom Global Computed Radiography Market Revenue (Million) Forecast, by Application 2019 & 2032
- Table 12: France Global Computed Radiography Market Revenue (Million) Forecast, by Application 2019 & 2032
- Table 13: Italy Global Computed Radiography Market Revenue (Million) Forecast, by Application 2019 & 2032
- Table 14: Spain Global Computed Radiography Market Revenue (Million) Forecast, by Application 2019 & 2032
- Table 15: Rest of Europe Global Computed Radiography Market Revenue (Million) Forecast, by Application 2019 & 2032
- Table 16: Global Computed Radiography Market Revenue Million Forecast, by Country 2019 & 2032
- Table 17: China Global Computed Radiography Market Revenue (Million) Forecast, by Application 2019 & 2032
- Table 18: Japan Global Computed Radiography Market Revenue (Million) Forecast, by Application 2019 & 2032
- Table 19: India Global Computed Radiography Market Revenue (Million) Forecast, by Application 2019 & 2032
- Table 20: Australia Global Computed Radiography Market Revenue (Million) Forecast, by Application 2019 & 2032
- Table 21: South Korea Global Computed Radiography Market Revenue (Million) Forecast, by Application 2019 & 2032
- Table 22: Rest of Asia Pacific Global Computed Radiography Market Revenue (Million) Forecast, by Application 2019 & 2032
- Table 23: Global Computed Radiography Market Revenue Million Forecast, by Country 2019 & 2032
- Table 24: GCC Global Computed Radiography Market Revenue (Million) Forecast, by Application 2019 & 2032
- Table 25: South Africa Global Computed Radiography Market Revenue (Million) Forecast, by Application 2019 & 2032
- Table 26: Rest of Middle East and Africa Global Computed Radiography Market Revenue (Million) Forecast, by Application 2019 & 2032
- Table 27: Global Computed Radiography Market Revenue Million Forecast, by Country 2019 & 2032
- Table 28: Brazil Global Computed Radiography Market Revenue (Million) Forecast, by Application 2019 & 2032
- Table 29: Argentina Global Computed Radiography Market Revenue (Million) Forecast, by Application 2019 & 2032
- Table 30: Rest of South America Global Computed Radiography Market Revenue (Million) Forecast, by Application 2019 & 2032
- Table 31: Global Computed Radiography Market Revenue Million Forecast, by Application 2019 & 2032
- Table 32: Global Computed Radiography Market Revenue Million Forecast, by End-User 2019 & 2032
- Table 33: Global Computed Radiography Market Revenue Million Forecast, by Country 2019 & 2032
- Table 34: United States Global Computed Radiography Market Revenue (Million) Forecast, by Application 2019 & 2032
- Table 35: Canada Global Computed Radiography Market Revenue (Million) Forecast, by Application 2019 & 2032
- Table 36: Mexico Global Computed Radiography Market Revenue (Million) Forecast, by Application 2019 & 2032
- Table 37: Global Computed Radiography Market Revenue Million Forecast, by Application 2019 & 2032
- Table 38: Global Computed Radiography Market Revenue Million Forecast, by End-User 2019 & 2032
- Table 39: Global Computed Radiography Market Revenue Million Forecast, by Country 2019 & 2032
- Table 40: Germany Global Computed Radiography Market Revenue (Million) Forecast, by Application 2019 & 2032
- Table 41: United Kingdom Global Computed Radiography Market Revenue (Million) Forecast, by Application 2019 & 2032
- Table 42: France Global Computed Radiography Market Revenue (Million) Forecast, by Application 2019 & 2032
- Table 43: Italy Global Computed Radiography Market Revenue (Million) Forecast, by Application 2019 & 2032
- Table 44: Spain Global Computed Radiography Market Revenue (Million) Forecast, by Application 2019 & 2032
- Table 45: Rest of Europe Global Computed Radiography Market Revenue (Million) Forecast, by Application 2019 & 2032
- Table 46: Global Computed Radiography Market Revenue Million Forecast, by Application 2019 & 2032
- Table 47: Global Computed Radiography Market Revenue Million Forecast, by End-User 2019 & 2032
- Table 48: Global Computed Radiography Market Revenue Million Forecast, by Country 2019 & 2032
- Table 49: China Global Computed Radiography Market Revenue (Million) Forecast, by Application 2019 & 2032
- Table 50: Japan Global Computed Radiography Market Revenue (Million) Forecast, by Application 2019 & 2032
- Table 51: India Global Computed Radiography Market Revenue (Million) Forecast, by Application 2019 & 2032
- Table 52: Australia Global Computed Radiography Market Revenue (Million) Forecast, by Application 2019 & 2032
- Table 53: South Korea Global Computed Radiography Market Revenue (Million) Forecast, by Application 2019 & 2032
- Table 54: Rest of Asia Pacific Global Computed Radiography Market Revenue (Million) Forecast, by Application 2019 & 2032
- Table 55: Global Computed Radiography Market Revenue Million Forecast, by Application 2019 & 2032
- Table 56: Global Computed Radiography Market Revenue Million Forecast, by End-User 2019 & 2032
- Table 57: Global Computed Radiography Market Revenue Million Forecast, by Country 2019 & 2032
- Table 58: GCC Global Computed Radiography Market Revenue (Million) Forecast, by Application 2019 & 2032
- Table 59: South Africa Global Computed Radiography Market Revenue (Million) Forecast, by Application 2019 & 2032
- Table 60: Rest of Middle East and Africa Global Computed Radiography Market Revenue (Million) Forecast, by Application 2019 & 2032
- Table 61: Global Computed Radiography Market Revenue Million Forecast, by Application 2019 & 2032
- Table 62: Global Computed Radiography Market Revenue Million Forecast, by End-User 2019 & 2032
- Table 63: Global Computed Radiography Market Revenue Million Forecast, by Country 2019 & 2032
- Table 64: Brazil Global Computed Radiography Market Revenue (Million) Forecast, by Application 2019 & 2032
- Table 65: Argentina Global Computed Radiography Market Revenue (Million) Forecast, by Application 2019 & 2032
- Table 66: Rest of South America Global Computed Radiography Market Revenue (Million) Forecast, by Application 2019 & 2032
Frequently Asked Questions
1. What is the projected Compound Annual Growth Rate (CAGR) of the Global Computed Radiography Market?
The projected CAGR is approximately 5.50%.
2. Which companies are prominent players in the Global Computed Radiography Market?
Key companies in the market include Phillips Healthcare, Konica Minolta Inc, Carestream Inc, Siemens Healthcare, All Star X-ray Inc, Desert Health Imaging Technologies LLC, GE Healthcare, Fujifilm Corporation, Multi Imager Service Inc, Jones X-Ray Inc, EuroTeck Systems Ltd.
3. What are the main segments of the Global Computed Radiography Market?
The market segments include Application, End-User.
4. Can you provide details about the market size?
The market size is estimated to be USD XX Million as of 2022.
5. What are some drivers contributing to market growth?
Increasing Occurrence of Orthopedic and other Chronic Diseases; Technological Advancements.
6. What are the notable trends driving market growth?
Orthopedic Segment is Expected to Projected Significant Growth Over the Forecast Period..
7. Are there any restraints impacting market growth?
High Initial Cost of Installation and High Device Cost.
8. Can you provide examples of recent developments in the market?
In April 2022, FUJIFILM Healthcare Americas Corporation, a leading provider of enterprise imaging and informatics solutions, was awarded a Pacific Air Force/Navy (PACAF) contract from the United States Department of Defense (DoD) to standardize its digital imaging network's picture archiving and communication systems (DIN-PACS) in the United States.
9. What pricing options are available for accessing the report?
Pricing options include single-user, multi-user, and enterprise licenses priced at USD 4750, USD 5250, and USD 8750 respectively.
10. Is the market size provided in terms of value or volume?
The market size is provided in terms of value, measured in Million.
11. Are there any specific market keywords associated with the report?
Yes, the market keyword associated with the report is "Global Computed Radiography Market," which aids in identifying and referencing the specific market segment covered.
12. How do I determine which pricing option suits my needs best?
The pricing options vary based on user requirements and access needs. Individual users may opt for single-user licenses, while businesses requiring broader access may choose multi-user or enterprise licenses for cost-effective access to the report.
13. Are there any additional resources or data provided in the Global Computed Radiography Market report?
While the report offers comprehensive insights, it's advisable to review the specific contents or supplementary materials provided to ascertain if additional resources or data are available.
14. How can I stay updated on further developments or reports in the Global Computed Radiography Market?
To stay informed about further developments, trends, and reports in the Global Computed Radiography Market, consider subscribing to industry newsletters, following relevant companies and organizations, or regularly checking reputable industry news sources and publications.
Methodology
Step 1 - Identification of Relevant Samples Size from Population Database


Step 2 - Approaches for Defining Global Market Size (Value, Volume* & Price*)

Note*: In applicable scenarios
Step 3 - Data Sources
Primary Research
- Web Analytics
- Survey Reports
- Research Institute
- Latest Research Reports
- Opinion Leaders
Secondary Research
- Annual Reports
- White Paper
- Latest Press Release
- Industry Association
- Paid Database
- Investor Presentations

Step 4 - Data Triangulation
Involves using different sources of information in order to increase the validity of a study
These sources are likely to be stakeholders in a program - participants, other researchers, program staff, other community members, and so on.
Then we put all data in single framework & apply various statistical tools to find out the dynamic on the market.
During the analysis stage, feedback from the stakeholder groups would be compared to determine areas of agreement as well as areas of divergence
