


Key Insights
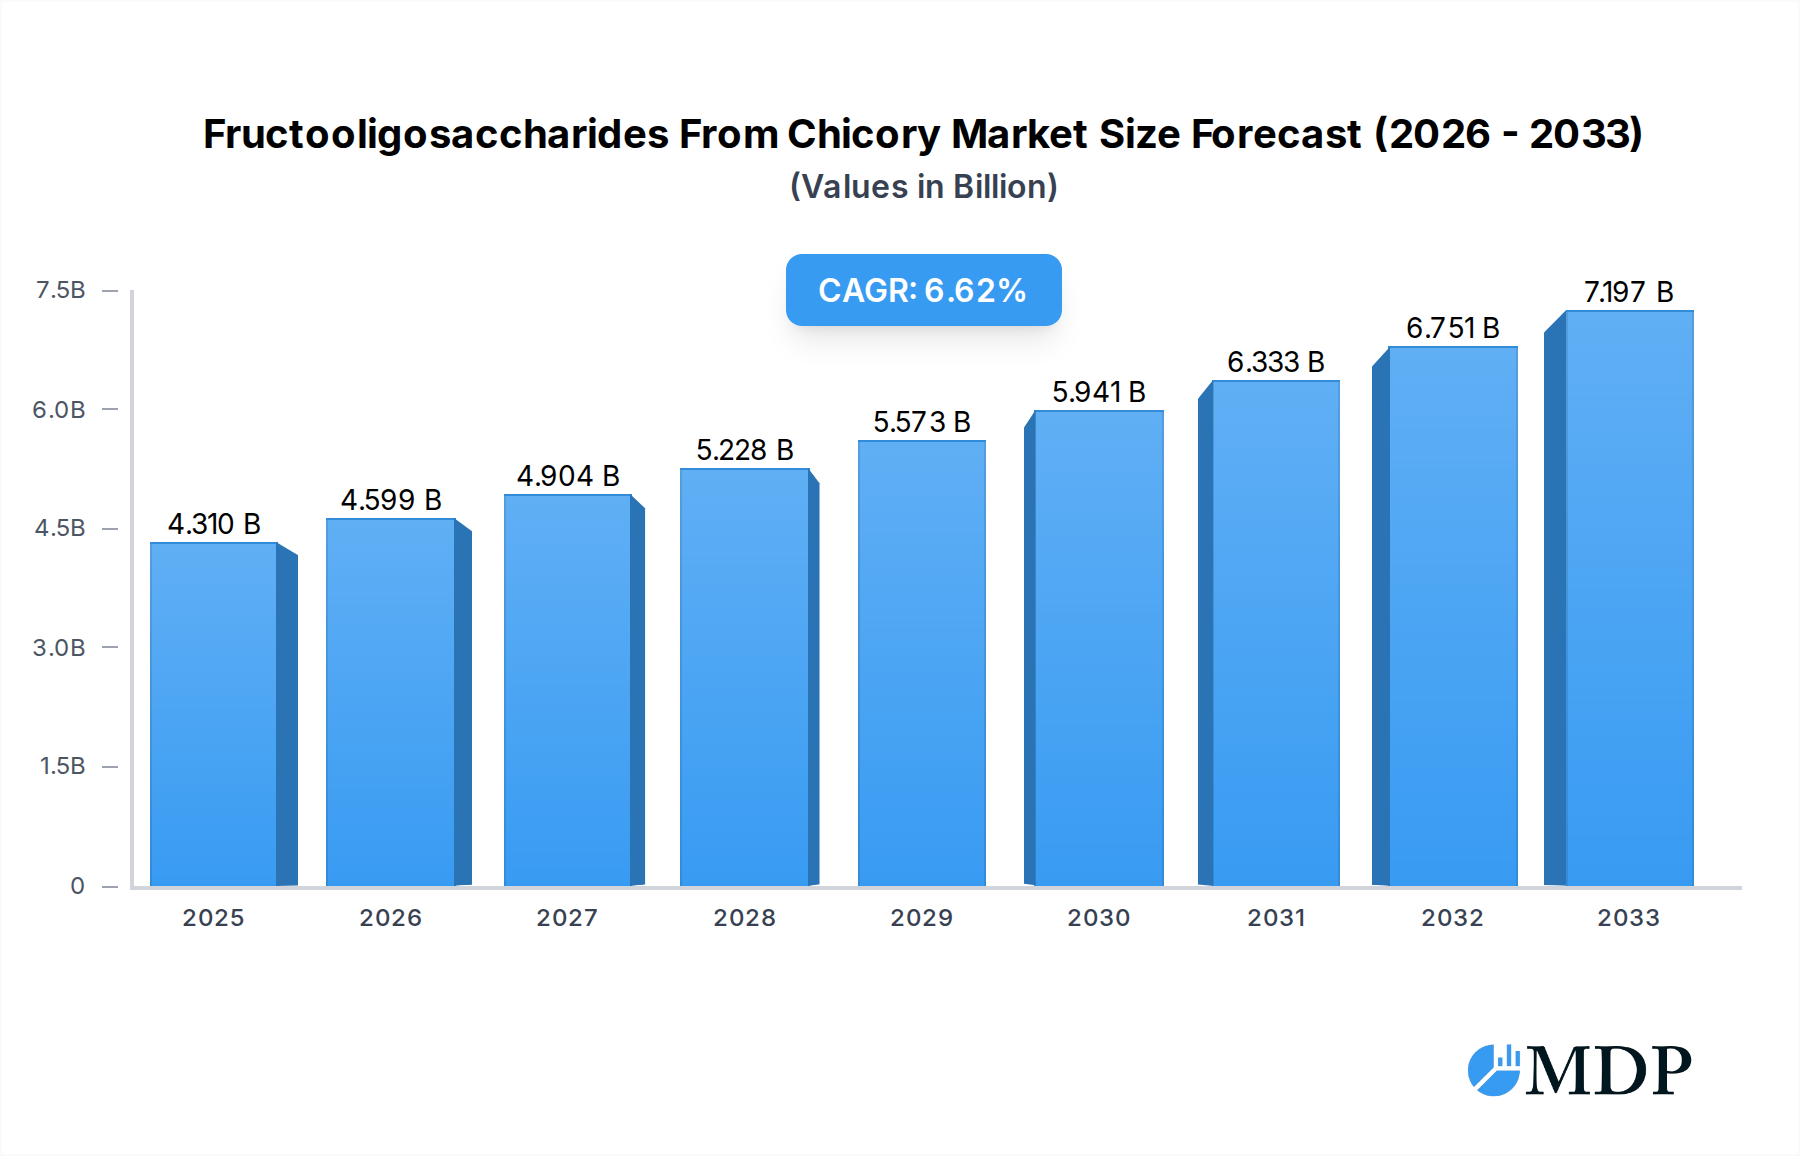
The Fructooligosaccharides (FOS) from Chicory market is poised for significant expansion, with a market size of USD 4.31 billion in 2025, projected to grow at a robust Compound Annual Growth Rate (CAGR) of 6.7% through 2033. This growth is primarily driven by escalating consumer demand for healthier food options and a heightened awareness of the benefits of prebiotics, such as improved gut health and digestion. The Food and Beverage sector emerges as the dominant application segment, fueled by the increasing incorporation of FOS as a natural sweetener and fiber-rich ingredient in a wide array of products, including dairy, baked goods, and beverages. Furthermore, the pharmaceutical industry's interest in FOS for its potential therapeutic applications in managing digestive disorders and enhancing nutrient absorption is also a key growth catalyst. The versatility of FOS, available in both solid and liquid forms, caters to diverse manufacturing needs, further solidifying its market position.
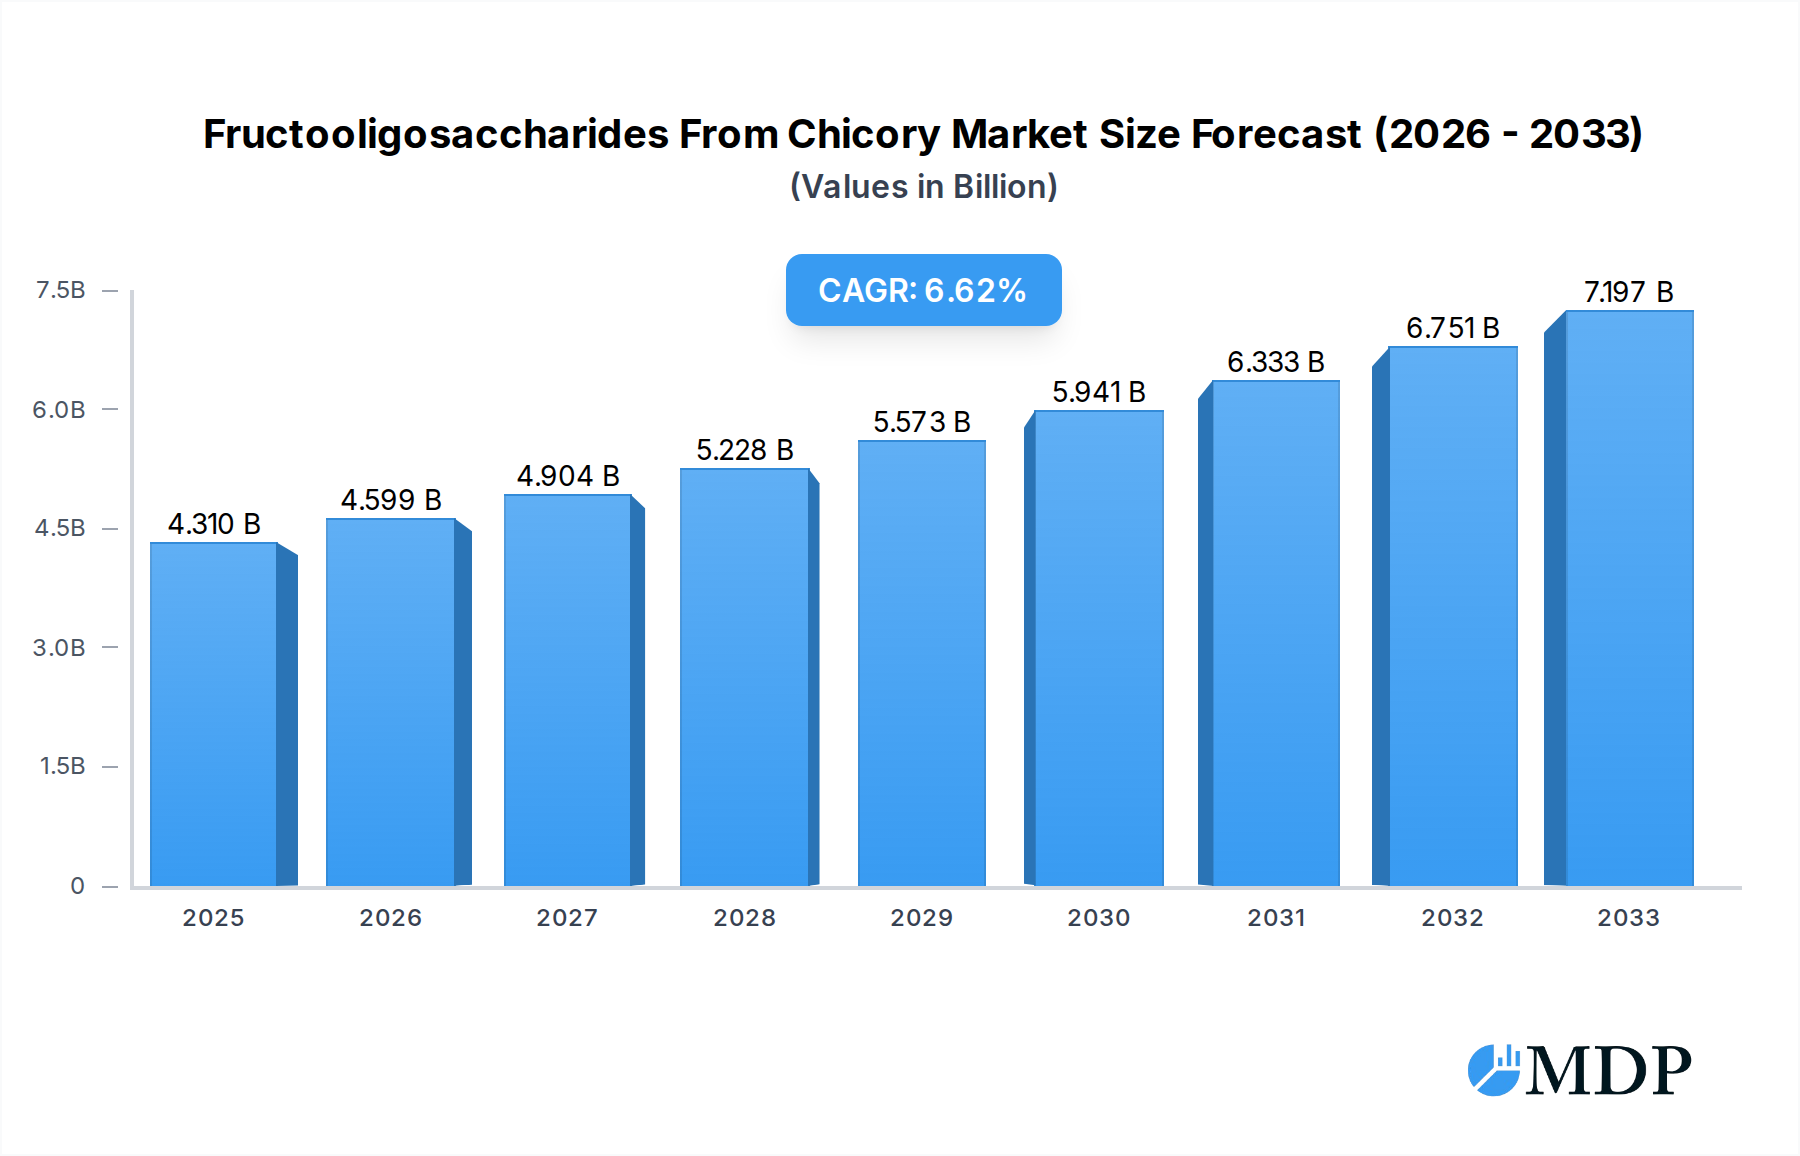
Fructooligosaccharides From Chicory Market Size (In Billion)

Key trends shaping the Fructooligosaccharides from Chicory market include the rising preference for plant-based and natural ingredients, aligning perfectly with the chicory source of FOS. Manufacturers are actively innovating, developing novel FOS-enriched products to meet evolving consumer preferences for functional foods and supplements. The growing focus on preventative healthcare and wellness is also a major tailwind, as consumers proactively seek ingredients that support their overall well-being. While the market exhibits strong growth potential, potential restraints such as fluctuating raw material prices and the need for stringent regulatory approvals in certain regions could pose challenges. Nevertheless, strategic collaborations, technological advancements in extraction and purification processes, and expanding distribution networks across key geographies are expected to mitigate these constraints and propel the market forward.
Fructooligosaccharides From Chicory Company Market Share
This comprehensive report offers an in-depth analysis of the Fructooligosaccharides (FOS) from Chicory market, providing critical insights for industry stakeholders, investors, and decision-makers. Delving into market dynamics, technological advancements, and consumer trends, this report covers the historical period of 2019–2024, the base year of 2025, and a robust forecast period extending to 2033. With a focus on high-traffic keywords such as "chicory FOS," "prebiotic fiber," "gut health ingredients," "functional foods," and "dietary supplements," this report is optimized for maximum search visibility and engagement. The market is projected to reach billions in value, driven by an increasing global demand for natural, health-promoting ingredients. This research provides actionable intelligence on market concentration, key growth drivers, emerging opportunities, and the competitive landscape, featuring leading companies and their strategic initiatives.
Fructooligosaccharides From Chicory Market Dynamics & Concentration
The Fructooligosaccharides (FOS) from Chicory market exhibits a moderate concentration, with several key players dominating significant market share. Meiji Holdings, Beneo-Orafti, and Cosucra are recognized for their substantial contributions and established market presence, collectively holding an estimated market share of over 40 billion. Innovation is a critical driver, fueled by ongoing research into the diverse health benefits of chicory FOS, particularly its prebiotic effects on gut microbiota. Regulatory frameworks, including food safety standards and labeling regulations in major economic blocs like the European Union and North America, are crucial in shaping market entry and product development. Product substitutes, such as other inulin types, galactooligosaccharides (GOS), and fermented ingredients, pose a competitive threat, necessitating continuous product differentiation and cost-efficiency. End-user trends are strongly influenced by growing consumer awareness of gut health and the demand for clean-label, plant-based ingredients. Mergers and acquisitions (M&A) activity has been present, with an estimated 5-7 significant deal counts observed historically, indicating a trend towards consolidation and strategic expansion, further influencing market concentration.
Fructooligosaccharides From Chicory Industry Trends & Analysis
The Fructooligosaccharides (FOS) from Chicory industry is poised for significant expansion, driven by a confluence of powerful trends and market forces. The projected Compound Annual Growth Rate (CAGR) for the forecast period 2025–2033 is an impressive 7.5 billion, indicating robust market penetration and increasing adoption across various applications. A primary growth driver is the escalating consumer demand for functional foods and beverages that offer tangible health benefits, with prebiotics like chicory FOS taking center stage. This surge in demand is underpinned by a growing scientific understanding of the gut-brain axis and the crucial role of a healthy microbiome in overall well-being, immunity, and even mental health. Technological disruptions, particularly in extraction and purification processes, are leading to improved product quality, higher yields, and more cost-effective production, making chicory FOS more accessible to manufacturers. Consumer preferences are increasingly leaning towards natural, plant-derived, and non-GMO ingredients, aligning perfectly with the characteristics of chicory FOS. The competitive dynamics within the industry are characterized by intense innovation, with companies focusing on product development, strategic partnerships, and market expansion to gain a competitive edge. The global market penetration of chicory FOS is projected to reach over 25% by 2033, fueled by its versatility, efficacy, and positive consumer perception as a natural health enhancer. The rise of personalized nutrition and the growing interest in ingredients that support digestive health are further accelerating market growth.
Leading Markets & Segments in Fructooligosaccharides From Chicory
The Food and Beverage segment is the undisputed leader in the Fructooligosaccharides (FOS) from Chicory market, commanding a substantial market share estimated at over 70% of the total market value. Within this segment, key drivers for dominance include the widespread incorporation of chicory FOS into everyday consumer products, such as dairy alternatives, baked goods, cereals, confectionery, and beverages. The growing trend of "better-for-you" products, driven by consumer demand for healthier options with added functional benefits, directly fuels this segment's growth. Economic policies supporting the food industry and the development of fortified food products in major economies contribute significantly to this dominance.
- Application Dominance (Food and Beverage):
- Consumer Demand for Gut Health: An increasing global awareness of digestive health and the role of prebiotics drives demand for FOS in food products.
- Versatility in Formulation: Chicory FOS's mild sweetness, ability to replace sugar and fat, and its neutral taste profile make it highly adaptable for various food applications.
- "Clean Label" Trend: Consumers actively seek natural, plant-derived ingredients, positioning chicory FOS as an ideal choice.
- Product Innovation: Manufacturers are continuously innovating with FOS to create novel functional food and beverage products.
The Pharmaceutical segment represents a significant and growing market for chicory FOS, primarily driven by its use in dietary supplements, medical foods, and as an excipient in drug formulations. Infrastructure supporting the nutraceutical and pharmaceutical industries in developed economies facilitates its widespread application.
- Application Dominance (Pharmaceutical):
- Dietary Supplements: High demand for prebiotic supplements to support gut health, immunity, and nutrient absorption.
- Medical Foods: Formulation of specialized dietary interventions for conditions requiring improved digestive function.
- Research & Development: Ongoing studies exploring potential therapeutic applications of chicory FOS in managing various health conditions.
In terms of Type, the Solid form of chicory FOS holds a dominant position, accounting for an estimated 65% of the market share, due to its ease of handling, storage, and incorporation into a wide range of powdered and solid food products. The Liquid form is also gaining traction, particularly in beverage applications and specialized liquid supplements.
- Type Dominance (Solid):
- Ease of Use: Superior handling and blending capabilities in dry mixes, powders, and solid food formulations.
- Stability: Enhanced shelf-life and stability in solid-state applications compared to liquid counterparts.
- Manufacturing Convenience: Simplifies production processes for manufacturers of dietary supplements and functional food ingredients.
Geographically, North America and Europe are leading markets, driven by high consumer awareness of health and wellness, robust regulatory support for functional ingredients, and established nutraceutical industries. The Asia-Pacific region is exhibiting rapid growth, fueled by increasing disposable incomes and a growing middle class adopting healthier lifestyles.
Fructooligosaccharides From Chicory Product Developments
Product developments in the Fructooligosaccharides (FOS) from Chicory sector are focused on enhancing purity, functionality, and application-specific formulations. Innovations include the development of highly concentrated FOS powders with improved solubility and reduced bitterness, catering to the demand for cleaner labels and more palatable end-products. Advanced extraction and purification technologies are yielding chicory FOS with specific chain-length distributions, optimizing prebiotic efficacy for targeted gut health benefits. Furthermore, advancements in encapsulation technologies are improving the stability and controlled release of FOS in challenging food matrices and pharmaceutical formulations, expanding its application scope and competitive advantage in the functional ingredients market.
Key Drivers of Fructooligosaccharides From Chicory Growth
The Fructooligosaccharides (FOS) from Chicory market growth is propelled by several key factors. Technologically, advancements in extraction and purification processes are leading to higher quality, more cost-effective FOS production. Economically, rising global disposable incomes and a growing middle class are fueling consumer spending on health-promoting food and supplements. Regulatory support for functional ingredients and clear labeling guidelines in major markets encourage product development and consumer adoption. Moreover, the increasing scientific evidence validating the health benefits of chicory FOS, particularly its prebiotic effects on gut health, immune function, and mineral absorption, is a significant market accelerator.
Challenges in the Fructooligosaccharides From Chicory Market
Despite its growth potential, the Fructooligosaccharides (FOS) from Chicory market faces several challenges. Regulatory hurdles in certain regions regarding novel ingredient approvals and labeling can slow down market entry. Supply chain complexities and the potential for price volatility of raw materials, specifically chicory root, can impact production costs. Competitive pressures from alternative prebiotic fibers and functional ingredients necessitate continuous innovation and cost optimization. Furthermore, consumer education remains a challenge, as a segment of the population may not fully understand the benefits of prebiotics, requiring ongoing marketing and awareness campaigns to drive broader adoption.
Emerging Opportunities in Fructooligosaccharides From Chicory
Emerging opportunities in the Fructooligosaccharides (FOS) from Chicory market are abundant. Technological breakthroughs in biotechnology and fermentation are paving the way for the development of novel FOS derivatives with enhanced functionalities and targeted health benefits. Strategic partnerships between FOS manufacturers and food and beverage companies offer significant potential for co-creation of innovative products and wider market penetration. Market expansion into emerging economies with growing health consciousness presents a vast untapped potential. The increasing focus on personalized nutrition and the development of gut-health specific formulations are also significant catalysts for long-term growth.
Leading Players in the Fructooligosaccharides From Chicory Sector
- Meiji Holdings
- Beneo-Orafti
- Cosucra
- Leroux
- Taiwan Sugar Corporation
- Quantum Hi-Tech Biological Corporation
- Baolingbao Biology Co.,Ltd
- Bailong Chuangyuan Bio-tech Co.,Ltd
- Welcome Pharmaceutica
- Tianmei Biotech
- Weinihao Food Technology Co.,Ltd.
- CJ CheilJedang
Key Milestones in Fructooligosaccharides From Chicory Industry
- 2019: Increased research publications highlighting the gut health benefits of chicory FOS, driving consumer awareness.
- 2020: Introduction of new chicory FOS-based product lines by major beverage manufacturers targeting digestive wellness.
- 2021: Significant investment in R&D by key players for improved extraction and purification technologies.
- 2022: Expansion of chicory FOS applications into baby food and infant formula categories due to its gentle nature.
- 2023: Growing trend of "symbiotic" products combining prebiotics (like chicory FOS) with probiotics.
- 2024: Increased M&A activities indicating consolidation and strategic expansion within the chicory FOS supply chain.
Strategic Outlook for Fructooligosaccharides From Chicory Market
The strategic outlook for the Fructooligosaccharides (FOS) from Chicory market is exceptionally positive, characterized by sustained growth and evolving opportunities. The increasing global focus on preventive healthcare and the well-documented benefits of FOS for gut health will continue to be primary growth accelerators. Manufacturers will likely see increased demand for customized FOS solutions tailored to specific application needs, from baked goods to specialized medical foods. Strategic collaborations between ingredient suppliers and end-product manufacturers will be crucial for product innovation and market reach. Furthermore, the ongoing exploration of new health benefits beyond digestive wellness, such as immune modulation and cognitive function, promises to unlock further market potential and solidify chicory FOS's position as a cornerstone ingredient in the functional food and health supplement industries.
Fructooligosaccharides From Chicory Segmentation
-
1. Application
- 1.1. Food and Beverage
- 1.2. Pharmaceutical
- 1.3. Others
-
2. Type
- 2.1. Solid
- 2.2. Liquid
Fructooligosaccharides From Chicory Segmentation By Geography
-
1. North America
- 1.1. United States
- 1.2. Canada
- 1.3. Mexico
-
2. South America
- 2.1. Brazil
- 2.2. Argentina
- 2.3. Rest of South America
-
3. Europe
- 3.1. United Kingdom
- 3.2. Germany
- 3.3. France
- 3.4. Italy
- 3.5. Spain
- 3.6. Russia
- 3.7. Benelux
- 3.8. Nordics
- 3.9. Rest of Europe
-
4. Middle East & Africa
- 4.1. Turkey
- 4.2. Israel
- 4.3. GCC
- 4.4. North Africa
- 4.5. South Africa
- 4.6. Rest of Middle East & Africa
-
5. Asia Pacific
- 5.1. China
- 5.2. India
- 5.3. Japan
- 5.4. South Korea
- 5.5. ASEAN
- 5.6. Oceania
- 5.7. Rest of Asia Pacific
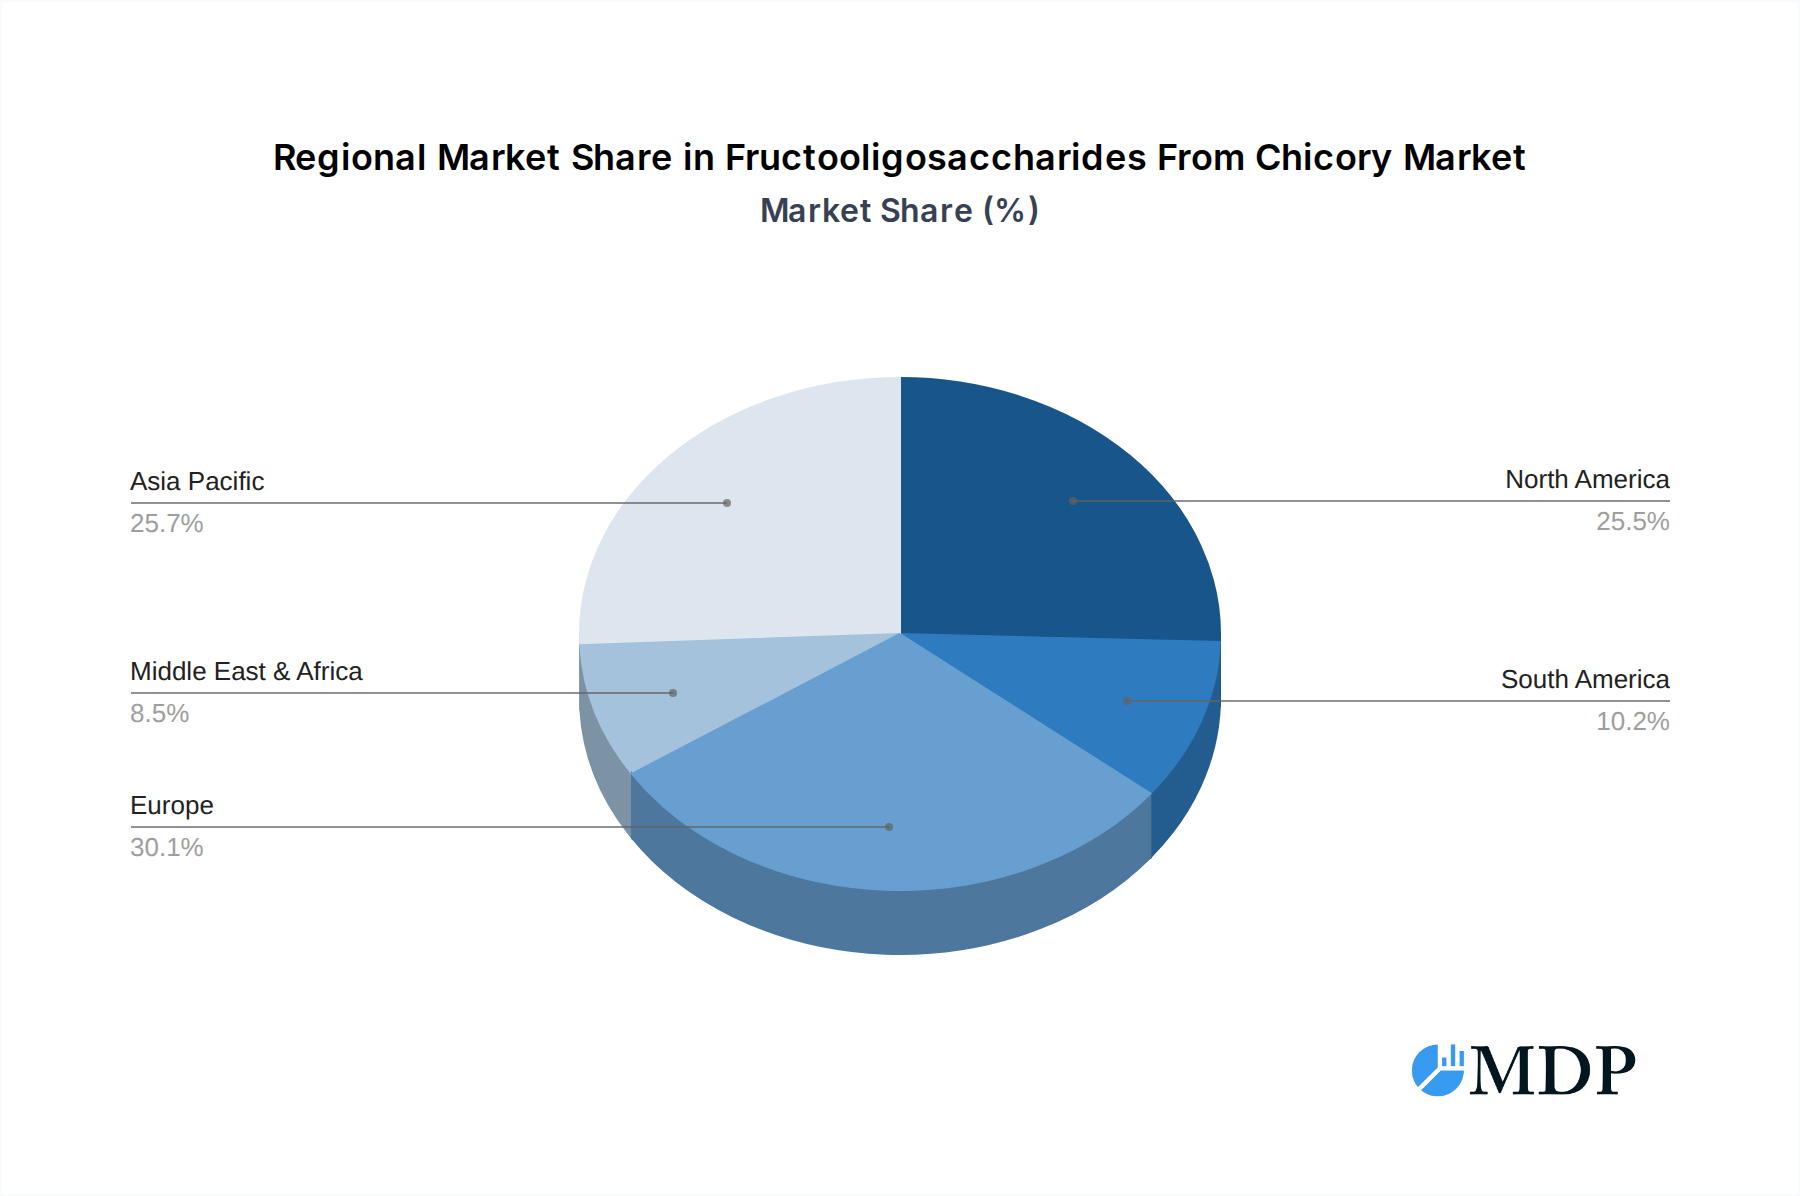
Fructooligosaccharides From Chicory Regional Market Share
Geographic Coverage of Fructooligosaccharides From Chicory
Fructooligosaccharides From Chicory REPORT HIGHLIGHTS
| Aspects | Details |
|---|---|
| Study Period | 2020-2034 |
| Base Year | 2025 |
| Estimated Year | 2026 |
| Forecast Period | 2026-2034 |
| Historical Period | 2020-2025 |
| Growth Rate | CAGR of 6.7% from 2020-2034 |
| Segmentation |
|
Table of Contents
- 1. Introduction
- 1.1. Research Scope
- 1.2. Market Segmentation
- 1.3. Research Objective
- 1.4. Definitions and Assumptions
- 2. Executive Summary
- 2.1. Market Snapshot
- 3. Market Dynamics
- 3.1. Market Drivers
- 3.2. Market Restrains
- 3.3. Market Trends
- 3.4. Market Opportunities
- 4. Market Factor Analysis
- 4.1. Porters Five Forces
- 4.1.1. Bargaining Power of Suppliers
- 4.1.2. Bargaining Power of Buyers
- 4.1.3. Threat of New Entrants
- 4.1.4. Threat of Substitutes
- 4.1.5. Competitive Rivalry
- 4.2. PESTEL analysis
- 4.3. BCG Analysis
- 4.3.1. Stars (High Growth, High Market Share)
- 4.3.2. Cash Cows (Low Growth, High Market Share)
- 4.3.3. Question Mark (High Growth, Low Market Share)
- 4.3.4. Dogs (Low Growth, Low Market Share)
- 4.4. Ansoff Matrix Analysis
- 4.5. Supply Chain Analysis
- 4.6. Regulatory Landscape
- 4.7. Current Market Potential and Opportunity Assessment (TAM–SAM–SOM Framework)
- 4.8. MDP Analyst Note
- 4.1. Porters Five Forces
- 5. Market Analysis, Insights and Forecast 2021-2033
- 5.1. Market Analysis, Insights and Forecast - by Application
- 5.1.1. Food and Beverage
- 5.1.2. Pharmaceutical
- 5.1.3. Others
- 5.2. Market Analysis, Insights and Forecast - by Type
- 5.2.1. Solid
- 5.2.2. Liquid
- 5.3. Market Analysis, Insights and Forecast - by Region
- 5.3.1. North America
- 5.3.2. South America
- 5.3.3. Europe
- 5.3.4. Middle East & Africa
- 5.3.5. Asia Pacific
- 5.1. Market Analysis, Insights and Forecast - by Application
- 6. Global Fructooligosaccharides From Chicory Analysis, Insights and Forecast, 2021-2033
- 6.1. Market Analysis, Insights and Forecast - by Application
- 6.1.1. Food and Beverage
- 6.1.2. Pharmaceutical
- 6.1.3. Others
- 6.2. Market Analysis, Insights and Forecast - by Type
- 6.2.1. Solid
- 6.2.2. Liquid
- 6.1. Market Analysis, Insights and Forecast - by Application
- 7. North America Fructooligosaccharides From Chicory Analysis, Insights and Forecast, 2020-2032
- 7.1. Market Analysis, Insights and Forecast - by Application
- 7.1.1. Food and Beverage
- 7.1.2. Pharmaceutical
- 7.1.3. Others
- 7.2. Market Analysis, Insights and Forecast - by Type
- 7.2.1. Solid
- 7.2.2. Liquid
- 7.1. Market Analysis, Insights and Forecast - by Application
- 8. South America Fructooligosaccharides From Chicory Analysis, Insights and Forecast, 2020-2032
- 8.1. Market Analysis, Insights and Forecast - by Application
- 8.1.1. Food and Beverage
- 8.1.2. Pharmaceutical
- 8.1.3. Others
- 8.2. Market Analysis, Insights and Forecast - by Type
- 8.2.1. Solid
- 8.2.2. Liquid
- 8.1. Market Analysis, Insights and Forecast - by Application
- 9. Europe Fructooligosaccharides From Chicory Analysis, Insights and Forecast, 2020-2032
- 9.1. Market Analysis, Insights and Forecast - by Application
- 9.1.1. Food and Beverage
- 9.1.2. Pharmaceutical
- 9.1.3. Others
- 9.2. Market Analysis, Insights and Forecast - by Type
- 9.2.1. Solid
- 9.2.2. Liquid
- 9.1. Market Analysis, Insights and Forecast - by Application
- 10. Middle East & Africa Fructooligosaccharides From Chicory Analysis, Insights and Forecast, 2020-2032
- 10.1. Market Analysis, Insights and Forecast - by Application
- 10.1.1. Food and Beverage
- 10.1.2. Pharmaceutical
- 10.1.3. Others
- 10.2. Market Analysis, Insights and Forecast - by Type
- 10.2.1. Solid
- 10.2.2. Liquid
- 10.1. Market Analysis, Insights and Forecast - by Application
- 11. Asia Pacific Fructooligosaccharides From Chicory Analysis, Insights and Forecast, 2020-2032
- 11.1. Market Analysis, Insights and Forecast - by Application
- 11.1.1. Food and Beverage
- 11.1.2. Pharmaceutical
- 11.1.3. Others
- 11.2. Market Analysis, Insights and Forecast - by Type
- 11.2.1. Solid
- 11.2.2. Liquid
- 11.1. Market Analysis, Insights and Forecast - by Application
- 12. Competitive Analysis
- 12.1. Company Profiles
- 12.1.1 Meiji Holdings
- 12.1.1.1. Company Overview
- 12.1.1.2. Products
- 12.1.1.3. Company Financials
- 12.1.1.4. SWOT Analysis
- 12.1.2 Beneo-Orafti
- 12.1.2.1. Company Overview
- 12.1.2.2. Products
- 12.1.2.3. Company Financials
- 12.1.2.4. SWOT Analysis
- 12.1.3 Cosucra
- 12.1.3.1. Company Overview
- 12.1.3.2. Products
- 12.1.3.3. Company Financials
- 12.1.3.4. SWOT Analysis
- 12.1.4 Leroux
- 12.1.4.1. Company Overview
- 12.1.4.2. Products
- 12.1.4.3. Company Financials
- 12.1.4.4. SWOT Analysis
- 12.1.5 Taiwan Sugar Corporation
- 12.1.5.1. Company Overview
- 12.1.5.2. Products
- 12.1.5.3. Company Financials
- 12.1.5.4. SWOT Analysis
- 12.1.6 Quantum Hi-Tech Biological Corporation
- 12.1.6.1. Company Overview
- 12.1.6.2. Products
- 12.1.6.3. Company Financials
- 12.1.6.4. SWOT Analysis
- 12.1.7 Baolingbao Biology Co.
- 12.1.7.1. Company Overview
- 12.1.7.2. Products
- 12.1.7.3. Company Financials
- 12.1.7.4. SWOT Analysis
- 12.1.8 Ltd
- 12.1.8.1. Company Overview
- 12.1.8.2. Products
- 12.1.8.3. Company Financials
- 12.1.8.4. SWOT Analysis
- 12.1.9 Bailong Chuangyuan Bio-tech Co.
- 12.1.9.1. Company Overview
- 12.1.9.2. Products
- 12.1.9.3. Company Financials
- 12.1.9.4. SWOT Analysis
- 12.1.10 Ltd
- 12.1.10.1. Company Overview
- 12.1.10.2. Products
- 12.1.10.3. Company Financials
- 12.1.10.4. SWOT Analysis
- 12.1.11 Welcome Pharmaceutica
- 12.1.11.1. Company Overview
- 12.1.11.2. Products
- 12.1.11.3. Company Financials
- 12.1.11.4. SWOT Analysis
- 12.1.12 Tianmei Biotech
- 12.1.12.1. Company Overview
- 12.1.12.2. Products
- 12.1.12.3. Company Financials
- 12.1.12.4. SWOT Analysis
- 12.1.13 Weinihao Food Technology Co.
- 12.1.13.1. Company Overview
- 12.1.13.2. Products
- 12.1.13.3. Company Financials
- 12.1.13.4. SWOT Analysis
- 12.1.14 Ltd.
- 12.1.14.1. Company Overview
- 12.1.14.2. Products
- 12.1.14.3. Company Financials
- 12.1.14.4. SWOT Analysis
- 12.1.15 CJ CheilJedang
- 12.1.15.1. Company Overview
- 12.1.15.2. Products
- 12.1.15.3. Company Financials
- 12.1.15.4. SWOT Analysis
- 12.1.1 Meiji Holdings
- 12.2. Market Entropy
- 12.2.1 Company's Key Areas Served
- 12.2.2 Recent Developments
- 12.3. Company Market Share Analysis 2025
- 12.3.1 Top 5 Companies Market Share Analysis
- 12.3.2 Top 3 Companies Market Share Analysis
- 12.4. List of Potential Customers
- 13. Research Methodology
List of Figures
- Figure 1: Global Fructooligosaccharides From Chicory Revenue Breakdown (billion, %) by Region 2025 & 2033
- Figure 2: Global Fructooligosaccharides From Chicory Volume Breakdown (K, %) by Region 2025 & 2033
- Figure 3: North America Fructooligosaccharides From Chicory Revenue (billion), by Application 2025 & 2033
- Figure 4: North America Fructooligosaccharides From Chicory Volume (K), by Application 2025 & 2033
- Figure 5: North America Fructooligosaccharides From Chicory Revenue Share (%), by Application 2025 & 2033
- Figure 6: North America Fructooligosaccharides From Chicory Volume Share (%), by Application 2025 & 2033
- Figure 7: North America Fructooligosaccharides From Chicory Revenue (billion), by Type 2025 & 2033
- Figure 8: North America Fructooligosaccharides From Chicory Volume (K), by Type 2025 & 2033
- Figure 9: North America Fructooligosaccharides From Chicory Revenue Share (%), by Type 2025 & 2033
- Figure 10: North America Fructooligosaccharides From Chicory Volume Share (%), by Type 2025 & 2033
- Figure 11: North America Fructooligosaccharides From Chicory Revenue (billion), by Country 2025 & 2033
- Figure 12: North America Fructooligosaccharides From Chicory Volume (K), by Country 2025 & 2033
- Figure 13: North America Fructooligosaccharides From Chicory Revenue Share (%), by Country 2025 & 2033
- Figure 14: North America Fructooligosaccharides From Chicory Volume Share (%), by Country 2025 & 2033
- Figure 15: South America Fructooligosaccharides From Chicory Revenue (billion), by Application 2025 & 2033
- Figure 16: South America Fructooligosaccharides From Chicory Volume (K), by Application 2025 & 2033
- Figure 17: South America Fructooligosaccharides From Chicory Revenue Share (%), by Application 2025 & 2033
- Figure 18: South America Fructooligosaccharides From Chicory Volume Share (%), by Application 2025 & 2033
- Figure 19: South America Fructooligosaccharides From Chicory Revenue (billion), by Type 2025 & 2033
- Figure 20: South America Fructooligosaccharides From Chicory Volume (K), by Type 2025 & 2033
- Figure 21: South America Fructooligosaccharides From Chicory Revenue Share (%), by Type 2025 & 2033
- Figure 22: South America Fructooligosaccharides From Chicory Volume Share (%), by Type 2025 & 2033
- Figure 23: South America Fructooligosaccharides From Chicory Revenue (billion), by Country 2025 & 2033
- Figure 24: South America Fructooligosaccharides From Chicory Volume (K), by Country 2025 & 2033
- Figure 25: South America Fructooligosaccharides From Chicory Revenue Share (%), by Country 2025 & 2033
- Figure 26: South America Fructooligosaccharides From Chicory Volume Share (%), by Country 2025 & 2033
- Figure 27: Europe Fructooligosaccharides From Chicory Revenue (billion), by Application 2025 & 2033
- Figure 28: Europe Fructooligosaccharides From Chicory Volume (K), by Application 2025 & 2033
- Figure 29: Europe Fructooligosaccharides From Chicory Revenue Share (%), by Application 2025 & 2033
- Figure 30: Europe Fructooligosaccharides From Chicory Volume Share (%), by Application 2025 & 2033
- Figure 31: Europe Fructooligosaccharides From Chicory Revenue (billion), by Type 2025 & 2033
- Figure 32: Europe Fructooligosaccharides From Chicory Volume (K), by Type 2025 & 2033
- Figure 33: Europe Fructooligosaccharides From Chicory Revenue Share (%), by Type 2025 & 2033
- Figure 34: Europe Fructooligosaccharides From Chicory Volume Share (%), by Type 2025 & 2033
- Figure 35: Europe Fructooligosaccharides From Chicory Revenue (billion), by Country 2025 & 2033
- Figure 36: Europe Fructooligosaccharides From Chicory Volume (K), by Country 2025 & 2033
- Figure 37: Europe Fructooligosaccharides From Chicory Revenue Share (%), by Country 2025 & 2033
- Figure 38: Europe Fructooligosaccharides From Chicory Volume Share (%), by Country 2025 & 2033
- Figure 39: Middle East & Africa Fructooligosaccharides From Chicory Revenue (billion), by Application 2025 & 2033
- Figure 40: Middle East & Africa Fructooligosaccharides From Chicory Volume (K), by Application 2025 & 2033
- Figure 41: Middle East & Africa Fructooligosaccharides From Chicory Revenue Share (%), by Application 2025 & 2033
- Figure 42: Middle East & Africa Fructooligosaccharides From Chicory Volume Share (%), by Application 2025 & 2033
- Figure 43: Middle East & Africa Fructooligosaccharides From Chicory Revenue (billion), by Type 2025 & 2033
- Figure 44: Middle East & Africa Fructooligosaccharides From Chicory Volume (K), by Type 2025 & 2033
- Figure 45: Middle East & Africa Fructooligosaccharides From Chicory Revenue Share (%), by Type 2025 & 2033
- Figure 46: Middle East & Africa Fructooligosaccharides From Chicory Volume Share (%), by Type 2025 & 2033
- Figure 47: Middle East & Africa Fructooligosaccharides From Chicory Revenue (billion), by Country 2025 & 2033
- Figure 48: Middle East & Africa Fructooligosaccharides From Chicory Volume (K), by Country 2025 & 2033
- Figure 49: Middle East & Africa Fructooligosaccharides From Chicory Revenue Share (%), by Country 2025 & 2033
- Figure 50: Middle East & Africa Fructooligosaccharides From Chicory Volume Share (%), by Country 2025 & 2033
- Figure 51: Asia Pacific Fructooligosaccharides From Chicory Revenue (billion), by Application 2025 & 2033
- Figure 52: Asia Pacific Fructooligosaccharides From Chicory Volume (K), by Application 2025 & 2033
- Figure 53: Asia Pacific Fructooligosaccharides From Chicory Revenue Share (%), by Application 2025 & 2033
- Figure 54: Asia Pacific Fructooligosaccharides From Chicory Volume Share (%), by Application 2025 & 2033
- Figure 55: Asia Pacific Fructooligosaccharides From Chicory Revenue (billion), by Type 2025 & 2033
- Figure 56: Asia Pacific Fructooligosaccharides From Chicory Volume (K), by Type 2025 & 2033
- Figure 57: Asia Pacific Fructooligosaccharides From Chicory Revenue Share (%), by Type 2025 & 2033
- Figure 58: Asia Pacific Fructooligosaccharides From Chicory Volume Share (%), by Type 2025 & 2033
- Figure 59: Asia Pacific Fructooligosaccharides From Chicory Revenue (billion), by Country 2025 & 2033
- Figure 60: Asia Pacific Fructooligosaccharides From Chicory Volume (K), by Country 2025 & 2033
- Figure 61: Asia Pacific Fructooligosaccharides From Chicory Revenue Share (%), by Country 2025 & 2033
- Figure 62: Asia Pacific Fructooligosaccharides From Chicory Volume Share (%), by Country 2025 & 2033
List of Tables
- Table 1: Global Fructooligosaccharides From Chicory Revenue billion Forecast, by Application 2020 & 2033
- Table 2: Global Fructooligosaccharides From Chicory Volume K Forecast, by Application 2020 & 2033
- Table 3: Global Fructooligosaccharides From Chicory Revenue billion Forecast, by Type 2020 & 2033
- Table 4: Global Fructooligosaccharides From Chicory Volume K Forecast, by Type 2020 & 2033
- Table 5: Global Fructooligosaccharides From Chicory Revenue billion Forecast, by Region 2020 & 2033
- Table 6: Global Fructooligosaccharides From Chicory Volume K Forecast, by Region 2020 & 2033
- Table 7: Global Fructooligosaccharides From Chicory Revenue billion Forecast, by Application 2020 & 2033
- Table 8: Global Fructooligosaccharides From Chicory Volume K Forecast, by Application 2020 & 2033
- Table 9: Global Fructooligosaccharides From Chicory Revenue billion Forecast, by Type 2020 & 2033
- Table 10: Global Fructooligosaccharides From Chicory Volume K Forecast, by Type 2020 & 2033
- Table 11: Global Fructooligosaccharides From Chicory Revenue billion Forecast, by Country 2020 & 2033
- Table 12: Global Fructooligosaccharides From Chicory Volume K Forecast, by Country 2020 & 2033
- Table 13: United States Fructooligosaccharides From Chicory Revenue (billion) Forecast, by Application 2020 & 2033
- Table 14: United States Fructooligosaccharides From Chicory Volume (K) Forecast, by Application 2020 & 2033
- Table 15: Canada Fructooligosaccharides From Chicory Revenue (billion) Forecast, by Application 2020 & 2033
- Table 16: Canada Fructooligosaccharides From Chicory Volume (K) Forecast, by Application 2020 & 2033
- Table 17: Mexico Fructooligosaccharides From Chicory Revenue (billion) Forecast, by Application 2020 & 2033
- Table 18: Mexico Fructooligosaccharides From Chicory Volume (K) Forecast, by Application 2020 & 2033
- Table 19: Global Fructooligosaccharides From Chicory Revenue billion Forecast, by Application 2020 & 2033
- Table 20: Global Fructooligosaccharides From Chicory Volume K Forecast, by Application 2020 & 2033
- Table 21: Global Fructooligosaccharides From Chicory Revenue billion Forecast, by Type 2020 & 2033
- Table 22: Global Fructooligosaccharides From Chicory Volume K Forecast, by Type 2020 & 2033
- Table 23: Global Fructooligosaccharides From Chicory Revenue billion Forecast, by Country 2020 & 2033
- Table 24: Global Fructooligosaccharides From Chicory Volume K Forecast, by Country 2020 & 2033
- Table 25: Brazil Fructooligosaccharides From Chicory Revenue (billion) Forecast, by Application 2020 & 2033
- Table 26: Brazil Fructooligosaccharides From Chicory Volume (K) Forecast, by Application 2020 & 2033
- Table 27: Argentina Fructooligosaccharides From Chicory Revenue (billion) Forecast, by Application 2020 & 2033
- Table 28: Argentina Fructooligosaccharides From Chicory Volume (K) Forecast, by Application 2020 & 2033
- Table 29: Rest of South America Fructooligosaccharides From Chicory Revenue (billion) Forecast, by Application 2020 & 2033
- Table 30: Rest of South America Fructooligosaccharides From Chicory Volume (K) Forecast, by Application 2020 & 2033
- Table 31: Global Fructooligosaccharides From Chicory Revenue billion Forecast, by Application 2020 & 2033
- Table 32: Global Fructooligosaccharides From Chicory Volume K Forecast, by Application 2020 & 2033
- Table 33: Global Fructooligosaccharides From Chicory Revenue billion Forecast, by Type 2020 & 2033
- Table 34: Global Fructooligosaccharides From Chicory Volume K Forecast, by Type 2020 & 2033
- Table 35: Global Fructooligosaccharides From Chicory Revenue billion Forecast, by Country 2020 & 2033
- Table 36: Global Fructooligosaccharides From Chicory Volume K Forecast, by Country 2020 & 2033
- Table 37: United Kingdom Fructooligosaccharides From Chicory Revenue (billion) Forecast, by Application 2020 & 2033
- Table 38: United Kingdom Fructooligosaccharides From Chicory Volume (K) Forecast, by Application 2020 & 2033
- Table 39: Germany Fructooligosaccharides From Chicory Revenue (billion) Forecast, by Application 2020 & 2033
- Table 40: Germany Fructooligosaccharides From Chicory Volume (K) Forecast, by Application 2020 & 2033
- Table 41: France Fructooligosaccharides From Chicory Revenue (billion) Forecast, by Application 2020 & 2033
- Table 42: France Fructooligosaccharides From Chicory Volume (K) Forecast, by Application 2020 & 2033
- Table 43: Italy Fructooligosaccharides From Chicory Revenue (billion) Forecast, by Application 2020 & 2033
- Table 44: Italy Fructooligosaccharides From Chicory Volume (K) Forecast, by Application 2020 & 2033
- Table 45: Spain Fructooligosaccharides From Chicory Revenue (billion) Forecast, by Application 2020 & 2033
- Table 46: Spain Fructooligosaccharides From Chicory Volume (K) Forecast, by Application 2020 & 2033
- Table 47: Russia Fructooligosaccharides From Chicory Revenue (billion) Forecast, by Application 2020 & 2033
- Table 48: Russia Fructooligosaccharides From Chicory Volume (K) Forecast, by Application 2020 & 2033
- Table 49: Benelux Fructooligosaccharides From Chicory Revenue (billion) Forecast, by Application 2020 & 2033
- Table 50: Benelux Fructooligosaccharides From Chicory Volume (K) Forecast, by Application 2020 & 2033
- Table 51: Nordics Fructooligosaccharides From Chicory Revenue (billion) Forecast, by Application 2020 & 2033
- Table 52: Nordics Fructooligosaccharides From Chicory Volume (K) Forecast, by Application 2020 & 2033
- Table 53: Rest of Europe Fructooligosaccharides From Chicory Revenue (billion) Forecast, by Application 2020 & 2033
- Table 54: Rest of Europe Fructooligosaccharides From Chicory Volume (K) Forecast, by Application 2020 & 2033
- Table 55: Global Fructooligosaccharides From Chicory Revenue billion Forecast, by Application 2020 & 2033
- Table 56: Global Fructooligosaccharides From Chicory Volume K Forecast, by Application 2020 & 2033
- Table 57: Global Fructooligosaccharides From Chicory Revenue billion Forecast, by Type 2020 & 2033
- Table 58: Global Fructooligosaccharides From Chicory Volume K Forecast, by Type 2020 & 2033
- Table 59: Global Fructooligosaccharides From Chicory Revenue billion Forecast, by Country 2020 & 2033
- Table 60: Global Fructooligosaccharides From Chicory Volume K Forecast, by Country 2020 & 2033
- Table 61: Turkey Fructooligosaccharides From Chicory Revenue (billion) Forecast, by Application 2020 & 2033
- Table 62: Turkey Fructooligosaccharides From Chicory Volume (K) Forecast, by Application 2020 & 2033
- Table 63: Israel Fructooligosaccharides From Chicory Revenue (billion) Forecast, by Application 2020 & 2033
- Table 64: Israel Fructooligosaccharides From Chicory Volume (K) Forecast, by Application 2020 & 2033
- Table 65: GCC Fructooligosaccharides From Chicory Revenue (billion) Forecast, by Application 2020 & 2033
- Table 66: GCC Fructooligosaccharides From Chicory Volume (K) Forecast, by Application 2020 & 2033
- Table 67: North Africa Fructooligosaccharides From Chicory Revenue (billion) Forecast, by Application 2020 & 2033
- Table 68: North Africa Fructooligosaccharides From Chicory Volume (K) Forecast, by Application 2020 & 2033
- Table 69: South Africa Fructooligosaccharides From Chicory Revenue (billion) Forecast, by Application 2020 & 2033
- Table 70: South Africa Fructooligosaccharides From Chicory Volume (K) Forecast, by Application 2020 & 2033
- Table 71: Rest of Middle East & Africa Fructooligosaccharides From Chicory Revenue (billion) Forecast, by Application 2020 & 2033
- Table 72: Rest of Middle East & Africa Fructooligosaccharides From Chicory Volume (K) Forecast, by Application 2020 & 2033
- Table 73: Global Fructooligosaccharides From Chicory Revenue billion Forecast, by Application 2020 & 2033
- Table 74: Global Fructooligosaccharides From Chicory Volume K Forecast, by Application 2020 & 2033
- Table 75: Global Fructooligosaccharides From Chicory Revenue billion Forecast, by Type 2020 & 2033
- Table 76: Global Fructooligosaccharides From Chicory Volume K Forecast, by Type 2020 & 2033
- Table 77: Global Fructooligosaccharides From Chicory Revenue billion Forecast, by Country 2020 & 2033
- Table 78: Global Fructooligosaccharides From Chicory Volume K Forecast, by Country 2020 & 2033
- Table 79: China Fructooligosaccharides From Chicory Revenue (billion) Forecast, by Application 2020 & 2033
- Table 80: China Fructooligosaccharides From Chicory Volume (K) Forecast, by Application 2020 & 2033
- Table 81: India Fructooligosaccharides From Chicory Revenue (billion) Forecast, by Application 2020 & 2033
- Table 82: India Fructooligosaccharides From Chicory Volume (K) Forecast, by Application 2020 & 2033
- Table 83: Japan Fructooligosaccharides From Chicory Revenue (billion) Forecast, by Application 2020 & 2033
- Table 84: Japan Fructooligosaccharides From Chicory Volume (K) Forecast, by Application 2020 & 2033
- Table 85: South Korea Fructooligosaccharides From Chicory Revenue (billion) Forecast, by Application 2020 & 2033
- Table 86: South Korea Fructooligosaccharides From Chicory Volume (K) Forecast, by Application 2020 & 2033
- Table 87: ASEAN Fructooligosaccharides From Chicory Revenue (billion) Forecast, by Application 2020 & 2033
- Table 88: ASEAN Fructooligosaccharides From Chicory Volume (K) Forecast, by Application 2020 & 2033
- Table 89: Oceania Fructooligosaccharides From Chicory Revenue (billion) Forecast, by Application 2020 & 2033
- Table 90: Oceania Fructooligosaccharides From Chicory Volume (K) Forecast, by Application 2020 & 2033
- Table 91: Rest of Asia Pacific Fructooligosaccharides From Chicory Revenue (billion) Forecast, by Application 2020 & 2033
- Table 92: Rest of Asia Pacific Fructooligosaccharides From Chicory Volume (K) Forecast, by Application 2020 & 2033
Frequently Asked Questions
1. What is the projected Compound Annual Growth Rate (CAGR) of the Fructooligosaccharides From Chicory?
The projected CAGR is approximately 6.7%.
2. Which companies are prominent players in the Fructooligosaccharides From Chicory?
Key companies in the market include Meiji Holdings, Beneo-Orafti, Cosucra, Leroux, Taiwan Sugar Corporation, Quantum Hi-Tech Biological Corporation, Baolingbao Biology Co., Ltd, Bailong Chuangyuan Bio-tech Co., Ltd, Welcome Pharmaceutica, Tianmei Biotech, Weinihao Food Technology Co., Ltd., CJ CheilJedang.
3. What are the main segments of the Fructooligosaccharides From Chicory?
The market segments include Application, Type.
4. Can you provide details about the market size?
The market size is estimated to be USD 4.31 billion as of 2022.
5. What are some drivers contributing to market growth?
N/A
6. What are the notable trends driving market growth?
N/A
7. Are there any restraints impacting market growth?
N/A
8. Can you provide examples of recent developments in the market?
N/A
9. What pricing options are available for accessing the report?
Pricing options include single-user, multi-user, and enterprise licenses priced at USD 3950.00, USD 5925.00, and USD 7900.00 respectively.
10. Is the market size provided in terms of value or volume?
The market size is provided in terms of value, measured in billion and volume, measured in K.
11. Are there any specific market keywords associated with the report?
Yes, the market keyword associated with the report is "Fructooligosaccharides From Chicory," which aids in identifying and referencing the specific market segment covered.
12. How do I determine which pricing option suits my needs best?
The pricing options vary based on user requirements and access needs. Individual users may opt for single-user licenses, while businesses requiring broader access may choose multi-user or enterprise licenses for cost-effective access to the report.
13. Are there any additional resources or data provided in the Fructooligosaccharides From Chicory report?
While the report offers comprehensive insights, it's advisable to review the specific contents or supplementary materials provided to ascertain if additional resources or data are available.
14. How can I stay updated on further developments or reports in the Fructooligosaccharides From Chicory?
To stay informed about further developments, trends, and reports in the Fructooligosaccharides From Chicory, consider subscribing to industry newsletters, following relevant companies and organizations, or regularly checking reputable industry news sources and publications.
Methodology
Step 1 - Identification of Relevant Samples Size from Population Database
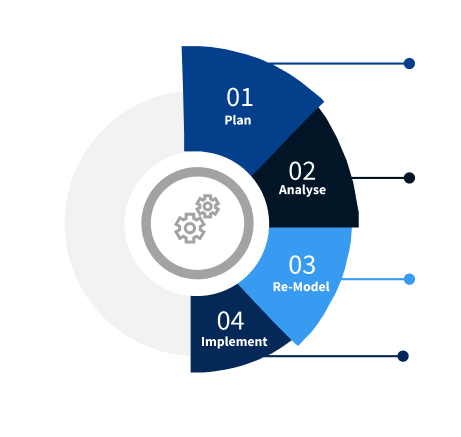
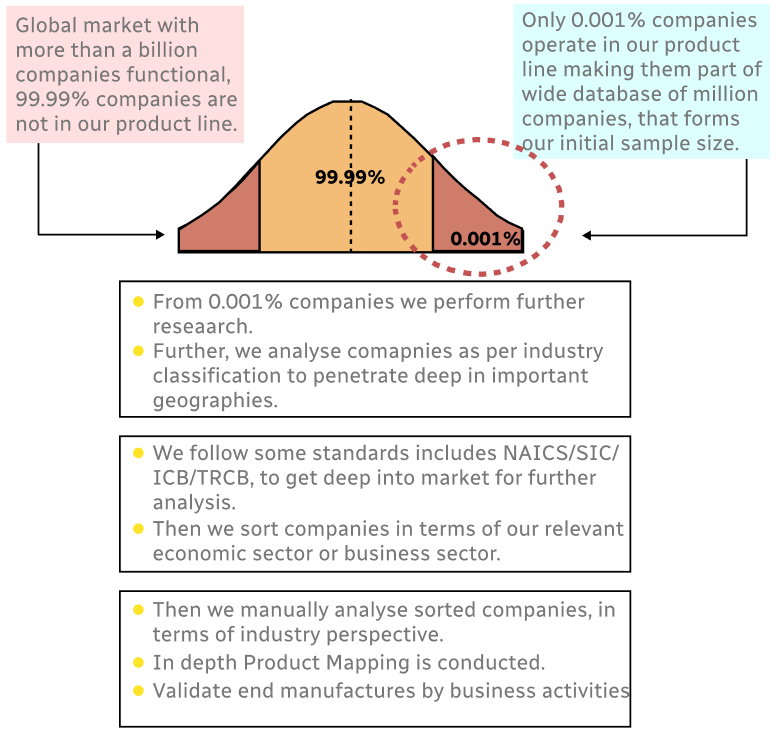
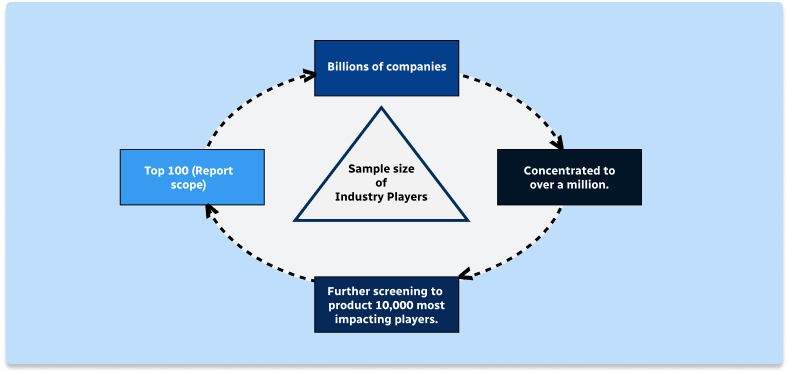
Step 2 - Approaches for Defining Global Market Size (Value, Volume* & Price*)
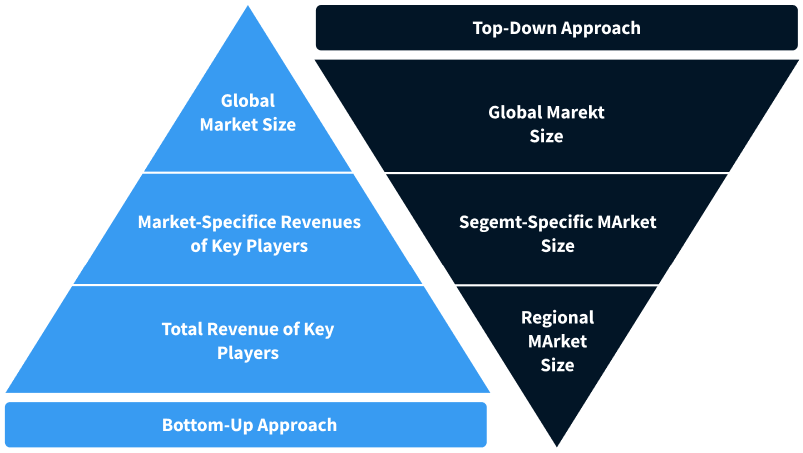
Note*: In applicable scenarios
Step 3 - Data Sources
Primary Research
- Web Analytics
- Survey Reports
- Research Institute
- Latest Research Reports
- Opinion Leaders
Secondary Research
- Annual Reports
- White Paper
- Latest Press Release
- Industry Association
- Paid Database
- Investor Presentations
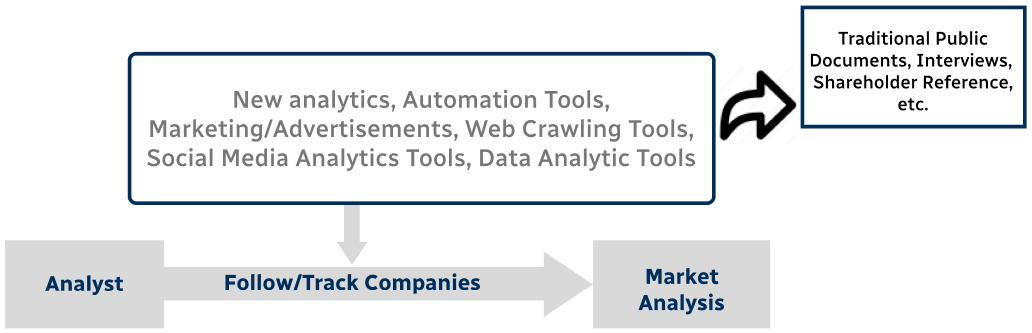
Step 4 - Data Triangulation
Involves using different sources of information in order to increase the validity of a study
These sources are likely to be stakeholders in a program - participants, other researchers, program staff, other community members, and so on.
Then we put all data in single framework & apply various statistical tools to find out the dynamic on the market.
During the analysis stage, feedback from the stakeholder groups would be compared to determine areas of agreement as well as areas of divergence