

Key Insights
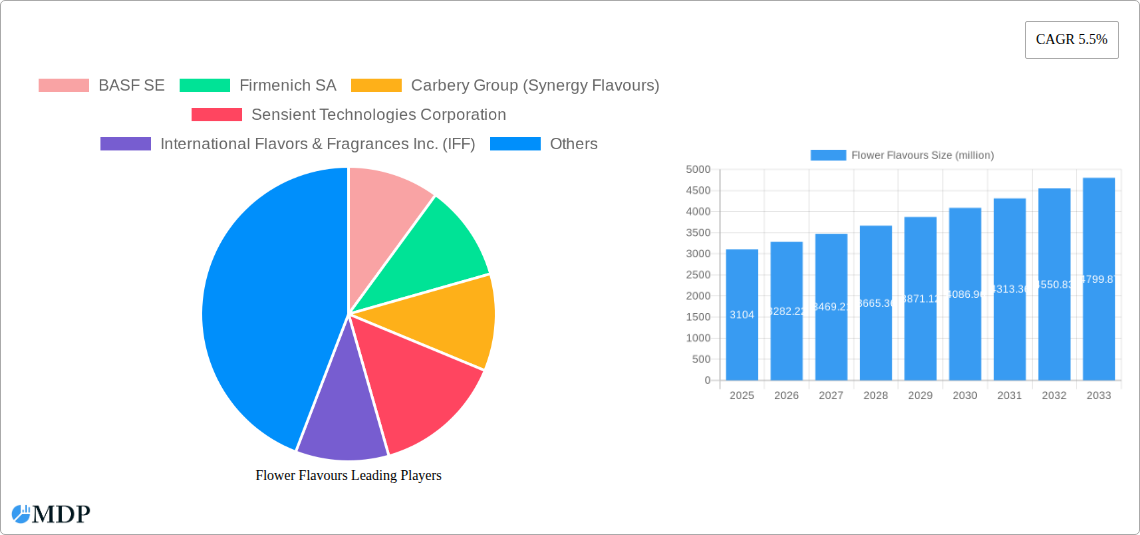
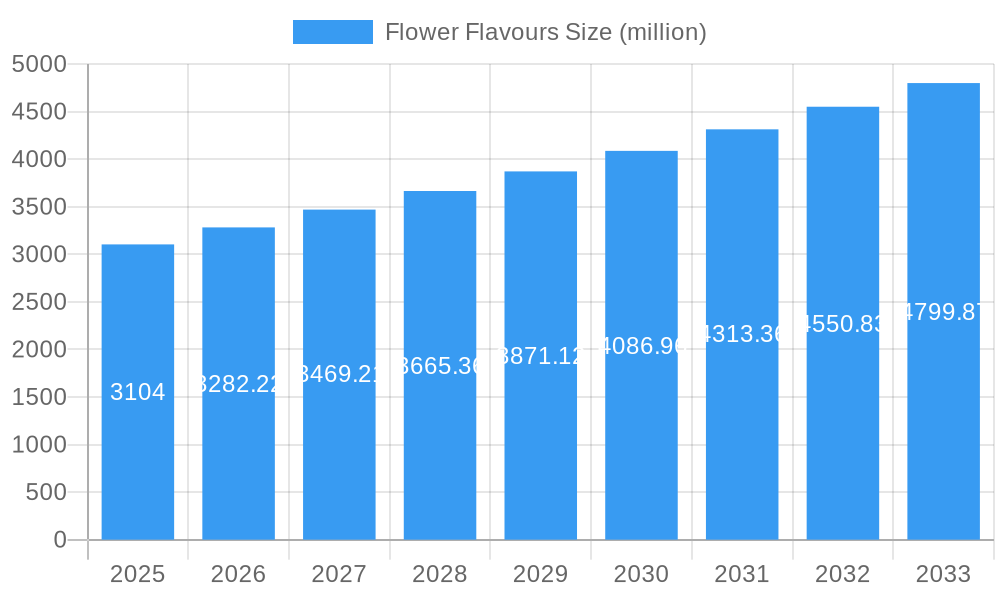
The global flower flavor market, valued at $3.104 billion in 2025, is projected to experience robust growth, exhibiting a Compound Annual Growth Rate (CAGR) of 5.5% from 2025 to 2033. This expansion is driven by several key factors. The rising demand for natural and organic food and beverage products fuels the adoption of flower flavors as a clean-label alternative to artificial counterparts. The increasing popularity of floral-infused beverages, desserts, and confectionery, particularly among health-conscious consumers, further boosts market growth. Innovation in flavor profiles, with the introduction of unique and exotic flower extracts, also contributes significantly to market expansion. Furthermore, the growing interest in artisanal and gourmet food products creates a niche market for premium flower flavors, commanding higher price points. Major players like BASF SE, Firmenich SA, and International Flavors & Fragrances Inc. (IFF) are actively investing in research and development to expand their product portfolios and cater to evolving consumer preferences.
Flower Flavours Market Size (In Billion)
The market faces certain restraints, primarily related to the cost of sourcing high-quality floral raw materials and the challenges associated with maintaining consistent flavor profiles across different batches. However, technological advancements in extraction and processing techniques are mitigating these challenges, ensuring cost-efficiency and improved quality control. Market segmentation is influenced by various factors, including flower type (rose, lavender, jasmine, etc.), application (food & beverage, personal care, pharmaceuticals), and geographical region. The North American and European markets currently hold significant shares, but emerging economies in Asia-Pacific are expected to demonstrate rapid growth in the coming years, driven by rising disposable incomes and changing consumption patterns. The continued focus on sustainability and ethical sourcing within the supply chain will further shape the market landscape in the coming decade.
Flower Flavours Company Market Share
Flower Flavours Market Report: A Comprehensive Analysis (2019-2033)
This comprehensive report delivers an in-depth analysis of the global flower flavours market, providing invaluable insights for stakeholders seeking to navigate this dynamic landscape. With a study period spanning 2019-2033, a base year of 2025, and a forecast period from 2025-2033, this report offers a historical perspective and future projections to guide strategic decision-making. The market is projected to reach $XX million by 2033, representing a significant CAGR of XX% during the forecast period. This report features data and analysis from key players including BASF SE, Firmenich SA, Carbery Group (Synergy Flavours), Sensient Technologies Corporation, International Flavors & Fragrances Inc. (IFF), Abelei Inc., Mane SA, Teawolf Inc., Frutarom Industries Ltd., and Döhler GmbH.
Flower Flavours Market Dynamics & Concentration
The flower flavours market exhibits a moderately concentrated structure, with several major players holding significant market share. In 2025, the top five companies—BASF SE, Firmenich SA, Carbery Group (Synergy Flavours), Sensient Technologies Corporation, and IFF—are estimated to collectively control approximately 60% of the global market. Market concentration is influenced by factors including economies of scale in production, strong R&D capabilities, and extensive distribution networks. Innovation plays a crucial role, with companies continuously developing novel flower flavour profiles and extraction techniques to meet evolving consumer preferences. Stringent regulatory frameworks surrounding food safety and authenticity also shape the market dynamics. The presence of natural and artificial substitutes, particularly synthetic flavour compounds, introduces competitive pressures. End-user trends towards natural and clean-label products are driving innovation in extraction methods and flavour development. Mergers and acquisitions (M&A) have played a significant role in consolidating market share, with an estimated XX M&A deals occurring between 2019 and 2024.
- Market Share (2025): Top 5 players – 60%
- M&A Deals (2019-2024): XX
- Key Innovation Drivers: Natural extraction methods, flavour profile diversification, clean-label solutions.
- Regulatory Impact: Increasing scrutiny on ingredient sourcing and labelling.
Flower Flavours Industry Trends & Analysis
The global flower flavours market is experiencing robust growth driven by several factors. The increasing demand for natural and authentic flavours in food and beverage products is a key driver. Consumers are increasingly seeking products with clean labels, free from artificial ingredients, which is boosting the demand for naturally derived flower flavours. Technological advancements in extraction and processing techniques are improving the quality, consistency, and cost-effectiveness of flower flavour production. This includes techniques like supercritical CO2 extraction, which allows for the extraction of high-quality flavours while minimizing the use of solvents. The market is witnessing the rise of personalized flavour profiles, catering to diverse regional palates and consumer preferences. Competitive dynamics are marked by both innovation and consolidation, with major players focusing on product diversification, strategic partnerships, and acquisitions to expand their market reach. The market is projected to experience a compound annual growth rate (CAGR) of XX% from 2025 to 2033. Market penetration in developing economies is also expected to increase due to the rising disposable incomes and changing consumer preferences.
Leading Markets & Segments in Flower Flavours
The Asia-Pacific region currently holds the largest market share in the global flower flavours market, driven primarily by strong demand from countries like China and India. This dominance is attributable to several factors:
- Economic Growth: Rising disposable incomes in many Asian countries are fueling increased consumer spending on food and beverage products.
- Cultural Preferences: Flower flavours are deeply ingrained in the culinary traditions of many Asian countries, contributing to high demand.
- Infrastructure Development: Improvements in food processing infrastructure are supporting the growth of the flower flavour industry.
In addition, the food and beverage industry is the leading segment in the flower flavours market, followed by the pharmaceutical and cosmetic industries. The substantial growth of the food and beverage segment is propelled by the increasing use of flower flavours in a diverse range of products, including beverages, confectionery, bakery items, and dairy products.
Flower Flavours Product Developments
Recent innovations in flower flavour technology focus on enhancing the stability, intensity, and authenticity of floral notes. Supercritical fluid extraction, enzymatic modification, and encapsulation technologies are enhancing product quality and shelf life. New flavour profiles, including combinations of floral notes with other natural ingredients, are emerging, broadening applications across diverse food and beverage categories. These innovations enhance the sensory experience and provide unique flavour profiles to meet evolving consumer preferences.
Key Drivers of Flower Flavours Growth
Several factors are driving the growth of the flower flavours market. Technological advancements in extraction and processing technologies are improving efficiency and quality. Economic growth in developing economies increases consumer spending on food and beverage products. Supportive government regulations promoting the use of natural ingredients and the development of the food and beverage sector further contribute to market expansion.
Challenges in the Flower Flavours Market
The flower flavours market faces challenges including the high cost of raw materials, particularly for rare or exotic flowers. Supply chain complexities, including the seasonality of flower harvesting and geographical limitations, impact production consistency. Intense competition among established players and emerging entrants increases pressure on pricing and profitability, particularly affecting small and medium enterprises. These factors necessitate efficient sourcing, processing, and inventory management strategies to mitigate production costs and ensure market competitiveness.
Emerging Opportunities in Flower Flavours
The flower flavours market presents several growth opportunities. Strategic partnerships among flavour manufacturers, ingredient suppliers, and food and beverage companies can enable efficient supply chains and product innovation. Technological breakthroughs in extraction and formulation techniques can create high-quality and cost-effective solutions. Expansion into new markets, particularly in developing economies with rising consumer demand, offers vast potential for growth.
Leading Players in the Flower Flavours Sector
Key Milestones in Flower Flavours Industry
- 2020: IFF launches a new range of sustainably sourced flower extracts.
- 2021: Firmenich patents a novel flower flavour extraction technique.
- 2022: BASF and a key ingredient supplier form a strategic partnership.
- 2023: Synergy Flavours introduces a new line of flower-infused beverages.
- 2024: Acquisition of a smaller flower flavour company by a major player. (XX company acquired by XX company)
Strategic Outlook for Flower Flavours Market
The flower flavours market is poised for significant growth, driven by the ongoing demand for natural and authentic food and beverage products. Strategic partnerships, technological advancements, and expansion into new markets will be key factors in shaping the market's future. Companies that effectively address sustainability concerns and cater to evolving consumer preferences will be best positioned to capitalize on emerging opportunities. The market's trajectory indicates a promising future, offering substantial potential for both established players and new entrants.
Flower Flavours Segmentation
-
1. Application
- 1.1. Beverage Industry
- 1.2. Food Industry
-
2. Type
- 2.1. Chrysanthemum
- 2.2. Hibiscus
- 2.3. Jasmine
- 2.4. Cherry Blossom
- 2.5. Orange Flower
- 2.6. Rose
- 2.7. Other
Flower Flavours Segmentation By Geography
-
1. North America
- 1.1. United States
- 1.2. Canada
- 1.3. Mexico
-
2. South America
- 2.1. Brazil
- 2.2. Argentina
- 2.3. Rest of South America
-
3. Europe
- 3.1. United Kingdom
- 3.2. Germany
- 3.3. France
- 3.4. Italy
- 3.5. Spain
- 3.6. Russia
- 3.7. Benelux
- 3.8. Nordics
- 3.9. Rest of Europe
-
4. Middle East & Africa
- 4.1. Turkey
- 4.2. Israel
- 4.3. GCC
- 4.4. North Africa
- 4.5. South Africa
- 4.6. Rest of Middle East & Africa
-
5. Asia Pacific
- 5.1. China
- 5.2. India
- 5.3. Japan
- 5.4. South Korea
- 5.5. ASEAN
- 5.6. Oceania
- 5.7. Rest of Asia Pacific

Flower Flavours Regional Market Share
Geographic Coverage of Flower Flavours
Flower Flavours REPORT HIGHLIGHTS
| Aspects | Details |
|---|---|
| Study Period | 2020-2034 |
| Base Year | 2025 |
| Estimated Year | 2026 |
| Forecast Period | 2026-2034 |
| Historical Period | 2020-2025 |
| Growth Rate | CAGR of 5.5% from 2020-2034 |
| Segmentation |
|
Table of Contents
- 1. Introduction
- 1.1. Research Scope
- 1.2. Market Segmentation
- 1.3. Research Objective
- 1.4. Definitions and Assumptions
- 2. Executive Summary
- 2.1. Market Snapshot
- 3. Market Dynamics
- 3.1. Market Drivers
- 3.2. Market Restrains
- 3.3. Market Trends
- 3.4. Market Opportunities
- 4. Market Factor Analysis
- 4.1. Porters Five Forces
- 4.1.1. Bargaining Power of Suppliers
- 4.1.2. Bargaining Power of Buyers
- 4.1.3. Threat of New Entrants
- 4.1.4. Threat of Substitutes
- 4.1.5. Competitive Rivalry
- 4.2. PESTEL analysis
- 4.3. BCG Analysis
- 4.3.1. Stars (High Growth, High Market Share)
- 4.3.2. Cash Cows (Low Growth, High Market Share)
- 4.3.3. Question Mark (High Growth, Low Market Share)
- 4.3.4. Dogs (Low Growth, Low Market Share)
- 4.4. Ansoff Matrix Analysis
- 4.5. Supply Chain Analysis
- 4.6. Regulatory Landscape
- 4.7. Current Market Potential and Opportunity Assessment (TAM–SAM–SOM Framework)
- 4.8. MDP Analyst Note
- 4.1. Porters Five Forces
- 5. Market Analysis, Insights and Forecast 2021-2033
- 5.1. Market Analysis, Insights and Forecast - by Application
- 5.1.1. Beverage Industry
- 5.1.2. Food Industry
- 5.2. Market Analysis, Insights and Forecast - by Type
- 5.2.1. Chrysanthemum
- 5.2.2. Hibiscus
- 5.2.3. Jasmine
- 5.2.4. Cherry Blossom
- 5.2.5. Orange Flower
- 5.2.6. Rose
- 5.2.7. Other
- 5.3. Market Analysis, Insights and Forecast - by Region
- 5.3.1. North America
- 5.3.2. South America
- 5.3.3. Europe
- 5.3.4. Middle East & Africa
- 5.3.5. Asia Pacific
- 5.1. Market Analysis, Insights and Forecast - by Application
- 6. Global Flower Flavours Analysis, Insights and Forecast, 2021-2033
- 6.1. Market Analysis, Insights and Forecast - by Application
- 6.1.1. Beverage Industry
- 6.1.2. Food Industry
- 6.2. Market Analysis, Insights and Forecast - by Type
- 6.2.1. Chrysanthemum
- 6.2.2. Hibiscus
- 6.2.3. Jasmine
- 6.2.4. Cherry Blossom
- 6.2.5. Orange Flower
- 6.2.6. Rose
- 6.2.7. Other
- 6.1. Market Analysis, Insights and Forecast - by Application
- 7. North America Flower Flavours Analysis, Insights and Forecast, 2020-2032
- 7.1. Market Analysis, Insights and Forecast - by Application
- 7.1.1. Beverage Industry
- 7.1.2. Food Industry
- 7.2. Market Analysis, Insights and Forecast - by Type
- 7.2.1. Chrysanthemum
- 7.2.2. Hibiscus
- 7.2.3. Jasmine
- 7.2.4. Cherry Blossom
- 7.2.5. Orange Flower
- 7.2.6. Rose
- 7.2.7. Other
- 7.1. Market Analysis, Insights and Forecast - by Application
- 8. South America Flower Flavours Analysis, Insights and Forecast, 2020-2032
- 8.1. Market Analysis, Insights and Forecast - by Application
- 8.1.1. Beverage Industry
- 8.1.2. Food Industry
- 8.2. Market Analysis, Insights and Forecast - by Type
- 8.2.1. Chrysanthemum
- 8.2.2. Hibiscus
- 8.2.3. Jasmine
- 8.2.4. Cherry Blossom
- 8.2.5. Orange Flower
- 8.2.6. Rose
- 8.2.7. Other
- 8.1. Market Analysis, Insights and Forecast - by Application
- 9. Europe Flower Flavours Analysis, Insights and Forecast, 2020-2032
- 9.1. Market Analysis, Insights and Forecast - by Application
- 9.1.1. Beverage Industry
- 9.1.2. Food Industry
- 9.2. Market Analysis, Insights and Forecast - by Type
- 9.2.1. Chrysanthemum
- 9.2.2. Hibiscus
- 9.2.3. Jasmine
- 9.2.4. Cherry Blossom
- 9.2.5. Orange Flower
- 9.2.6. Rose
- 9.2.7. Other
- 9.1. Market Analysis, Insights and Forecast - by Application
- 10. Middle East & Africa Flower Flavours Analysis, Insights and Forecast, 2020-2032
- 10.1. Market Analysis, Insights and Forecast - by Application
- 10.1.1. Beverage Industry
- 10.1.2. Food Industry
- 10.2. Market Analysis, Insights and Forecast - by Type
- 10.2.1. Chrysanthemum
- 10.2.2. Hibiscus
- 10.2.3. Jasmine
- 10.2.4. Cherry Blossom
- 10.2.5. Orange Flower
- 10.2.6. Rose
- 10.2.7. Other
- 10.1. Market Analysis, Insights and Forecast - by Application
- 11. Asia Pacific Flower Flavours Analysis, Insights and Forecast, 2020-2032
- 11.1. Market Analysis, Insights and Forecast - by Application
- 11.1.1. Beverage Industry
- 11.1.2. Food Industry
- 11.2. Market Analysis, Insights and Forecast - by Type
- 11.2.1. Chrysanthemum
- 11.2.2. Hibiscus
- 11.2.3. Jasmine
- 11.2.4. Cherry Blossom
- 11.2.5. Orange Flower
- 11.2.6. Rose
- 11.2.7. Other
- 11.1. Market Analysis, Insights and Forecast - by Application
- 12. Competitive Analysis
- 12.1. Company Profiles
- 12.1.1 BASF SE
- 12.1.1.1. Company Overview
- 12.1.1.2. Products
- 12.1.1.3. Company Financials
- 12.1.1.4. SWOT Analysis
- 12.1.2 Firmenich SA
- 12.1.2.1. Company Overview
- 12.1.2.2. Products
- 12.1.2.3. Company Financials
- 12.1.2.4. SWOT Analysis
- 12.1.3 Carbery Group (Synergy Flavours)
- 12.1.3.1. Company Overview
- 12.1.3.2. Products
- 12.1.3.3. Company Financials
- 12.1.3.4. SWOT Analysis
- 12.1.4 Sensient Technologies Corporation
- 12.1.4.1. Company Overview
- 12.1.4.2. Products
- 12.1.4.3. Company Financials
- 12.1.4.4. SWOT Analysis
- 12.1.5 International Flavors & Fragrances Inc. (IFF)
- 12.1.5.1. Company Overview
- 12.1.5.2. Products
- 12.1.5.3. Company Financials
- 12.1.5.4. SWOT Analysis
- 12.1.6 Abelei Inc.
- 12.1.6.1. Company Overview
- 12.1.6.2. Products
- 12.1.6.3. Company Financials
- 12.1.6.4. SWOT Analysis
- 12.1.7 Mane SA
- 12.1.7.1. Company Overview
- 12.1.7.2. Products
- 12.1.7.3. Company Financials
- 12.1.7.4. SWOT Analysis
- 12.1.8 Teawolf Inc.
- 12.1.8.1. Company Overview
- 12.1.8.2. Products
- 12.1.8.3. Company Financials
- 12.1.8.4. SWOT Analysis
- 12.1.9 Frutarom Industries Ltd.
- 12.1.9.1. Company Overview
- 12.1.9.2. Products
- 12.1.9.3. Company Financials
- 12.1.9.4. SWOT Analysis
- 12.1.10 Döhler GmbH
- 12.1.10.1. Company Overview
- 12.1.10.2. Products
- 12.1.10.3. Company Financials
- 12.1.10.4. SWOT Analysis
- 12.1.1 BASF SE
- 12.2. Market Entropy
- 12.2.1 Company's Key Areas Served
- 12.2.2 Recent Developments
- 12.3. Company Market Share Analysis 2025
- 12.3.1 Top 5 Companies Market Share Analysis
- 12.3.2 Top 3 Companies Market Share Analysis
- 12.4. List of Potential Customers
- 13. Research Methodology
List of Figures
- Figure 1: Global Flower Flavours Revenue Breakdown (million, %) by Region 2025 & 2033
- Figure 2: North America Flower Flavours Revenue (million), by Application 2025 & 2033
- Figure 3: North America Flower Flavours Revenue Share (%), by Application 2025 & 2033
- Figure 4: North America Flower Flavours Revenue (million), by Type 2025 & 2033
- Figure 5: North America Flower Flavours Revenue Share (%), by Type 2025 & 2033
- Figure 6: North America Flower Flavours Revenue (million), by Country 2025 & 2033
- Figure 7: North America Flower Flavours Revenue Share (%), by Country 2025 & 2033
- Figure 8: South America Flower Flavours Revenue (million), by Application 2025 & 2033
- Figure 9: South America Flower Flavours Revenue Share (%), by Application 2025 & 2033
- Figure 10: South America Flower Flavours Revenue (million), by Type 2025 & 2033
- Figure 11: South America Flower Flavours Revenue Share (%), by Type 2025 & 2033
- Figure 12: South America Flower Flavours Revenue (million), by Country 2025 & 2033
- Figure 13: South America Flower Flavours Revenue Share (%), by Country 2025 & 2033
- Figure 14: Europe Flower Flavours Revenue (million), by Application 2025 & 2033
- Figure 15: Europe Flower Flavours Revenue Share (%), by Application 2025 & 2033
- Figure 16: Europe Flower Flavours Revenue (million), by Type 2025 & 2033
- Figure 17: Europe Flower Flavours Revenue Share (%), by Type 2025 & 2033
- Figure 18: Europe Flower Flavours Revenue (million), by Country 2025 & 2033
- Figure 19: Europe Flower Flavours Revenue Share (%), by Country 2025 & 2033
- Figure 20: Middle East & Africa Flower Flavours Revenue (million), by Application 2025 & 2033
- Figure 21: Middle East & Africa Flower Flavours Revenue Share (%), by Application 2025 & 2033
- Figure 22: Middle East & Africa Flower Flavours Revenue (million), by Type 2025 & 2033
- Figure 23: Middle East & Africa Flower Flavours Revenue Share (%), by Type 2025 & 2033
- Figure 24: Middle East & Africa Flower Flavours Revenue (million), by Country 2025 & 2033
- Figure 25: Middle East & Africa Flower Flavours Revenue Share (%), by Country 2025 & 2033
- Figure 26: Asia Pacific Flower Flavours Revenue (million), by Application 2025 & 2033
- Figure 27: Asia Pacific Flower Flavours Revenue Share (%), by Application 2025 & 2033
- Figure 28: Asia Pacific Flower Flavours Revenue (million), by Type 2025 & 2033
- Figure 29: Asia Pacific Flower Flavours Revenue Share (%), by Type 2025 & 2033
- Figure 30: Asia Pacific Flower Flavours Revenue (million), by Country 2025 & 2033
- Figure 31: Asia Pacific Flower Flavours Revenue Share (%), by Country 2025 & 2033
List of Tables
- Table 1: Global Flower Flavours Revenue million Forecast, by Application 2020 & 2033
- Table 2: Global Flower Flavours Revenue million Forecast, by Type 2020 & 2033
- Table 3: Global Flower Flavours Revenue million Forecast, by Region 2020 & 2033
- Table 4: Global Flower Flavours Revenue million Forecast, by Application 2020 & 2033
- Table 5: Global Flower Flavours Revenue million Forecast, by Type 2020 & 2033
- Table 6: Global Flower Flavours Revenue million Forecast, by Country 2020 & 2033
- Table 7: United States Flower Flavours Revenue (million) Forecast, by Application 2020 & 2033
- Table 8: Canada Flower Flavours Revenue (million) Forecast, by Application 2020 & 2033
- Table 9: Mexico Flower Flavours Revenue (million) Forecast, by Application 2020 & 2033
- Table 10: Global Flower Flavours Revenue million Forecast, by Application 2020 & 2033
- Table 11: Global Flower Flavours Revenue million Forecast, by Type 2020 & 2033
- Table 12: Global Flower Flavours Revenue million Forecast, by Country 2020 & 2033
- Table 13: Brazil Flower Flavours Revenue (million) Forecast, by Application 2020 & 2033
- Table 14: Argentina Flower Flavours Revenue (million) Forecast, by Application 2020 & 2033
- Table 15: Rest of South America Flower Flavours Revenue (million) Forecast, by Application 2020 & 2033
- Table 16: Global Flower Flavours Revenue million Forecast, by Application 2020 & 2033
- Table 17: Global Flower Flavours Revenue million Forecast, by Type 2020 & 2033
- Table 18: Global Flower Flavours Revenue million Forecast, by Country 2020 & 2033
- Table 19: United Kingdom Flower Flavours Revenue (million) Forecast, by Application 2020 & 2033
- Table 20: Germany Flower Flavours Revenue (million) Forecast, by Application 2020 & 2033
- Table 21: France Flower Flavours Revenue (million) Forecast, by Application 2020 & 2033
- Table 22: Italy Flower Flavours Revenue (million) Forecast, by Application 2020 & 2033
- Table 23: Spain Flower Flavours Revenue (million) Forecast, by Application 2020 & 2033
- Table 24: Russia Flower Flavours Revenue (million) Forecast, by Application 2020 & 2033
- Table 25: Benelux Flower Flavours Revenue (million) Forecast, by Application 2020 & 2033
- Table 26: Nordics Flower Flavours Revenue (million) Forecast, by Application 2020 & 2033
- Table 27: Rest of Europe Flower Flavours Revenue (million) Forecast, by Application 2020 & 2033
- Table 28: Global Flower Flavours Revenue million Forecast, by Application 2020 & 2033
- Table 29: Global Flower Flavours Revenue million Forecast, by Type 2020 & 2033
- Table 30: Global Flower Flavours Revenue million Forecast, by Country 2020 & 2033
- Table 31: Turkey Flower Flavours Revenue (million) Forecast, by Application 2020 & 2033
- Table 32: Israel Flower Flavours Revenue (million) Forecast, by Application 2020 & 2033
- Table 33: GCC Flower Flavours Revenue (million) Forecast, by Application 2020 & 2033
- Table 34: North Africa Flower Flavours Revenue (million) Forecast, by Application 2020 & 2033
- Table 35: South Africa Flower Flavours Revenue (million) Forecast, by Application 2020 & 2033
- Table 36: Rest of Middle East & Africa Flower Flavours Revenue (million) Forecast, by Application 2020 & 2033
- Table 37: Global Flower Flavours Revenue million Forecast, by Application 2020 & 2033
- Table 38: Global Flower Flavours Revenue million Forecast, by Type 2020 & 2033
- Table 39: Global Flower Flavours Revenue million Forecast, by Country 2020 & 2033
- Table 40: China Flower Flavours Revenue (million) Forecast, by Application 2020 & 2033
- Table 41: India Flower Flavours Revenue (million) Forecast, by Application 2020 & 2033
- Table 42: Japan Flower Flavours Revenue (million) Forecast, by Application 2020 & 2033
- Table 43: South Korea Flower Flavours Revenue (million) Forecast, by Application 2020 & 2033
- Table 44: ASEAN Flower Flavours Revenue (million) Forecast, by Application 2020 & 2033
- Table 45: Oceania Flower Flavours Revenue (million) Forecast, by Application 2020 & 2033
- Table 46: Rest of Asia Pacific Flower Flavours Revenue (million) Forecast, by Application 2020 & 2033
Frequently Asked Questions
1. What is the projected Compound Annual Growth Rate (CAGR) of the Flower Flavours?
The projected CAGR is approximately 5.5%.
2. Which companies are prominent players in the Flower Flavours?
Key companies in the market include BASF SE, Firmenich SA, Carbery Group (Synergy Flavours), Sensient Technologies Corporation, International Flavors & Fragrances Inc. (IFF), Abelei Inc., Mane SA, Teawolf Inc., Frutarom Industries Ltd., Döhler GmbH.
3. What are the main segments of the Flower Flavours?
The market segments include Application, Type.
4. Can you provide details about the market size?
The market size is estimated to be USD 3104 million as of 2022.
5. What are some drivers contributing to market growth?
N/A
6. What are the notable trends driving market growth?
N/A
7. Are there any restraints impacting market growth?
N/A
8. Can you provide examples of recent developments in the market?
N/A
9. What pricing options are available for accessing the report?
Pricing options include single-user, multi-user, and enterprise licenses priced at USD 2900.00, USD 4350.00, and USD 5800.00 respectively.
10. Is the market size provided in terms of value or volume?
The market size is provided in terms of value, measured in million.
11. Are there any specific market keywords associated with the report?
Yes, the market keyword associated with the report is "Flower Flavours," which aids in identifying and referencing the specific market segment covered.
12. How do I determine which pricing option suits my needs best?
The pricing options vary based on user requirements and access needs. Individual users may opt for single-user licenses, while businesses requiring broader access may choose multi-user or enterprise licenses for cost-effective access to the report.
13. Are there any additional resources or data provided in the Flower Flavours report?
While the report offers comprehensive insights, it's advisable to review the specific contents or supplementary materials provided to ascertain if additional resources or data are available.
14. How can I stay updated on further developments or reports in the Flower Flavours?
To stay informed about further developments, trends, and reports in the Flower Flavours, consider subscribing to industry newsletters, following relevant companies and organizations, or regularly checking reputable industry news sources and publications.
Methodology
Step 1 - Identification of Relevant Samples Size from Population Database


Step 2 - Approaches for Defining Global Market Size (Value, Volume* & Price*)

Note*: In applicable scenarios
Step 3 - Data Sources
Primary Research
- Web Analytics
- Survey Reports
- Research Institute
- Latest Research Reports
- Opinion Leaders
Secondary Research
- Annual Reports
- White Paper
- Latest Press Release
- Industry Association
- Paid Database
- Investor Presentations

Step 4 - Data Triangulation
Involves using different sources of information in order to increase the validity of a study
These sources are likely to be stakeholders in a program - participants, other researchers, program staff, other community members, and so on.
Then we put all data in single framework & apply various statistical tools to find out the dynamic on the market.
During the analysis stage, feedback from the stakeholder groups would be compared to determine areas of agreement as well as areas of divergence