

Key Insights
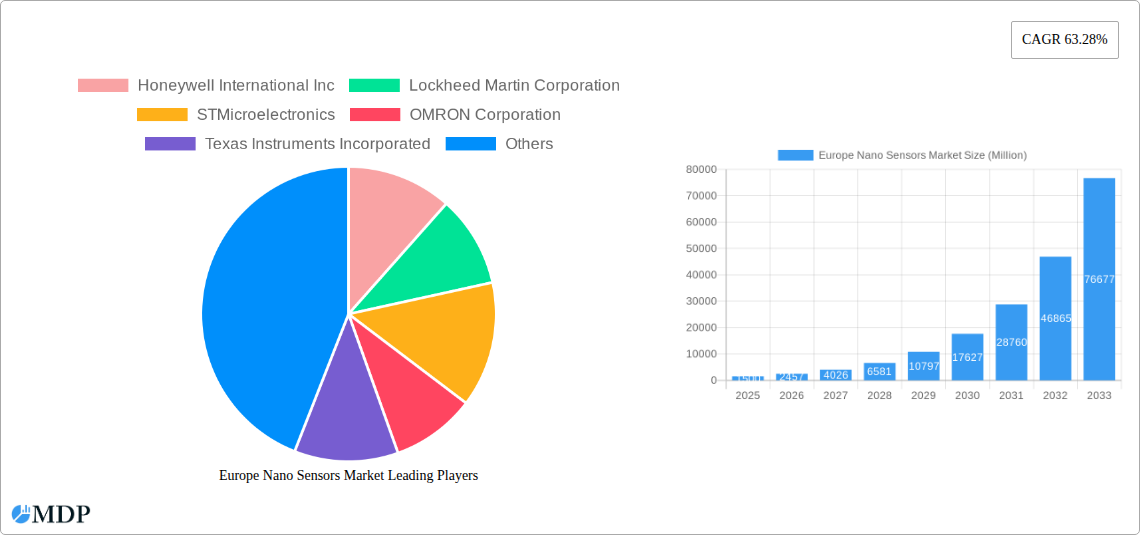
The European nano sensors market is experiencing robust growth, driven by increasing demand across diverse sectors. The market's Compound Annual Growth Rate (CAGR) of 63.28% from 2019 to 2024 indicates significant expansion. This surge is primarily fueled by the increasing adoption of nano sensors in consumer electronics, particularly in miniaturized devices and wearables requiring high sensitivity and precision. The automotive industry's push for advanced driver-assistance systems (ADAS) and autonomous vehicles is another key driver, as nano sensors enable improved safety features and performance monitoring. Furthermore, the healthcare sector's adoption of nano sensors for diagnostics, drug delivery, and therapeutic applications is contributing substantially to market growth. The growing need for efficient and reliable power generation, coupled with advancements in aerospace and defense technologies requiring high-performance sensors, further boosts the market. Within Europe, Germany, France, and the UK are leading adopters, driven by strong technological capabilities and investments in research and development. The market segmentation reveals a strong preference for optical and electrochemical sensors due to their versatility and suitability for various applications.
However, despite the significant growth, certain restraints impact market expansion. High initial investment costs associated with research, development, and manufacturing of nano sensors can act as a barrier to entry for smaller players. Furthermore, the technical complexities involved in the manufacturing process and the need for highly skilled personnel can pose challenges. Addressing these challenges through focused R&D investments, streamlined manufacturing processes, and skill development programs is crucial to unlock the full potential of the European nano sensors market. The ongoing evolution of sensor technology, including the development of more sensitive, reliable, and cost-effective nano sensors, will continue to shape market dynamics and drive further growth during the forecast period (2025-2033). The projected continued high CAGR indicates strong future prospects for this innovative and rapidly expanding market.
Europe Nano Sensors Market: A Comprehensive Report (2019-2033)
Dive deep into the burgeoning Europe Nano Sensors Market with this in-depth analysis, projecting a robust growth trajectory through 2033. This comprehensive report provides a granular examination of market dynamics, industry trends, leading players, and future opportunities, equipping stakeholders with actionable insights for strategic decision-making. The report covers the period from 2019 to 2033, with 2025 serving as the base and estimated year. The forecast period spans 2025-2033, while the historical period encompasses 2019-2024. The total market size is predicted to reach xx Million by 2033.
Europe Nano Sensors Market Market Dynamics & Concentration
The Europe Nano Sensors Market is characterized by a moderately concentrated landscape, with key players like Honeywell International Inc, Lockheed Martin Corporation, STMicroelectronics, OMRON Corporation, Texas Instruments Incorporated, Agilent Technologies, Analog Devices Inc, Teledyne Technologies, and Samsung Electronics co Limited vying for market share. Market concentration is further shaped by several factors:
- Innovation Drivers: Continuous advancements in nanotechnology, particularly in materials science and sensor miniaturization, are driving market expansion. The development of highly sensitive and specific nanosensors is creating new application opportunities across various sectors.
- Regulatory Frameworks: Stringent environmental regulations and safety standards in Europe are influencing the adoption of nano sensors, especially in industries like automotive and healthcare. Compliance costs and certifications are impacting market dynamics.
- Product Substitutes: While nano sensors offer superior performance in several applications, traditional sensors remain competitive in certain niche markets, posing a degree of substitution risk. The pricing and performance trade-offs influence market penetration.
- End-User Trends: The growing demand for miniaturized, high-performance sensors across various end-user industries, including consumer electronics, automotive, and healthcare, fuels market growth. Smart device proliferation and the Internet of Things (IoT) are key drivers.
- M&A Activities: The market has witnessed a moderate level of mergers and acquisitions in recent years, with approximately xx M&A deals concluded between 2019 and 2024. These activities have resulted in increased market consolidation and enhanced technological capabilities for major players. Market share analysis shows that the top five players collectively hold approximately xx% of the market.
Europe Nano Sensors Market Industry Trends & Analysis
The Europe Nano Sensors Market exhibits robust growth, driven by a confluence of technological advancements, evolving consumer preferences, and heightened industrial demand. The market is expected to register a Compound Annual Growth Rate (CAGR) of xx% during the forecast period (2025-2033).
Technological disruptions, including the emergence of advanced nanomaterials and improved fabrication techniques, are significantly impacting market dynamics. The increasing adoption of smart devices and the Internet of Things (IoT) is expanding the applications of nano sensors, further boosting market penetration. Consumer preference for smaller, more efficient, and cost-effective devices is also a strong driver. Competitive dynamics are intense, with companies focusing on innovation, strategic partnerships, and efficient supply chain management to maintain a competitive edge. Market penetration in key sectors like automotive and healthcare is growing steadily, reflecting the expanding adoption of nano sensor technologies in various applications.
Leading Markets & Segments in Europe Nano Sensors Market
The German and UK markets currently dominate the European nano sensors landscape, driven by strong industrial bases and government support for technological advancements. The Automotive and Healthcare sectors are currently the leading end-user industries.
Key Drivers:
- Germany: Strong automotive sector, substantial R&D investments, favorable regulatory environment.
- UK: Significant investments in nanotechnology research, strong presence of technology companies, supportive government policies.
- Automotive: Demand for advanced driver-assistance systems (ADAS), vehicle safety features, and emission control technologies.
- Healthcare: Growing demand for point-of-care diagnostics, personalized medicine, and improved medical imaging.
Segment Dominance:
- Type: Electrochemical sensors currently hold the largest market share due to their wide applicability across various sectors. Optical sensors are experiencing significant growth, driven by advancements in optical sensing technologies.
- End-User Industry: The automotive and healthcare industries currently dominate the end-user landscape, driven by their substantial needs for advanced sensing solutions. However, the consumer electronics sector is witnessing rapid growth fueled by the widespread adoption of smart devices and the IoT.
Europe Nano Sensors Market Product Developments
Recent years have seen significant advancements in nano sensor technology, leading to the development of more sensitive, selective, and miniaturized sensors. New materials, fabrication techniques, and improved signal processing methods have enhanced sensor performance and reduced manufacturing costs. These advancements have expanded the applications of nano sensors to new areas such as environmental monitoring, food safety, and industrial process control, leading to a wider market adoption. The competitive advantage lies in superior sensitivity, selectivity, and integration capabilities.
Key Drivers of Europe Nano Sensors Market Growth
The Europe Nano Sensors Market is propelled by several key factors:
- Technological Advancements: Miniaturization of sensors, improved sensitivity and selectivity, and integration with other technologies (e.g., microelectronics) are driving market growth.
- Economic Factors: Increasing demand for sophisticated sensing solutions in various industries and supportive government policies and funding for R&D are driving market growth.
- Regulatory Factors: Stringent environmental regulations and safety standards are driving the adoption of nano sensors in applications such as pollution monitoring and food safety.
Challenges in the Europe Nano Sensors Market Market
Despite the significant growth potential, the Europe Nano Sensors Market faces some challenges:
- Regulatory Hurdles: Stringent regulations related to the use of nanomaterials can hinder market expansion. Navigating complex approval processes and compliance costs presents a significant challenge. This potentially delays product launches and increases development expenses, potentially impacting market penetration rates by xx%.
- Supply Chain Issues: The reliance on specialized materials and manufacturing processes can create supply chain vulnerabilities, potentially leading to production delays and increased costs. Disruptions in the supply chain could impact market growth by up to xx%.
- Competitive Pressures: The market is characterized by intense competition among established players and emerging startups, requiring continuous innovation and cost optimization to maintain competitiveness.
Emerging Opportunities in Europe Nano Sensors Market
Several opportunities exist for long-term growth in the Europe Nano Sensors Market:
The development of novel nanomaterials with enhanced sensing capabilities and the emergence of new applications in fields such as environmental monitoring, personalized medicine, and industrial process control offer significant growth potential. Strategic partnerships between sensor manufacturers and end-user industries can accelerate market expansion. Government initiatives promoting the adoption of nanotechnology can also further stimulate market growth.
Leading Players in the Europe Nano Sensors Market Sector
- Honeywell International Inc
- Lockheed Martin Corporation
- STMicroelectronics
- OMRON Corporation
- Texas Instruments Incorporated
- Agilent Technologies
- Analog Devices Inc
- Teledyne Technologies
- Samsung Electronics co Limited
Key Milestones in Europe Nano Sensors Market Industry
- September 2021: The EPSRC (Engineering and Physical Sciences Research Council) awarded GBP 853,000 to a University to create the Multiscale Metrology Suite (MMS) for Next-Generation Health Nanotechnologies. This funding signifies a major boost in research and development, which is expected to lead to advancements in the healthcare sector and influence the overall market.
Strategic Outlook for Europe Nano Sensors Market Market
The Europe Nano Sensors Market is poised for significant growth, driven by technological advancements, expanding applications, and supportive regulatory environments. Companies should focus on R&D investments, strategic partnerships, and expansion into new market segments to capitalize on the growth opportunities. A focus on sustainable and ethical sourcing of nanomaterials is crucial for long-term market success. The market's future potential is substantial, offering attractive returns for early adopters and innovative players.
Europe Nano Sensors Market Segmentation
-
1. Type
- 1.1. Optical Sensor
- 1.2. Electrochemical Sensor
- 1.3. Electromechanical Sensor
-
2. End-User Industry
- 2.1. Consumer Electronics
- 2.2. Power Generation
- 2.3. Automotive
- 2.4. Aerospace and Defense
- 2.5. Healthcare
- 2.6. Industrial
- 2.7. Other End-User Industries
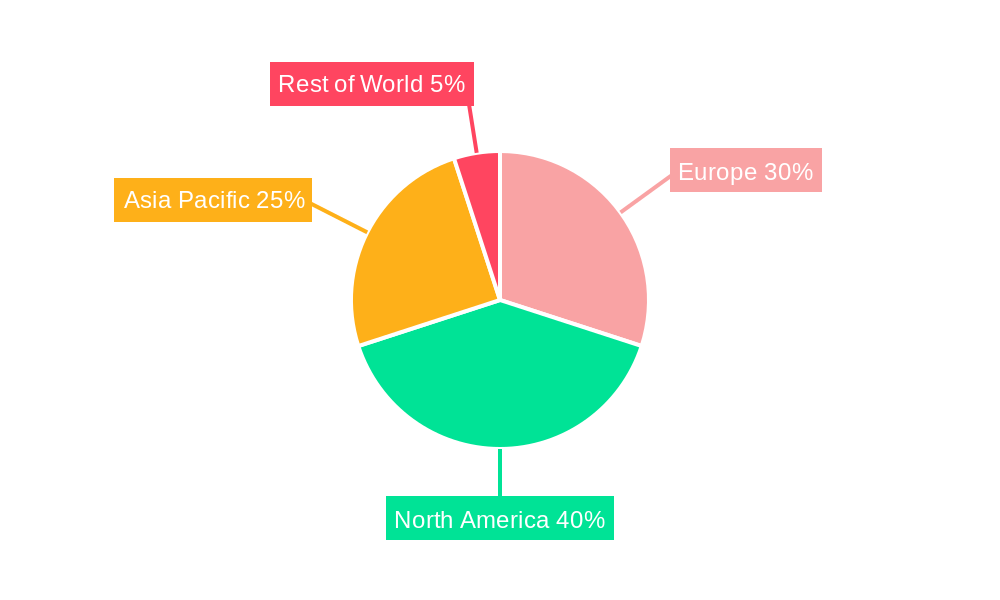
Europe Nano Sensors Market Segmentation By Geography
-
1. Europe
- 1.1. United Kingdom
- 1.2. Germany
- 1.3. France
- 1.4. Italy
- 1.5. Spain
- 1.6. Netherlands
- 1.7. Belgium
- 1.8. Sweden
- 1.9. Norway
- 1.10. Poland
- 1.11. Denmark
Europe Nano Sensors Market REPORT HIGHLIGHTS
| Aspects | Details |
|---|---|
| Study Period | 2019-2033 |
| Base Year | 2024 |
| Estimated Year | 2025 |
| Forecast Period | 2025-2033 |
| Historical Period | 2019-2024 |
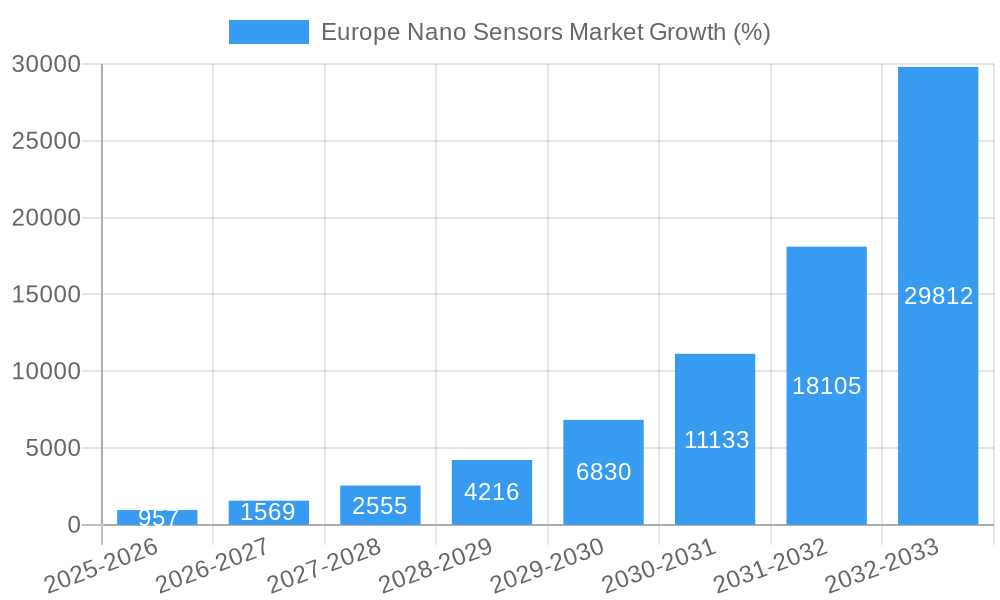
| Growth Rate | CAGR of 63.28% from 2019-2033 |
| Segmentation |
|
Table of Contents
- 1. Introduction
- 1.1. Research Scope
- 1.2. Market Segmentation
- 1.3. Research Methodology
- 1.4. Definitions and Assumptions
- 2. Executive Summary
- 2.1. Introduction
- 3. Market Dynamics
- 3.1. Introduction
- 3.2. Market Drivers
- 3.2.1. Growing adoption of technology in healthcare industry; Increasing research and development in innovative materials
- 3.3. Market Restrains
- 3.3.1. Complexity in Manufacturing Nanosensors
- 3.4. Market Trends
- 3.4.1. Electrochemical biological nano sensors and photometric biological nano sensors find significant demand
- 4. Market Factor Analysis
- 4.1. Porters Five Forces
- 4.2. Supply/Value Chain
- 4.3. PESTEL analysis
- 4.4. Market Entropy
- 4.5. Patent/Trademark Analysis
- 5. Europe Nano Sensors Market Analysis, Insights and Forecast, 2019-2031
- 5.1. Market Analysis, Insights and Forecast - by Type
- 5.1.1. Optical Sensor
- 5.1.2. Electrochemical Sensor
- 5.1.3. Electromechanical Sensor
- 5.2. Market Analysis, Insights and Forecast - by End-User Industry
- 5.2.1. Consumer Electronics
- 5.2.2. Power Generation
- 5.2.3. Automotive
- 5.2.4. Aerospace and Defense
- 5.2.5. Healthcare
- 5.2.6. Industrial
- 5.2.7. Other End-User Industries
- 5.3. Market Analysis, Insights and Forecast - by Region
- 5.3.1. Europe
- 5.1. Market Analysis, Insights and Forecast - by Type
- 6. Germany Europe Nano Sensors Market Analysis, Insights and Forecast, 2019-2031
- 7. France Europe Nano Sensors Market Analysis, Insights and Forecast, 2019-2031
- 8. Italy Europe Nano Sensors Market Analysis, Insights and Forecast, 2019-2031
- 9. United Kingdom Europe Nano Sensors Market Analysis, Insights and Forecast, 2019-2031
- 10. Netherlands Europe Nano Sensors Market Analysis, Insights and Forecast, 2019-2031
- 11. Sweden Europe Nano Sensors Market Analysis, Insights and Forecast, 2019-2031
- 12. Rest of Europe Europe Nano Sensors Market Analysis, Insights and Forecast, 2019-2031
- 13. Competitive Analysis
- 13.1. Market Share Analysis 2024
- 13.2. Company Profiles
- 13.2.1 Honeywell International Inc
- 13.2.1.1. Overview
- 13.2.1.2. Products
- 13.2.1.3. SWOT Analysis
- 13.2.1.4. Recent Developments
- 13.2.1.5. Financials (Based on Availability)
- 13.2.2 Lockheed Martin Corporation
- 13.2.2.1. Overview
- 13.2.2.2. Products
- 13.2.2.3. SWOT Analysis
- 13.2.2.4. Recent Developments
- 13.2.2.5. Financials (Based on Availability)
- 13.2.3 STMicroelectronics
- 13.2.3.1. Overview
- 13.2.3.2. Products
- 13.2.3.3. SWOT Analysis
- 13.2.3.4. Recent Developments
- 13.2.3.5. Financials (Based on Availability)
- 13.2.4 OMRON Corporation
- 13.2.4.1. Overview
- 13.2.4.2. Products
- 13.2.4.3. SWOT Analysis
- 13.2.4.4. Recent Developments
- 13.2.4.5. Financials (Based on Availability)
- 13.2.5 Texas Instruments Incorporated
- 13.2.5.1. Overview
- 13.2.5.2. Products
- 13.2.5.3. SWOT Analysis
- 13.2.5.4. Recent Developments
- 13.2.5.5. Financials (Based on Availability)
- 13.2.6 Agilent Technologies
- 13.2.6.1. Overview
- 13.2.6.2. Products
- 13.2.6.3. SWOT Analysis
- 13.2.6.4. Recent Developments
- 13.2.6.5. Financials (Based on Availability)
- 13.2.7 Analog Devices Inc
- 13.2.7.1. Overview
- 13.2.7.2. Products
- 13.2.7.3. SWOT Analysis
- 13.2.7.4. Recent Developments
- 13.2.7.5. Financials (Based on Availability)
- 13.2.8 Teledyne Technologies
- 13.2.8.1. Overview
- 13.2.8.2. Products
- 13.2.8.3. SWOT Analysis
- 13.2.8.4. Recent Developments
- 13.2.8.5. Financials (Based on Availability)
- 13.2.9 Samsung Electronics co Limited
- 13.2.9.1. Overview
- 13.2.9.2. Products
- 13.2.9.3. SWOT Analysis
- 13.2.9.4. Recent Developments
- 13.2.9.5. Financials (Based on Availability)
- 13.2.1 Honeywell International Inc
List of Figures
- Figure 1: Europe Nano Sensors Market Revenue Breakdown (Million, %) by Product 2024 & 2032
- Figure 2: Europe Nano Sensors Market Share (%) by Company 2024
List of Tables
- Table 1: Europe Nano Sensors Market Revenue Million Forecast, by Region 2019 & 2032
- Table 2: Europe Nano Sensors Market Volume cubic micrometers Forecast, by Region 2019 & 2032
- Table 3: Europe Nano Sensors Market Revenue Million Forecast, by Type 2019 & 2032
- Table 4: Europe Nano Sensors Market Volume cubic micrometers Forecast, by Type 2019 & 2032
- Table 5: Europe Nano Sensors Market Revenue Million Forecast, by End-User Industry 2019 & 2032
- Table 6: Europe Nano Sensors Market Volume cubic micrometers Forecast, by End-User Industry 2019 & 2032
- Table 7: Europe Nano Sensors Market Revenue Million Forecast, by Region 2019 & 2032
- Table 8: Europe Nano Sensors Market Volume cubic micrometers Forecast, by Region 2019 & 2032
- Table 9: Europe Nano Sensors Market Revenue Million Forecast, by Country 2019 & 2032
- Table 10: Europe Nano Sensors Market Volume cubic micrometers Forecast, by Country 2019 & 2032
- Table 11: Germany Europe Nano Sensors Market Revenue (Million) Forecast, by Application 2019 & 2032
- Table 12: Germany Europe Nano Sensors Market Volume (cubic micrometers) Forecast, by Application 2019 & 2032
- Table 13: France Europe Nano Sensors Market Revenue (Million) Forecast, by Application 2019 & 2032
- Table 14: France Europe Nano Sensors Market Volume (cubic micrometers) Forecast, by Application 2019 & 2032
- Table 15: Italy Europe Nano Sensors Market Revenue (Million) Forecast, by Application 2019 & 2032
- Table 16: Italy Europe Nano Sensors Market Volume (cubic micrometers) Forecast, by Application 2019 & 2032
- Table 17: United Kingdom Europe Nano Sensors Market Revenue (Million) Forecast, by Application 2019 & 2032
- Table 18: United Kingdom Europe Nano Sensors Market Volume (cubic micrometers) Forecast, by Application 2019 & 2032
- Table 19: Netherlands Europe Nano Sensors Market Revenue (Million) Forecast, by Application 2019 & 2032
- Table 20: Netherlands Europe Nano Sensors Market Volume (cubic micrometers) Forecast, by Application 2019 & 2032
- Table 21: Sweden Europe Nano Sensors Market Revenue (Million) Forecast, by Application 2019 & 2032
- Table 22: Sweden Europe Nano Sensors Market Volume (cubic micrometers) Forecast, by Application 2019 & 2032
- Table 23: Rest of Europe Europe Nano Sensors Market Revenue (Million) Forecast, by Application 2019 & 2032
- Table 24: Rest of Europe Europe Nano Sensors Market Volume (cubic micrometers) Forecast, by Application 2019 & 2032
- Table 25: Europe Nano Sensors Market Revenue Million Forecast, by Type 2019 & 2032
- Table 26: Europe Nano Sensors Market Volume cubic micrometers Forecast, by Type 2019 & 2032
- Table 27: Europe Nano Sensors Market Revenue Million Forecast, by End-User Industry 2019 & 2032
- Table 28: Europe Nano Sensors Market Volume cubic micrometers Forecast, by End-User Industry 2019 & 2032
- Table 29: Europe Nano Sensors Market Revenue Million Forecast, by Country 2019 & 2032
- Table 30: Europe Nano Sensors Market Volume cubic micrometers Forecast, by Country 2019 & 2032
- Table 31: United Kingdom Europe Nano Sensors Market Revenue (Million) Forecast, by Application 2019 & 2032
- Table 32: United Kingdom Europe Nano Sensors Market Volume (cubic micrometers) Forecast, by Application 2019 & 2032
- Table 33: Germany Europe Nano Sensors Market Revenue (Million) Forecast, by Application 2019 & 2032
- Table 34: Germany Europe Nano Sensors Market Volume (cubic micrometers) Forecast, by Application 2019 & 2032
- Table 35: France Europe Nano Sensors Market Revenue (Million) Forecast, by Application 2019 & 2032
- Table 36: France Europe Nano Sensors Market Volume (cubic micrometers) Forecast, by Application 2019 & 2032
- Table 37: Italy Europe Nano Sensors Market Revenue (Million) Forecast, by Application 2019 & 2032
- Table 38: Italy Europe Nano Sensors Market Volume (cubic micrometers) Forecast, by Application 2019 & 2032
- Table 39: Spain Europe Nano Sensors Market Revenue (Million) Forecast, by Application 2019 & 2032
- Table 40: Spain Europe Nano Sensors Market Volume (cubic micrometers) Forecast, by Application 2019 & 2032
- Table 41: Netherlands Europe Nano Sensors Market Revenue (Million) Forecast, by Application 2019 & 2032
- Table 42: Netherlands Europe Nano Sensors Market Volume (cubic micrometers) Forecast, by Application 2019 & 2032
- Table 43: Belgium Europe Nano Sensors Market Revenue (Million) Forecast, by Application 2019 & 2032
- Table 44: Belgium Europe Nano Sensors Market Volume (cubic micrometers) Forecast, by Application 2019 & 2032
- Table 45: Sweden Europe Nano Sensors Market Revenue (Million) Forecast, by Application 2019 & 2032
- Table 46: Sweden Europe Nano Sensors Market Volume (cubic micrometers) Forecast, by Application 2019 & 2032
- Table 47: Norway Europe Nano Sensors Market Revenue (Million) Forecast, by Application 2019 & 2032
- Table 48: Norway Europe Nano Sensors Market Volume (cubic micrometers) Forecast, by Application 2019 & 2032
- Table 49: Poland Europe Nano Sensors Market Revenue (Million) Forecast, by Application 2019 & 2032
- Table 50: Poland Europe Nano Sensors Market Volume (cubic micrometers) Forecast, by Application 2019 & 2032
- Table 51: Denmark Europe Nano Sensors Market Revenue (Million) Forecast, by Application 2019 & 2032
- Table 52: Denmark Europe Nano Sensors Market Volume (cubic micrometers) Forecast, by Application 2019 & 2032
Frequently Asked Questions
1. What is the projected Compound Annual Growth Rate (CAGR) of the Europe Nano Sensors Market?
The projected CAGR is approximately 63.28%.
2. Which companies are prominent players in the Europe Nano Sensors Market?
Key companies in the market include Honeywell International Inc, Lockheed Martin Corporation, STMicroelectronics, OMRON Corporation, Texas Instruments Incorporated, Agilent Technologies, Analog Devices Inc, Teledyne Technologies, Samsung Electronics co Limited.
3. What are the main segments of the Europe Nano Sensors Market?
The market segments include Type, End-User Industry.
4. Can you provide details about the market size?
The market size is estimated to be USD XX Million as of 2022.
5. What are some drivers contributing to market growth?
Growing adoption of technology in healthcare industry; Increasing research and development in innovative materials.
6. What are the notable trends driving market growth?
Electrochemical biological nano sensors and photometric biological nano sensors find significant demand.
7. Are there any restraints impacting market growth?
Complexity in Manufacturing Nanosensors.
8. Can you provide examples of recent developments in the market?
September 2021 - The EPSRC (Engineering and Physical Sciences Research Council) has awarded GBP 853,000 to the University to create the Multiscale Metrology Suite (MMS) for Next-Generation Health Nanotechnologies.
9. What pricing options are available for accessing the report?
Pricing options include single-user, multi-user, and enterprise licenses priced at USD 3800, USD 4500, and USD 5800 respectively.
10. Is the market size provided in terms of value or volume?
The market size is provided in terms of value, measured in Million and volume, measured in cubic micrometers.
11. Are there any specific market keywords associated with the report?
Yes, the market keyword associated with the report is "Europe Nano Sensors Market," which aids in identifying and referencing the specific market segment covered.
12. How do I determine which pricing option suits my needs best?
The pricing options vary based on user requirements and access needs. Individual users may opt for single-user licenses, while businesses requiring broader access may choose multi-user or enterprise licenses for cost-effective access to the report.
13. Are there any additional resources or data provided in the Europe Nano Sensors Market report?
While the report offers comprehensive insights, it's advisable to review the specific contents or supplementary materials provided to ascertain if additional resources or data are available.
14. How can I stay updated on further developments or reports in the Europe Nano Sensors Market?
To stay informed about further developments, trends, and reports in the Europe Nano Sensors Market, consider subscribing to industry newsletters, following relevant companies and organizations, or regularly checking reputable industry news sources and publications.
Methodology
Step 1 - Identification of Relevant Samples Size from Population Database


Step 2 - Approaches for Defining Global Market Size (Value, Volume* & Price*)

Note*: In applicable scenarios
Step 3 - Data Sources
Primary Research
- Web Analytics
- Survey Reports
- Research Institute
- Latest Research Reports
- Opinion Leaders
Secondary Research
- Annual Reports
- White Paper
- Latest Press Release
- Industry Association
- Paid Database
- Investor Presentations

Step 4 - Data Triangulation
Involves using different sources of information in order to increase the validity of a study
These sources are likely to be stakeholders in a program - participants, other researchers, program staff, other community members, and so on.
Then we put all data in single framework & apply various statistical tools to find out the dynamic on the market.
During the analysis stage, feedback from the stakeholder groups would be compared to determine areas of agreement as well as areas of divergence
