

Key Insights
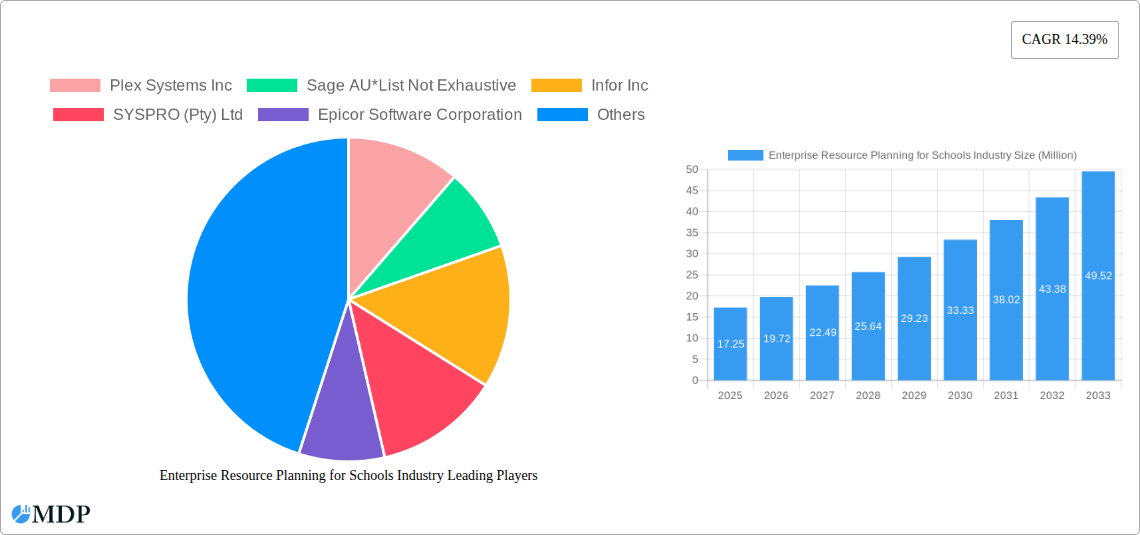
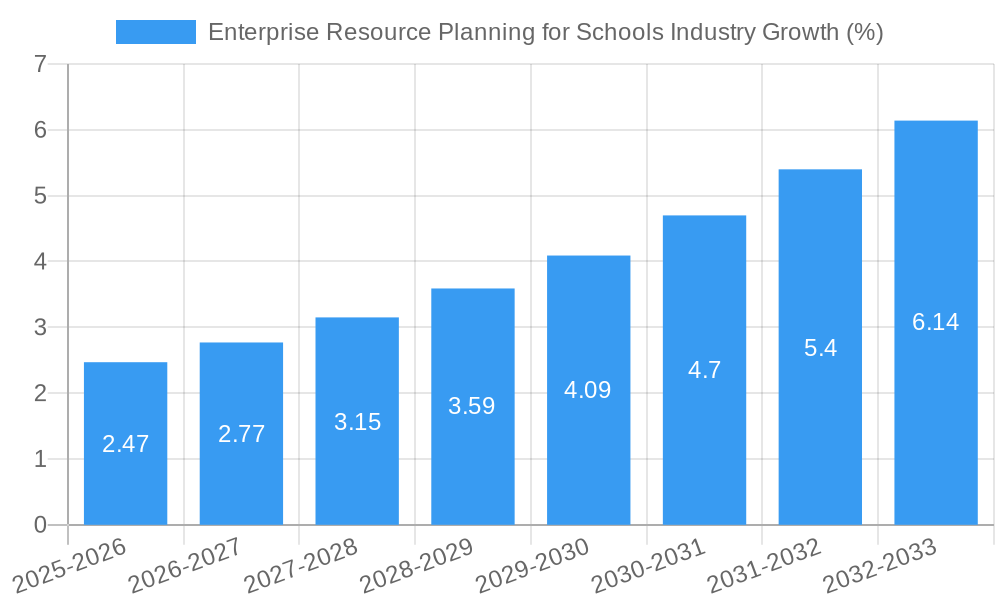
The Enterprise Resource Planning (ERP) for Schools market is experiencing robust growth, projected to reach $17.25 million in 2025 and maintain a Compound Annual Growth Rate (CAGR) of 14.39% from 2025 to 2033. This expansion is driven by several key factors. Firstly, the increasing need for streamlined administrative processes within educational institutions is a major catalyst. Schools are increasingly adopting ERP systems to manage student information, financials, human resources, and academic operations more efficiently. Secondly, the growing adoption of cloud-based ERP solutions offers scalability, accessibility, and cost-effectiveness, particularly appealing to schools with limited IT budgets. Furthermore, the rising demand for data-driven decision-making in education is fueling the market. ERP systems provide valuable insights into student performance, resource allocation, and operational efficiency, enabling schools to optimize their resources and improve outcomes. Finally, government initiatives promoting technological advancements in education are also contributing to the market's growth.
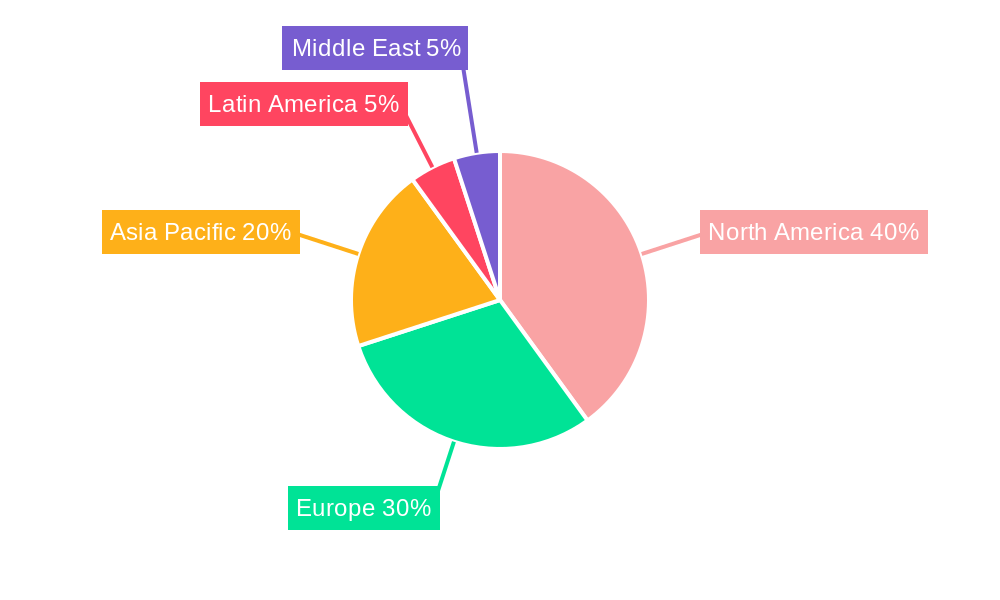
The market segmentation reveals significant opportunities across various deployment models (on-premise and cloud) and functional areas (administration, payroll, academics, finance, transportation, logistical operations, and other functions). Cloud-based solutions are expected to dominate due to their flexibility and cost-effectiveness. While the North American market currently holds a significant share, the Asia-Pacific region is projected to witness substantial growth driven by increasing digitalization and government investments in education technology. Competitive intensity is high, with established players like SAP, Oracle, Microsoft, and Sage competing alongside specialized ERP vendors catering specifically to educational needs. However, challenges remain, including the high initial investment costs associated with ERP implementation and the need for robust training and support to ensure successful adoption among school staff. Future growth will depend on the development of user-friendly, affordable, and easily integrable ERP solutions tailored to the specific needs of diverse educational institutions.
Enterprise Resource Planning (ERP) for Schools: A Comprehensive Market Report (2019-2033)
This in-depth report provides a comprehensive analysis of the Enterprise Resource Planning (ERP) market for the education sector, projecting a market value of $XX Million by 2033. The report covers market dynamics, leading players, technological advancements, and future growth opportunities, offering invaluable insights for stakeholders across the education technology landscape. With a focus on actionable intelligence, this report is an essential resource for strategic decision-making in this rapidly evolving market. The study period covers 2019-2033, with 2025 as the base and estimated year. The forecast period is 2025-2033, and the historical period is 2019-2024.
Enterprise Resource Planning for Schools Industry Market Dynamics & Concentration
The ERP for schools market is experiencing significant growth, driven by increasing demand for efficient administration, improved resource management, and enhanced data security. Market concentration is moderate, with several major players and numerous smaller niche providers. Innovation is primarily driven by advancements in cloud computing, AI, and data analytics, leading to more user-friendly and integrated solutions. Regulatory frameworks vary across regions, influencing the adoption rate of different ERP systems. Product substitutes include standalone software solutions for specific functions, but integrated ERP systems offer greater efficiency and cost-effectiveness. End-user trends show a preference for cloud-based solutions due to their scalability and accessibility. M&A activity is moderate, with approximately xx deals recorded in the last five years, contributing to market consolidation.
- Market Share: The top 5 players account for approximately xx% of the market share in 2025.
- M&A Deal Count (2019-2024): Approximately xx deals.
- Key Innovation Drivers: Cloud computing, AI, data analytics, mobile accessibility.
- Regulatory Impact: Compliance with data privacy regulations (e.g., GDPR, CCPA) influences product development and adoption.
Enterprise Resource Planning for Schools Industry Industry Trends & Analysis
The ERP for schools market is witnessing robust growth, fueled by several key factors. The increasing adoption of cloud-based solutions is a major trend, offering scalability, cost-effectiveness, and accessibility. Technological disruptions, such as the integration of AI and machine learning, are enhancing the capabilities of ERP systems, leading to improved decision-making and automation. Consumer preferences are shifting towards user-friendly interfaces and customizable solutions that cater to the specific needs of different educational institutions. Competitive dynamics are characterized by both collaboration and competition, with players focusing on innovation and strategic partnerships to gain market share. The Compound Annual Growth Rate (CAGR) for the market is estimated at xx% during the forecast period (2025-2033). Market penetration is currently at xx% and is projected to increase to xx% by 2033.
Leading Markets & Segments in Enterprise Resource Planning for Schools Industry
The North American region currently dominates the ERP for schools market, driven by high technology adoption rates and substantial investments in education technology. Within the segments, the Cloud deployment model is experiencing the fastest growth, surpassing the on-premise model due to its flexibility and cost-efficiency. In terms of functionality, the Administration and Finance segments show the highest demand, followed by Academics and Payroll.
- Key Drivers in North America: Strong government funding for education technology, mature IT infrastructure, high internet penetration.
- Cloud Deployment Dominance: Driven by scalability, cost-effectiveness, and accessibility.
- High Demand for Administration and Finance Modules: Driven by the need for efficient management of resources and financial data.
Enterprise Resource Planning for Schools Industry Product Developments
Recent product innovations in the ERP for schools market focus on enhancing user experience, improving data analytics capabilities, and integrating with other educational platforms. Cloud-based solutions with intuitive interfaces and mobile accessibility are gaining popularity. The competitive advantage lies in offering tailored solutions, seamless integration with existing systems, and robust data security features. Technological trends point towards increased automation, AI-powered insights, and personalized learning experiences facilitated by ERP systems.
Key Drivers of Enterprise Resource Planning for Schools Industry Growth
Several factors are propelling the growth of the ERP for schools market. Technological advancements, such as cloud computing and AI, are driving the development of more efficient and user-friendly ERP systems. Government initiatives and funding for educational technology are boosting the adoption of ERP solutions. The increasing need for improved data management and security is also a significant driver. Furthermore, the growing adoption of digital learning platforms is creating demand for integrated ERP systems that can manage both online and offline operations.
Challenges in the Enterprise Resource Planning for Schools Industry Market
The ERP for schools market faces certain challenges. High implementation costs and the need for specialized expertise can be barriers to adoption, especially for smaller institutions. Data security concerns and compliance with regulatory frameworks (GDPR, FERPA etc.) pose significant hurdles. Competition from smaller, niche players offering specialized solutions can also impact market growth. The complexity of integrating legacy systems with new ERP solutions can be time-consuming and expensive. The total impact of these challenges is estimated to reduce market growth by approximately xx% annually.
Emerging Opportunities in Enterprise Resource Planning for Schools Industry
The long-term growth of the ERP for schools market is driven by several emerging opportunities. The increasing adoption of AI and machine learning offers the potential for personalized learning experiences and improved resource allocation. Strategic partnerships between ERP vendors and educational institutions can facilitate greater adoption and customization of ERP systems. Expanding into underserved markets globally presents significant growth potential. The integration of ERP with other educational technology platforms, such as learning management systems (LMS), will further enhance the value proposition of ERP solutions.
Leading Players in the Enterprise Resource Planning for Schools Industry Sector
- Plex Systems Inc
- Sage AU
- Infor Inc
- SYSPRO (Pty) Ltd
- Epicor Software Corporation
- FinancialForce com Inc
- Microsoft Corporation
- NetSuite Inc
- IQMS Inc
- International Business Machines Corporation (IBM)
- Oracle Corporation
- The Sage Group PLC
- Lake Financial Systems
- SAP SE
Key Milestones in Enterprise Resource Planning for Schools Industry Industry
- November 2022: SAP SE launched a new offering to empower business users to build and enhance corporate apps, manage workflows, and design business websites, enhancing the accessibility and customization of ERP systems.
- February 2023: TechDost launched Vedmarg, a cloud-based school management software, focusing on streamlining administrative operations in educational institutions and increasing the competition within the cloud-based ERP market.
Strategic Outlook for Enterprise Resource Planning for Schools Industry Market
The future of the ERP for schools market is promising, with substantial growth potential driven by technological innovation, increased adoption of cloud-based solutions, and expanding global demand. Strategic opportunities lie in developing AI-powered solutions, forging partnerships with educational institutions, and focusing on user experience and customization. The market is poised for continued expansion, creating lucrative opportunities for both established players and new entrants.
Enterprise Resource Planning for Schools Industry Segmentation
-
1. Deployment
- 1.1. On-premise
- 1.2. Cloud
-
2. Function
- 2.1. Administration
- 2.2. Payroll
- 2.3. Academics
- 2.4. Finance
- 2.5. Transportation
- 2.6. Logistical Operations
- 2.7. Other Functions
Enterprise Resource Planning for Schools Industry Segmentation By Geography
- 1. North America
- 2. Europe
- 3. Asia Pacific
- 4. Latin America
- 5. Middle East
Enterprise Resource Planning for Schools Industry REPORT HIGHLIGHTS
| Aspects | Details |
|---|---|
| Study Period | 2019-2033 |
| Base Year | 2024 |
| Estimated Year | 2025 |
| Forecast Period | 2025-2033 |
| Historical Period | 2019-2024 |
| Growth Rate | CAGR of 14.39% from 2019-2033 |
| Segmentation |
|
Table of Contents
- 1. Introduction
- 1.1. Research Scope
- 1.2. Market Segmentation
- 1.3. Research Methodology
- 1.4. Definitions and Assumptions
- 2. Executive Summary
- 2.1. Introduction
- 3. Market Dynamics
- 3.1. Introduction
- 3.2. Market Drivers
- 3.2.1. Consistent Data Availability Across the School Business for Faster Decision Making; Real-time Data Analytics; Increasing Use of Education Software/ Application in Academics
- 3.3. Market Restrains
- 3.3.1. Difficulties in Customization According to Business Needs
- 3.4. Market Trends
- 3.4.1. Education Software/ Application in Academics is Driving the Market Demand
- 4. Market Factor Analysis
- 4.1. Porters Five Forces
- 4.2. Supply/Value Chain
- 4.3. PESTEL analysis
- 4.4. Market Entropy
- 4.5. Patent/Trademark Analysis
- 5. Global Enterprise Resource Planning for Schools Industry Analysis, Insights and Forecast, 2019-2031
- 5.1. Market Analysis, Insights and Forecast - by Deployment
- 5.1.1. On-premise
- 5.1.2. Cloud
- 5.2. Market Analysis, Insights and Forecast - by Function
- 5.2.1. Administration
- 5.2.2. Payroll
- 5.2.3. Academics
- 5.2.4. Finance
- 5.2.5. Transportation
- 5.2.6. Logistical Operations
- 5.2.7. Other Functions
- 5.3. Market Analysis, Insights and Forecast - by Region
- 5.3.1. North America
- 5.3.2. Europe
- 5.3.3. Asia Pacific
- 5.3.4. Latin America
- 5.3.5. Middle East
- 5.1. Market Analysis, Insights and Forecast - by Deployment
- 6. North America Enterprise Resource Planning for Schools Industry Analysis, Insights and Forecast, 2019-2031
- 6.1. Market Analysis, Insights and Forecast - by Deployment
- 6.1.1. On-premise
- 6.1.2. Cloud
- 6.2. Market Analysis, Insights and Forecast - by Function
- 6.2.1. Administration
- 6.2.2. Payroll
- 6.2.3. Academics
- 6.2.4. Finance
- 6.2.5. Transportation
- 6.2.6. Logistical Operations
- 6.2.7. Other Functions
- 6.1. Market Analysis, Insights and Forecast - by Deployment
- 7. Europe Enterprise Resource Planning for Schools Industry Analysis, Insights and Forecast, 2019-2031
- 7.1. Market Analysis, Insights and Forecast - by Deployment
- 7.1.1. On-premise
- 7.1.2. Cloud
- 7.2. Market Analysis, Insights and Forecast - by Function
- 7.2.1. Administration
- 7.2.2. Payroll
- 7.2.3. Academics
- 7.2.4. Finance
- 7.2.5. Transportation
- 7.2.6. Logistical Operations
- 7.2.7. Other Functions
- 7.1. Market Analysis, Insights and Forecast - by Deployment
- 8. Asia Pacific Enterprise Resource Planning for Schools Industry Analysis, Insights and Forecast, 2019-2031
- 8.1. Market Analysis, Insights and Forecast - by Deployment
- 8.1.1. On-premise
- 8.1.2. Cloud
- 8.2. Market Analysis, Insights and Forecast - by Function
- 8.2.1. Administration
- 8.2.2. Payroll
- 8.2.3. Academics
- 8.2.4. Finance
- 8.2.5. Transportation
- 8.2.6. Logistical Operations
- 8.2.7. Other Functions
- 8.1. Market Analysis, Insights and Forecast - by Deployment
- 9. Latin America Enterprise Resource Planning for Schools Industry Analysis, Insights and Forecast, 2019-2031
- 9.1. Market Analysis, Insights and Forecast - by Deployment
- 9.1.1. On-premise
- 9.1.2. Cloud
- 9.2. Market Analysis, Insights and Forecast - by Function
- 9.2.1. Administration
- 9.2.2. Payroll
- 9.2.3. Academics
- 9.2.4. Finance
- 9.2.5. Transportation
- 9.2.6. Logistical Operations
- 9.2.7. Other Functions
- 9.1. Market Analysis, Insights and Forecast - by Deployment
- 10. Middle East Enterprise Resource Planning for Schools Industry Analysis, Insights and Forecast, 2019-2031
- 10.1. Market Analysis, Insights and Forecast - by Deployment
- 10.1.1. On-premise
- 10.1.2. Cloud
- 10.2. Market Analysis, Insights and Forecast - by Function
- 10.2.1. Administration
- 10.2.2. Payroll
- 10.2.3. Academics
- 10.2.4. Finance
- 10.2.5. Transportation
- 10.2.6. Logistical Operations
- 10.2.7. Other Functions
- 10.1. Market Analysis, Insights and Forecast - by Deployment
- 11. North America Enterprise Resource Planning for Schools Industry Analysis, Insights and Forecast, 2019-2031
- 11.1. Market Analysis, Insights and Forecast - By Country/Sub-region
- 11.1.1.
- 12. Europe Enterprise Resource Planning for Schools Industry Analysis, Insights and Forecast, 2019-2031
- 12.1. Market Analysis, Insights and Forecast - By Country/Sub-region
- 12.1.1.
- 13. Asia Pacific Enterprise Resource Planning for Schools Industry Analysis, Insights and Forecast, 2019-2031
- 13.1. Market Analysis, Insights and Forecast - By Country/Sub-region
- 13.1.1.
- 14. Latin America Enterprise Resource Planning for Schools Industry Analysis, Insights and Forecast, 2019-2031
- 14.1. Market Analysis, Insights and Forecast - By Country/Sub-region
- 14.1.1.
- 15. Middle East Enterprise Resource Planning for Schools Industry Analysis, Insights and Forecast, 2019-2031
- 15.1. Market Analysis, Insights and Forecast - By Country/Sub-region
- 15.1.1.
- 16. Competitive Analysis
- 16.1. Global Market Share Analysis 2024
- 16.2. Company Profiles
- 16.2.1 Plex Systems Inc
- 16.2.1.1. Overview
- 16.2.1.2. Products
- 16.2.1.3. SWOT Analysis
- 16.2.1.4. Recent Developments
- 16.2.1.5. Financials (Based on Availability)
- 16.2.2 Sage AU*List Not Exhaustive
- 16.2.2.1. Overview
- 16.2.2.2. Products
- 16.2.2.3. SWOT Analysis
- 16.2.2.4. Recent Developments
- 16.2.2.5. Financials (Based on Availability)
- 16.2.3 Infor Inc
- 16.2.3.1. Overview
- 16.2.3.2. Products
- 16.2.3.3. SWOT Analysis
- 16.2.3.4. Recent Developments
- 16.2.3.5. Financials (Based on Availability)
- 16.2.4 SYSPRO (Pty) Ltd
- 16.2.4.1. Overview
- 16.2.4.2. Products
- 16.2.4.3. SWOT Analysis
- 16.2.4.4. Recent Developments
- 16.2.4.5. Financials (Based on Availability)
- 16.2.5 Epicor Software Corporation
- 16.2.5.1. Overview
- 16.2.5.2. Products
- 16.2.5.3. SWOT Analysis
- 16.2.5.4. Recent Developments
- 16.2.5.5. Financials (Based on Availability)
- 16.2.6 FinancialForce com Inc
- 16.2.6.1. Overview
- 16.2.6.2. Products
- 16.2.6.3. SWOT Analysis
- 16.2.6.4. Recent Developments
- 16.2.6.5. Financials (Based on Availability)
- 16.2.7 Microsoft Corporation
- 16.2.7.1. Overview
- 16.2.7.2. Products
- 16.2.7.3. SWOT Analysis
- 16.2.7.4. Recent Developments
- 16.2.7.5. Financials (Based on Availability)
- 16.2.8 NetSuite Inc
- 16.2.8.1. Overview
- 16.2.8.2. Products
- 16.2.8.3. SWOT Analysis
- 16.2.8.4. Recent Developments
- 16.2.8.5. Financials (Based on Availability)
- 16.2.9 IQMS Inc
- 16.2.9.1. Overview
- 16.2.9.2. Products
- 16.2.9.3. SWOT Analysis
- 16.2.9.4. Recent Developments
- 16.2.9.5. Financials (Based on Availability)
- 16.2.10 International Business Machines Corporation (IBM)
- 16.2.10.1. Overview
- 16.2.10.2. Products
- 16.2.10.3. SWOT Analysis
- 16.2.10.4. Recent Developments
- 16.2.10.5. Financials (Based on Availability)
- 16.2.11 Oracle Corporation
- 16.2.11.1. Overview
- 16.2.11.2. Products
- 16.2.11.3. SWOT Analysis
- 16.2.11.4. Recent Developments
- 16.2.11.5. Financials (Based on Availability)
- 16.2.12 The Sage Group PLC
- 16.2.12.1. Overview
- 16.2.12.2. Products
- 16.2.12.3. SWOT Analysis
- 16.2.12.4. Recent Developments
- 16.2.12.5. Financials (Based on Availability)
- 16.2.13 Lake Financial Systems
- 16.2.13.1. Overview
- 16.2.13.2. Products
- 16.2.13.3. SWOT Analysis
- 16.2.13.4. Recent Developments
- 16.2.13.5. Financials (Based on Availability)
- 16.2.14 SAP SE
- 16.2.14.1. Overview
- 16.2.14.2. Products
- 16.2.14.3. SWOT Analysis
- 16.2.14.4. Recent Developments
- 16.2.14.5. Financials (Based on Availability)
- 16.2.1 Plex Systems Inc
List of Figures
- Figure 1: Global Enterprise Resource Planning for Schools Industry Revenue Breakdown (Million, %) by Region 2024 & 2032
- Figure 2: North America Enterprise Resource Planning for Schools Industry Revenue (Million), by Country 2024 & 2032
- Figure 3: North America Enterprise Resource Planning for Schools Industry Revenue Share (%), by Country 2024 & 2032
- Figure 4: Europe Enterprise Resource Planning for Schools Industry Revenue (Million), by Country 2024 & 2032
- Figure 5: Europe Enterprise Resource Planning for Schools Industry Revenue Share (%), by Country 2024 & 2032
- Figure 6: Asia Pacific Enterprise Resource Planning for Schools Industry Revenue (Million), by Country 2024 & 2032
- Figure 7: Asia Pacific Enterprise Resource Planning for Schools Industry Revenue Share (%), by Country 2024 & 2032
- Figure 8: Latin America Enterprise Resource Planning for Schools Industry Revenue (Million), by Country 2024 & 2032
- Figure 9: Latin America Enterprise Resource Planning for Schools Industry Revenue Share (%), by Country 2024 & 2032
- Figure 10: Middle East Enterprise Resource Planning for Schools Industry Revenue (Million), by Country 2024 & 2032
- Figure 11: Middle East Enterprise Resource Planning for Schools Industry Revenue Share (%), by Country 2024 & 2032
- Figure 12: North America Enterprise Resource Planning for Schools Industry Revenue (Million), by Deployment 2024 & 2032
- Figure 13: North America Enterprise Resource Planning for Schools Industry Revenue Share (%), by Deployment 2024 & 2032
- Figure 14: North America Enterprise Resource Planning for Schools Industry Revenue (Million), by Function 2024 & 2032
- Figure 15: North America Enterprise Resource Planning for Schools Industry Revenue Share (%), by Function 2024 & 2032
- Figure 16: North America Enterprise Resource Planning for Schools Industry Revenue (Million), by Country 2024 & 2032
- Figure 17: North America Enterprise Resource Planning for Schools Industry Revenue Share (%), by Country 2024 & 2032
- Figure 18: Europe Enterprise Resource Planning for Schools Industry Revenue (Million), by Deployment 2024 & 2032
- Figure 19: Europe Enterprise Resource Planning for Schools Industry Revenue Share (%), by Deployment 2024 & 2032
- Figure 20: Europe Enterprise Resource Planning for Schools Industry Revenue (Million), by Function 2024 & 2032
- Figure 21: Europe Enterprise Resource Planning for Schools Industry Revenue Share (%), by Function 2024 & 2032
- Figure 22: Europe Enterprise Resource Planning for Schools Industry Revenue (Million), by Country 2024 & 2032
- Figure 23: Europe Enterprise Resource Planning for Schools Industry Revenue Share (%), by Country 2024 & 2032
- Figure 24: Asia Pacific Enterprise Resource Planning for Schools Industry Revenue (Million), by Deployment 2024 & 2032
- Figure 25: Asia Pacific Enterprise Resource Planning for Schools Industry Revenue Share (%), by Deployment 2024 & 2032
- Figure 26: Asia Pacific Enterprise Resource Planning for Schools Industry Revenue (Million), by Function 2024 & 2032
- Figure 27: Asia Pacific Enterprise Resource Planning for Schools Industry Revenue Share (%), by Function 2024 & 2032
- Figure 28: Asia Pacific Enterprise Resource Planning for Schools Industry Revenue (Million), by Country 2024 & 2032
- Figure 29: Asia Pacific Enterprise Resource Planning for Schools Industry Revenue Share (%), by Country 2024 & 2032
- Figure 30: Latin America Enterprise Resource Planning for Schools Industry Revenue (Million), by Deployment 2024 & 2032
- Figure 31: Latin America Enterprise Resource Planning for Schools Industry Revenue Share (%), by Deployment 2024 & 2032
- Figure 32: Latin America Enterprise Resource Planning for Schools Industry Revenue (Million), by Function 2024 & 2032
- Figure 33: Latin America Enterprise Resource Planning for Schools Industry Revenue Share (%), by Function 2024 & 2032
- Figure 34: Latin America Enterprise Resource Planning for Schools Industry Revenue (Million), by Country 2024 & 2032
- Figure 35: Latin America Enterprise Resource Planning for Schools Industry Revenue Share (%), by Country 2024 & 2032
- Figure 36: Middle East Enterprise Resource Planning for Schools Industry Revenue (Million), by Deployment 2024 & 2032
- Figure 37: Middle East Enterprise Resource Planning for Schools Industry Revenue Share (%), by Deployment 2024 & 2032
- Figure 38: Middle East Enterprise Resource Planning for Schools Industry Revenue (Million), by Function 2024 & 2032
- Figure 39: Middle East Enterprise Resource Planning for Schools Industry Revenue Share (%), by Function 2024 & 2032
- Figure 40: Middle East Enterprise Resource Planning for Schools Industry Revenue (Million), by Country 2024 & 2032
- Figure 41: Middle East Enterprise Resource Planning for Schools Industry Revenue Share (%), by Country 2024 & 2032
List of Tables
- Table 1: Global Enterprise Resource Planning for Schools Industry Revenue Million Forecast, by Region 2019 & 2032
- Table 2: Global Enterprise Resource Planning for Schools Industry Revenue Million Forecast, by Deployment 2019 & 2032
- Table 3: Global Enterprise Resource Planning for Schools Industry Revenue Million Forecast, by Function 2019 & 2032
- Table 4: Global Enterprise Resource Planning for Schools Industry Revenue Million Forecast, by Region 2019 & 2032
- Table 5: Global Enterprise Resource Planning for Schools Industry Revenue Million Forecast, by Country 2019 & 2032
- Table 6: Enterprise Resource Planning for Schools Industry Revenue (Million) Forecast, by Application 2019 & 2032
- Table 7: Global Enterprise Resource Planning for Schools Industry Revenue Million Forecast, by Country 2019 & 2032
- Table 8: Enterprise Resource Planning for Schools Industry Revenue (Million) Forecast, by Application 2019 & 2032
- Table 9: Global Enterprise Resource Planning for Schools Industry Revenue Million Forecast, by Country 2019 & 2032
- Table 10: Enterprise Resource Planning for Schools Industry Revenue (Million) Forecast, by Application 2019 & 2032
- Table 11: Global Enterprise Resource Planning for Schools Industry Revenue Million Forecast, by Country 2019 & 2032
- Table 12: Enterprise Resource Planning for Schools Industry Revenue (Million) Forecast, by Application 2019 & 2032
- Table 13: Global Enterprise Resource Planning for Schools Industry Revenue Million Forecast, by Country 2019 & 2032
- Table 14: Enterprise Resource Planning for Schools Industry Revenue (Million) Forecast, by Application 2019 & 2032
- Table 15: Global Enterprise Resource Planning for Schools Industry Revenue Million Forecast, by Deployment 2019 & 2032
- Table 16: Global Enterprise Resource Planning for Schools Industry Revenue Million Forecast, by Function 2019 & 2032
- Table 17: Global Enterprise Resource Planning for Schools Industry Revenue Million Forecast, by Country 2019 & 2032
- Table 18: Global Enterprise Resource Planning for Schools Industry Revenue Million Forecast, by Deployment 2019 & 2032
- Table 19: Global Enterprise Resource Planning for Schools Industry Revenue Million Forecast, by Function 2019 & 2032
- Table 20: Global Enterprise Resource Planning for Schools Industry Revenue Million Forecast, by Country 2019 & 2032
- Table 21: Global Enterprise Resource Planning for Schools Industry Revenue Million Forecast, by Deployment 2019 & 2032
- Table 22: Global Enterprise Resource Planning for Schools Industry Revenue Million Forecast, by Function 2019 & 2032
- Table 23: Global Enterprise Resource Planning for Schools Industry Revenue Million Forecast, by Country 2019 & 2032
- Table 24: Global Enterprise Resource Planning for Schools Industry Revenue Million Forecast, by Deployment 2019 & 2032
- Table 25: Global Enterprise Resource Planning for Schools Industry Revenue Million Forecast, by Function 2019 & 2032
- Table 26: Global Enterprise Resource Planning for Schools Industry Revenue Million Forecast, by Country 2019 & 2032
- Table 27: Global Enterprise Resource Planning for Schools Industry Revenue Million Forecast, by Deployment 2019 & 2032
- Table 28: Global Enterprise Resource Planning for Schools Industry Revenue Million Forecast, by Function 2019 & 2032
- Table 29: Global Enterprise Resource Planning for Schools Industry Revenue Million Forecast, by Country 2019 & 2032
Frequently Asked Questions
1. What is the projected Compound Annual Growth Rate (CAGR) of the Enterprise Resource Planning for Schools Industry?
The projected CAGR is approximately 14.39%.
2. Which companies are prominent players in the Enterprise Resource Planning for Schools Industry?
Key companies in the market include Plex Systems Inc, Sage AU*List Not Exhaustive, Infor Inc, SYSPRO (Pty) Ltd, Epicor Software Corporation, FinancialForce com Inc, Microsoft Corporation, NetSuite Inc, IQMS Inc, International Business Machines Corporation (IBM), Oracle Corporation, The Sage Group PLC, Lake Financial Systems, SAP SE.
3. What are the main segments of the Enterprise Resource Planning for Schools Industry?
The market segments include Deployment, Function.
4. Can you provide details about the market size?
The market size is estimated to be USD 17.25 Million as of 2022.
5. What are some drivers contributing to market growth?
Consistent Data Availability Across the School Business for Faster Decision Making; Real-time Data Analytics; Increasing Use of Education Software/ Application in Academics.
6. What are the notable trends driving market growth?
Education Software/ Application in Academics is Driving the Market Demand.
7. Are there any restraints impacting market growth?
Difficulties in Customization According to Business Needs.
8. Can you provide examples of recent developments in the market?
February 2023: TechDost announced the launch of Vedmarg, which is a cloud-based school management software that aims to facilitate the complex administrative operations of educational institutions.
9. What pricing options are available for accessing the report?
Pricing options include single-user, multi-user, and enterprise licenses priced at USD 4750, USD 5250, and USD 8750 respectively.
10. Is the market size provided in terms of value or volume?
The market size is provided in terms of value, measured in Million.
11. Are there any specific market keywords associated with the report?
Yes, the market keyword associated with the report is "Enterprise Resource Planning for Schools Industry," which aids in identifying and referencing the specific market segment covered.
12. How do I determine which pricing option suits my needs best?
The pricing options vary based on user requirements and access needs. Individual users may opt for single-user licenses, while businesses requiring broader access may choose multi-user or enterprise licenses for cost-effective access to the report.
13. Are there any additional resources or data provided in the Enterprise Resource Planning for Schools Industry report?
While the report offers comprehensive insights, it's advisable to review the specific contents or supplementary materials provided to ascertain if additional resources or data are available.
14. How can I stay updated on further developments or reports in the Enterprise Resource Planning for Schools Industry?
To stay informed about further developments, trends, and reports in the Enterprise Resource Planning for Schools Industry, consider subscribing to industry newsletters, following relevant companies and organizations, or regularly checking reputable industry news sources and publications.
Methodology
Step 1 - Identification of Relevant Samples Size from Population Database


Step 2 - Approaches for Defining Global Market Size (Value, Volume* & Price*)

Note*: In applicable scenarios
Step 3 - Data Sources
Primary Research
- Web Analytics
- Survey Reports
- Research Institute
- Latest Research Reports
- Opinion Leaders
Secondary Research
- Annual Reports
- White Paper
- Latest Press Release
- Industry Association
- Paid Database
- Investor Presentations

Step 4 - Data Triangulation
Involves using different sources of information in order to increase the validity of a study
These sources are likely to be stakeholders in a program - participants, other researchers, program staff, other community members, and so on.
Then we put all data in single framework & apply various statistical tools to find out the dynamic on the market.
During the analysis stage, feedback from the stakeholder groups would be compared to determine areas of agreement as well as areas of divergence
