


Key Insights
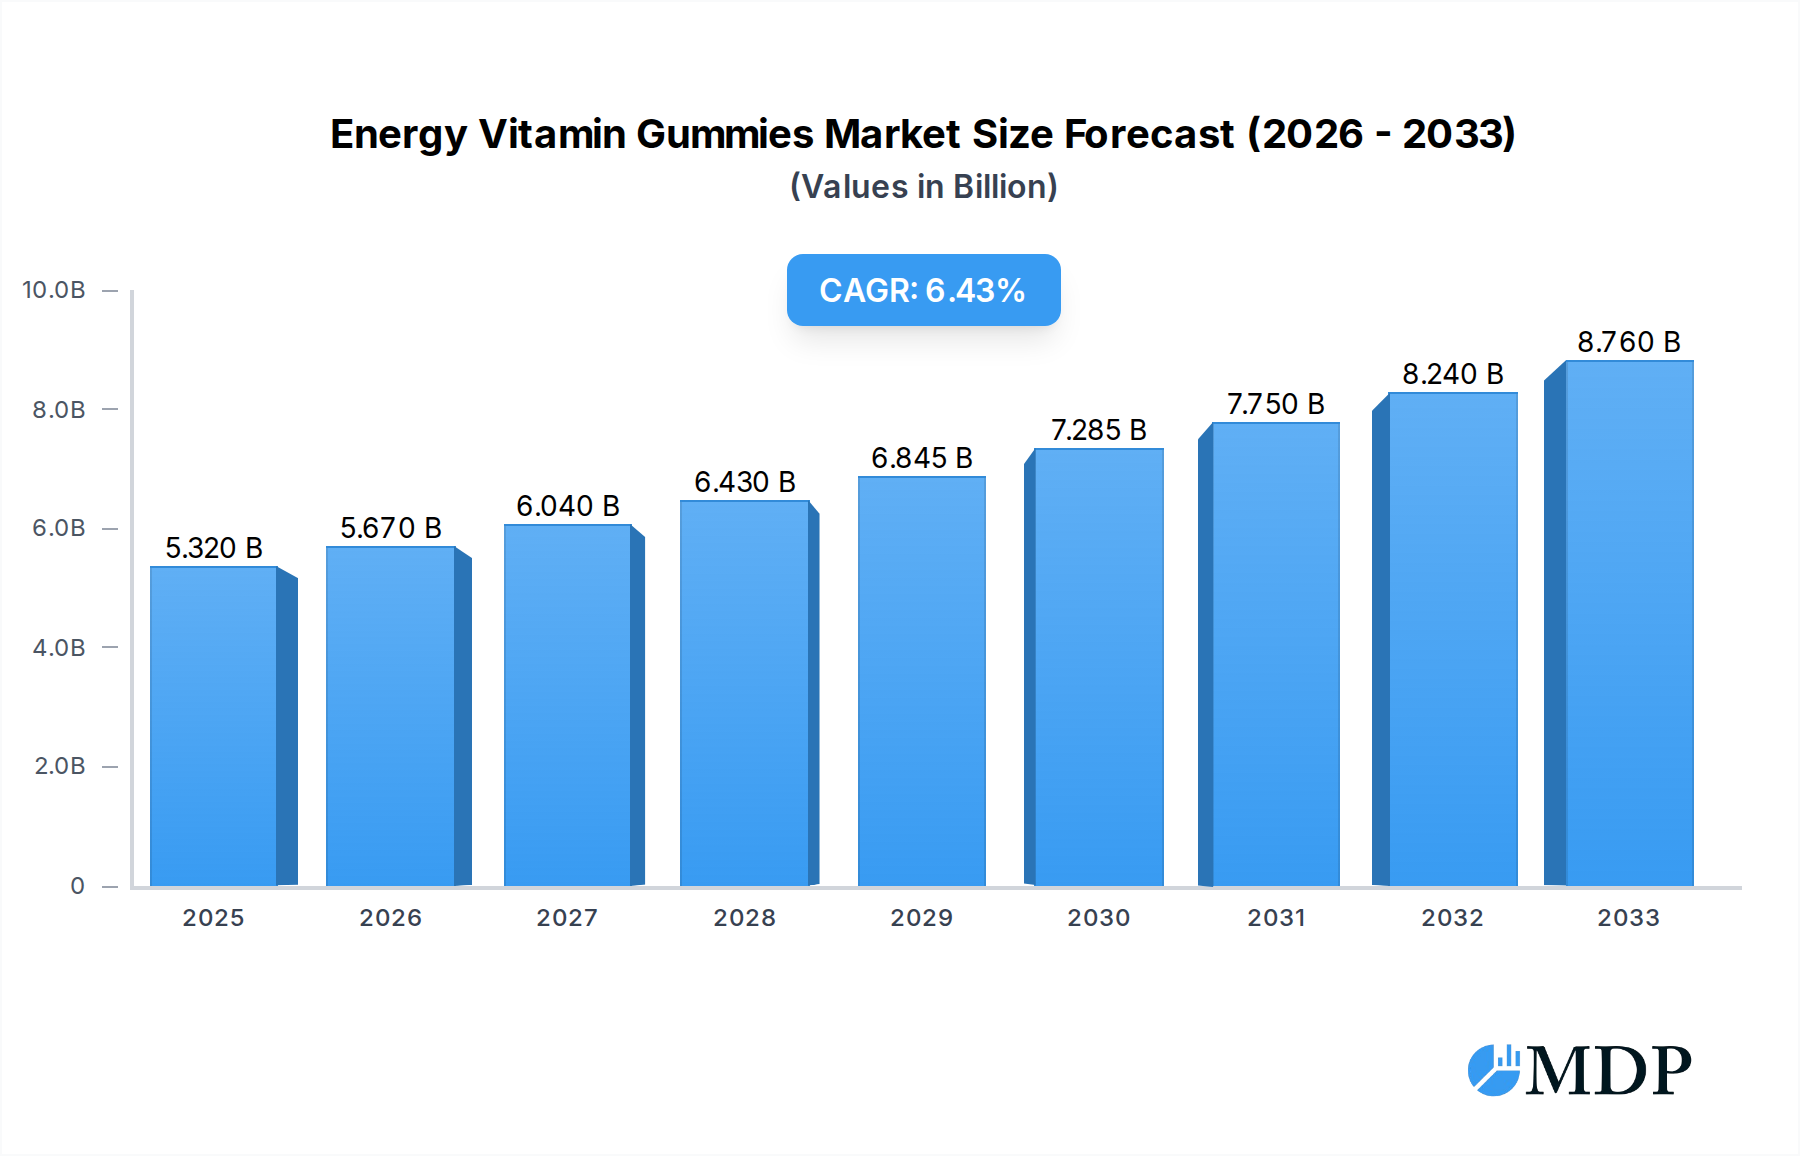
The global market for Energy Vitamin Gummies is poised for substantial growth, projected to reach USD 5.32 billion in 2025. This expansion is driven by a confluence of factors, including the increasing consumer demand for convenient and palatable nutritional supplements, a growing awareness of the role of vitamins and energy boosters in maintaining an active lifestyle, and the rising popularity of gummy formats over traditional pills and powders. The market is expected to witness a robust Compound Annual Growth Rate (CAGR) of 6.57%, indicating sustained momentum and significant opportunities for stakeholders. Key drivers contributing to this growth include the expanding wellness and health-conscious consumer base, particularly among millennials and Gen Z, who are actively seeking to incorporate nutritional supplements into their daily routines. The burgeoning e-commerce landscape further facilitates accessibility, enabling brands to reach a wider audience with targeted marketing campaigns and diverse product offerings. The increasing prevalence of chronic diseases and the desire to bolster immunity are also contributing to the demand for vitamin-enriched products.
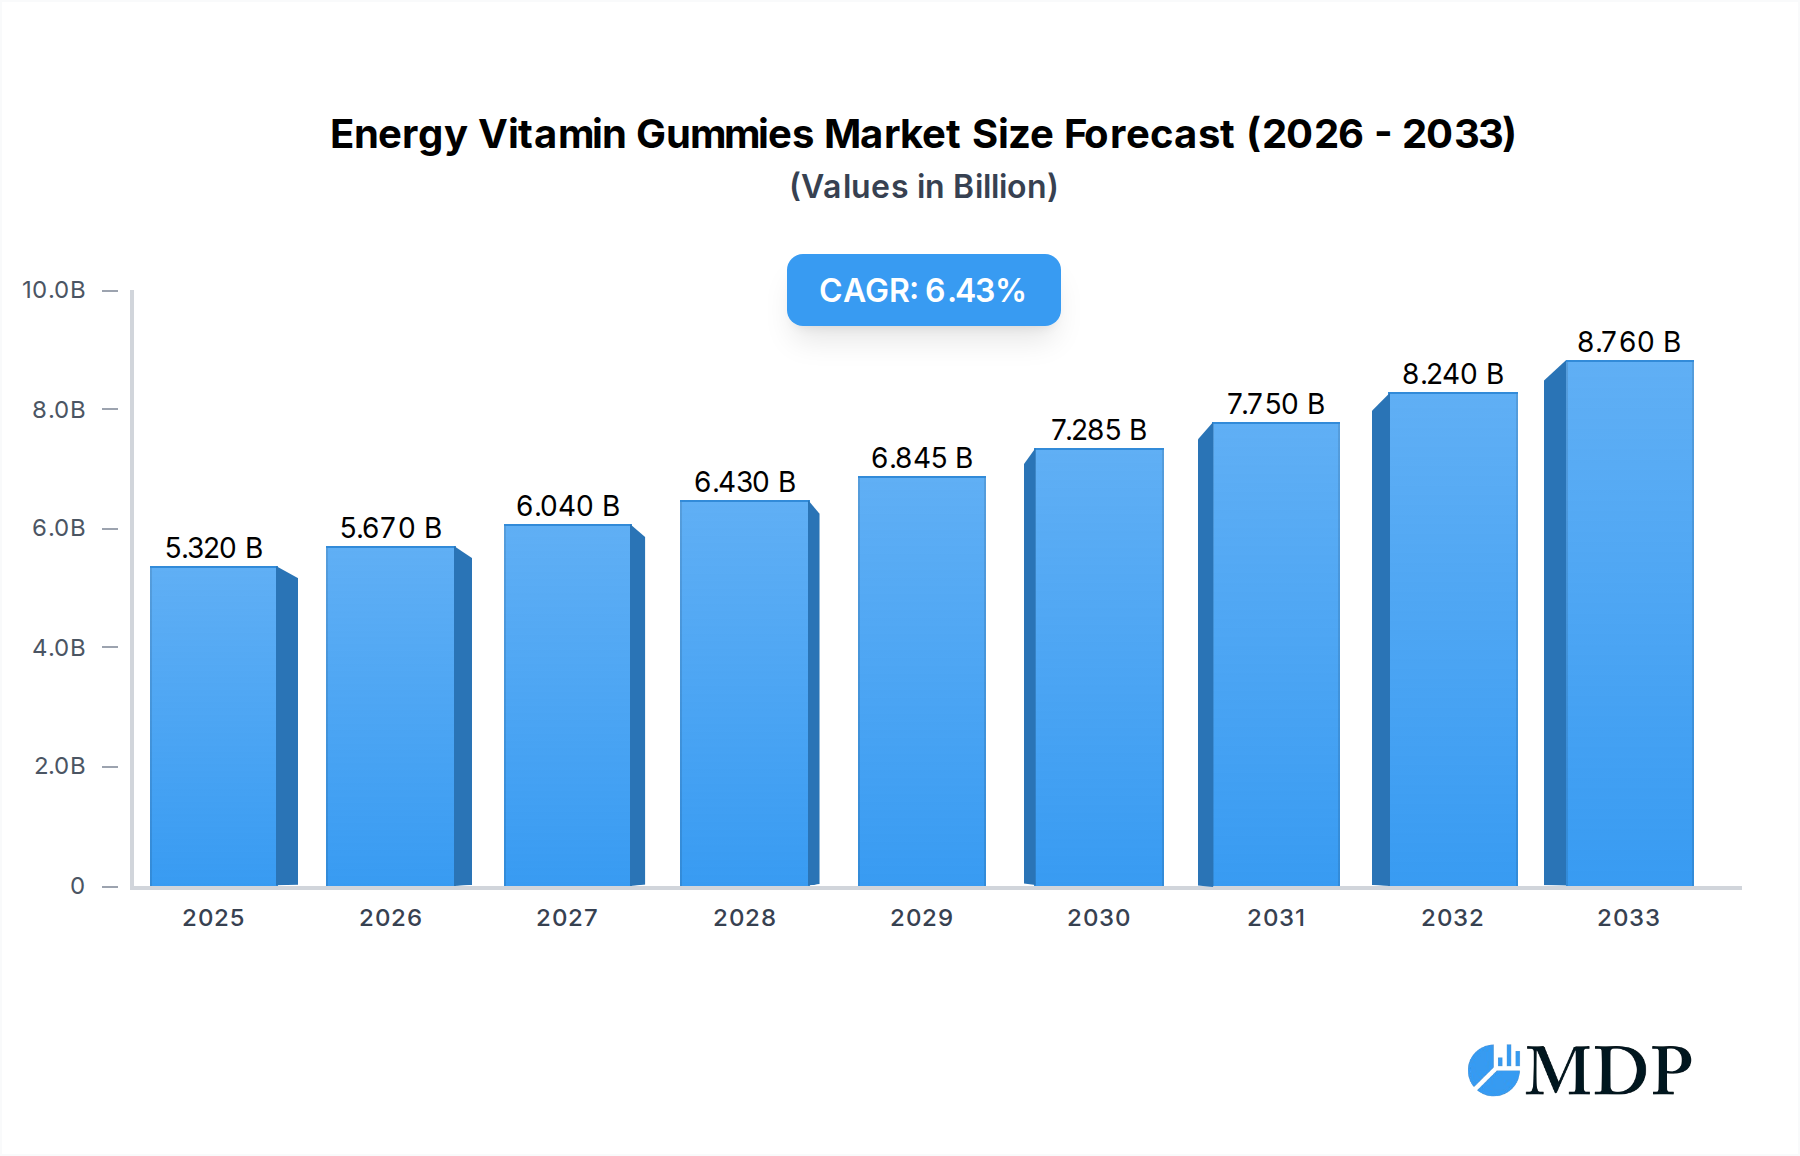
Energy Vitamin Gummies Market Size (In Billion)

The Energy Vitamin Gummies market is segmented into Online Sales and Offline Sales, with online channels expected to witness higher growth due to convenience and wider product availability. In terms of type, both Caffeinated and Decaffeinated variants cater to diverse consumer preferences and needs, from immediate energy boosts to sustained wellness. While the market presents immense potential, certain restraints such as intense competition and the need for stringent quality control and regulatory compliance can pose challenges. However, the overarching trend towards preventive healthcare and the innovation in flavor profiles and functional ingredients are expected to offset these challenges. Companies like Honey Stinger, GU Energy, Science In Sport, and Clif Bar are actively innovating and expanding their product portfolios to capture a larger market share. The Asia Pacific region, with its rapidly growing economies and increasing disposable incomes, is anticipated to emerge as a key growth hub in the coming years, alongside established markets in North America and Europe.
Energy Vitamin Gummies Company Market Share
Energy Vitamin Gummies Market Dynamics & Concentration
The global Energy Vitamin Gummies market is characterized by a highly concentrated landscape, with a few key players like Honey Stinger, GU Energy, and Clif Bar commanding a significant market share exceeding 60%. Innovation in product formulation, particularly the inclusion of natural ingredients and tailored nutritional profiles, acts as a primary driver. Regulatory frameworks, while generally supportive of dietary supplements, are evolving, requiring manufacturers to ensure product safety and accurate labeling, impacting market entry barriers. Product substitutes, ranging from traditional energy bars to drinks and powders, present a constant competitive challenge, pushing energy gummy manufacturers to emphasize convenience and taste. End-user trends lean towards active lifestyles and preventative health, driving demand for convenient, on-the-go nutrition. Mergers and acquisitions (M&A) activities, though currently moderate with an estimated 2 billion USD in total deal value over the historical period, are anticipated to escalate as larger players seek to consolidate their positions and acquire innovative technologies. The number of M&A deals is projected to reach 15 transactions by the forecast period, further intensifying market concentration.
Energy Vitamin Gummies Industry Trends & Analysis
The energy vitamin gummies market is witnessing robust growth, projected to achieve a Compound Annual Growth Rate (CAGR) of approximately 8.5% from the base year of 2025 to 2033. This expansion is fueled by a confluence of factors, including a growing global emphasis on health and wellness, leading to increased market penetration of health-conscious products. Consumers are increasingly seeking convenient and palatable alternatives to traditional supplements, making energy gummies a highly attractive option for busy lifestyles and athletes. The online sales channel has emerged as a dominant force, facilitating wider reach and personalized marketing efforts by brands such as Alete Active Nutrition and HIGH5. Technological disruptions, such as advancements in encapsulation techniques for better nutrient delivery and the development of novel flavor profiles, are continuously reshaping the product landscape. Consumer preferences are shifting towards natural, organic, and vegan ingredients, prompting companies like Skratch Labs and Chia Charge to innovate in this space. Competitive dynamics are characterized by both established sports nutrition giants and emerging specialized brands vying for market share. The caffeinated segment continues to lead due to its direct appeal to the performance enhancement needs of athletes and fitness enthusiasts, while the decaffeinated segment is gaining traction among health-conscious consumers seeking sustained energy without the jitters. The global market value for energy vitamin gummies is estimated to reach over 20 billion USD by 2033.
Leading Markets & Segments in Energy Vitamin Gummies
The energy vitamin gummies market is demonstrably led by the Online Sales application segment, projected to account for over 65% of the total market value by the forecast period. This dominance is driven by the unparalleled convenience, wider product selection, and direct-to-consumer accessibility offered through e-commerce platforms. Key drivers for this segment's growth include the increasing global internet penetration, the rise of sophisticated digital marketing strategies, and the growing consumer comfort with online purchases for health and wellness products. The North America region stands out as the leading geographical market, holding an estimated 35% of the global market share. This leadership is attributed to strong economic policies that favor the health and wellness industry, robust research and development investments by leading companies like Clif Bar and GU Energy, and well-established retail infrastructure supporting both online and offline sales.
Within the product types, the Caffeinated segment commands a substantial market share, estimated at 55%, primarily due to its direct appeal to athletes and individuals seeking an immediate energy boost. The presence of leading brands like Science In Sport and Enervit in this segment further solidifies its dominance. However, the Decaffeinated segment is experiencing a noteworthy surge in growth, driven by a growing demographic of health-conscious consumers who prioritize sustained energy and cognitive support without the potential side effects of caffeine. This segment is expected to witness a CAGR of approximately 9.2% during the forecast period, outperforming the overall market.
- Online Sales Dominance:
- Economic Policies: Favorable e-commerce regulations and digital trade agreements.
- Infrastructure: Widespread internet access and advanced logistics networks.
- Consumer Behavior: Growing preference for home delivery and personalized shopping experiences.
- Marketing Reach: Digital platforms enable precise targeting and wider brand visibility for companies like PROBAR and Muscle MX.
- North America's Leading Position:
- Economic Stability: High disposable incomes and a strong propensity for health-related spending.
- Innovation Hubs: Presence of leading research institutions and R&D centers for companies like Seattle Gummy Company.
- Health Awareness: A deeply ingrained culture of fitness and proactive health management.
- Retail Landscape: A mature and competitive retail environment that supports product availability.
- Caffeinated Segment's Strength:
- Performance Enhancement: Direct link to athletic performance and endurance for brands like Torq.
- Demand from Athletes: Continuous demand from professional and amateur athletes.
- Product Innovation: Ongoing development of new caffeine delivery systems and synergistic ingredients.
- Decaffeinated Segment's Growth:
- Wellness Trend: Alignment with the broader wellness movement and demand for natural energy solutions.
- Broader Appeal: Attracts a wider consumer base beyond dedicated athletes.
- Nutritional Focus: Emphasis on vitamins and other beneficial ingredients for sustained well-being.
Energy Vitamin Gummies Product Developments
Recent product developments in the energy vitamin gummies sector are primarily focused on enhancing nutritional profiles and optimizing delivery systems. Brands are increasingly incorporating natural sweeteners, plant-based ingredients, and targeted vitamin blends to cater to evolving consumer preferences. Innovations include gummies with added electrolytes for hydration, nootropics for cognitive function, and adaptogens for stress management. Companies like Precision Hydration and Gatorade are leading in developing gummies that offer specific performance benefits and faster absorption rates. The competitive advantage lies in offering scientifically backed formulations that deliver tangible results, alongside appealing flavors and textures, ensuring both efficacy and consumer satisfaction in a crowded market.
Key Drivers of Energy Vitamin Gummies Growth
Several factors are propelling the energy vitamin gummies market forward. Technologically, advancements in gummy manufacturing, such as improved encapsulation for better nutrient stability and controlled release, are crucial. Economically, rising disposable incomes globally and a growing interest in preventative healthcare contribute significantly to consumer spending on supplements. Regulatory support for dietary supplements, provided they meet safety and labeling standards, also fosters market expansion. Furthermore, the increasing adoption of active lifestyles and participation in sports and fitness activities worldwide directly fuels the demand for convenient and effective energy supplementation solutions.
Challenges in the Energy Vitamin Gummies Market
Despite its promising growth, the energy vitamin gummies market faces several challenges. Regulatory hurdles, particularly concerning claims made about health benefits and ingredient sourcing, can be complex and vary by region. Supply chain disruptions, including raw material availability and fluctuating prices, pose a significant risk to production and profitability, potentially impacting an estimated 15% of production costs. Intense competitive pressures from established brands and new entrants, often leading to price wars, can erode profit margins. Additionally, consumer skepticism regarding the efficacy and "gummy" format for serious athletic performance can limit market penetration in certain segments, impacting an estimated 10% of potential market adoption.
Emerging Opportunities in Energy Vitamin Gummies
Emerging opportunities in the energy vitamin gummies market are abundant and poised to drive long-term growth. Technological breakthroughs in personalized nutrition, allowing for customized gummy formulations based on individual dietary needs and genetic profiles, represent a significant frontier. Strategic partnerships between gummy manufacturers and fitness influencers, sports teams, and health and wellness platforms can amplify brand reach and credibility. Market expansion into underserved regions with growing health consciousness, particularly in Asia-Pacific and Latin America, offers substantial untapped potential. The increasing demand for vegan, gluten-free, and allergen-free options presents a niche yet rapidly growing market segment.
Leading Players in the Energy Vitamin Gummies Sector
- Honey Stinger
- GU Energy
- Science In Sport
- Clif Bar
- Skratch Labs
- Seattle Gummy Company
- Alete Active Nutrition
- Enervit
- PROBAR
- Chia Charge
- Torq
- Precision Hydration
- Gatorade
- HIGH5
- Muscle MX
Key Milestones in Energy Vitamin Gummies Industry
- 2019: Introduction of the first widely recognized energy vitamin gummy formulations targeting endurance athletes.
- 2020: Increased consumer adoption of online purchasing for health supplements, boosting e-commerce sales channels.
- 2021: Growing focus on natural and organic ingredients in gummy production, influencing R&D.
- 2022: Expansion of product lines to include vegan and plant-based energy gummies.
- 2023: Emergence of specialized gummies catering to cognitive enhancement and stress relief.
- 2024: Enhanced focus on sustainable sourcing and eco-friendly packaging by leading manufacturers.
Strategic Outlook for Energy Vitamin Gummies Market
The strategic outlook for the energy vitamin gummies market is exceptionally positive, fueled by sustained consumer demand for convenient, effective, and health-conscious nutrition solutions. Growth accelerators include continued innovation in product formulation, leveraging advancements in ingredient science and delivery systems. Expanding distribution networks, particularly through robust online channels and strategic retail partnerships, will be crucial for market penetration. Furthermore, focusing on consumer education regarding the benefits and applications of energy gummies, coupled with targeted marketing campaigns, will further enhance market adoption. The market is poised for significant expansion as companies adapt to evolving consumer preferences and capitalize on emerging technological and market opportunities.
Energy Vitamin Gummies Segmentation
-
1. Application
- 1.1. Online Sales
- 1.2. Offline Sales
-
2. Type
- 2.1. Caffeinated
- 2.2. Decaffeinated
Energy Vitamin Gummies Segmentation By Geography
-
1. North America
- 1.1. United States
- 1.2. Canada
- 1.3. Mexico
-
2. South America
- 2.1. Brazil
- 2.2. Argentina
- 2.3. Rest of South America
-
3. Europe
- 3.1. United Kingdom
- 3.2. Germany
- 3.3. France
- 3.4. Italy
- 3.5. Spain
- 3.6. Russia
- 3.7. Benelux
- 3.8. Nordics
- 3.9. Rest of Europe
-
4. Middle East & Africa
- 4.1. Turkey
- 4.2. Israel
- 4.3. GCC
- 4.4. North Africa
- 4.5. South Africa
- 4.6. Rest of Middle East & Africa
-
5. Asia Pacific
- 5.1. China
- 5.2. India
- 5.3. Japan
- 5.4. South Korea
- 5.5. ASEAN
- 5.6. Oceania
- 5.7. Rest of Asia Pacific
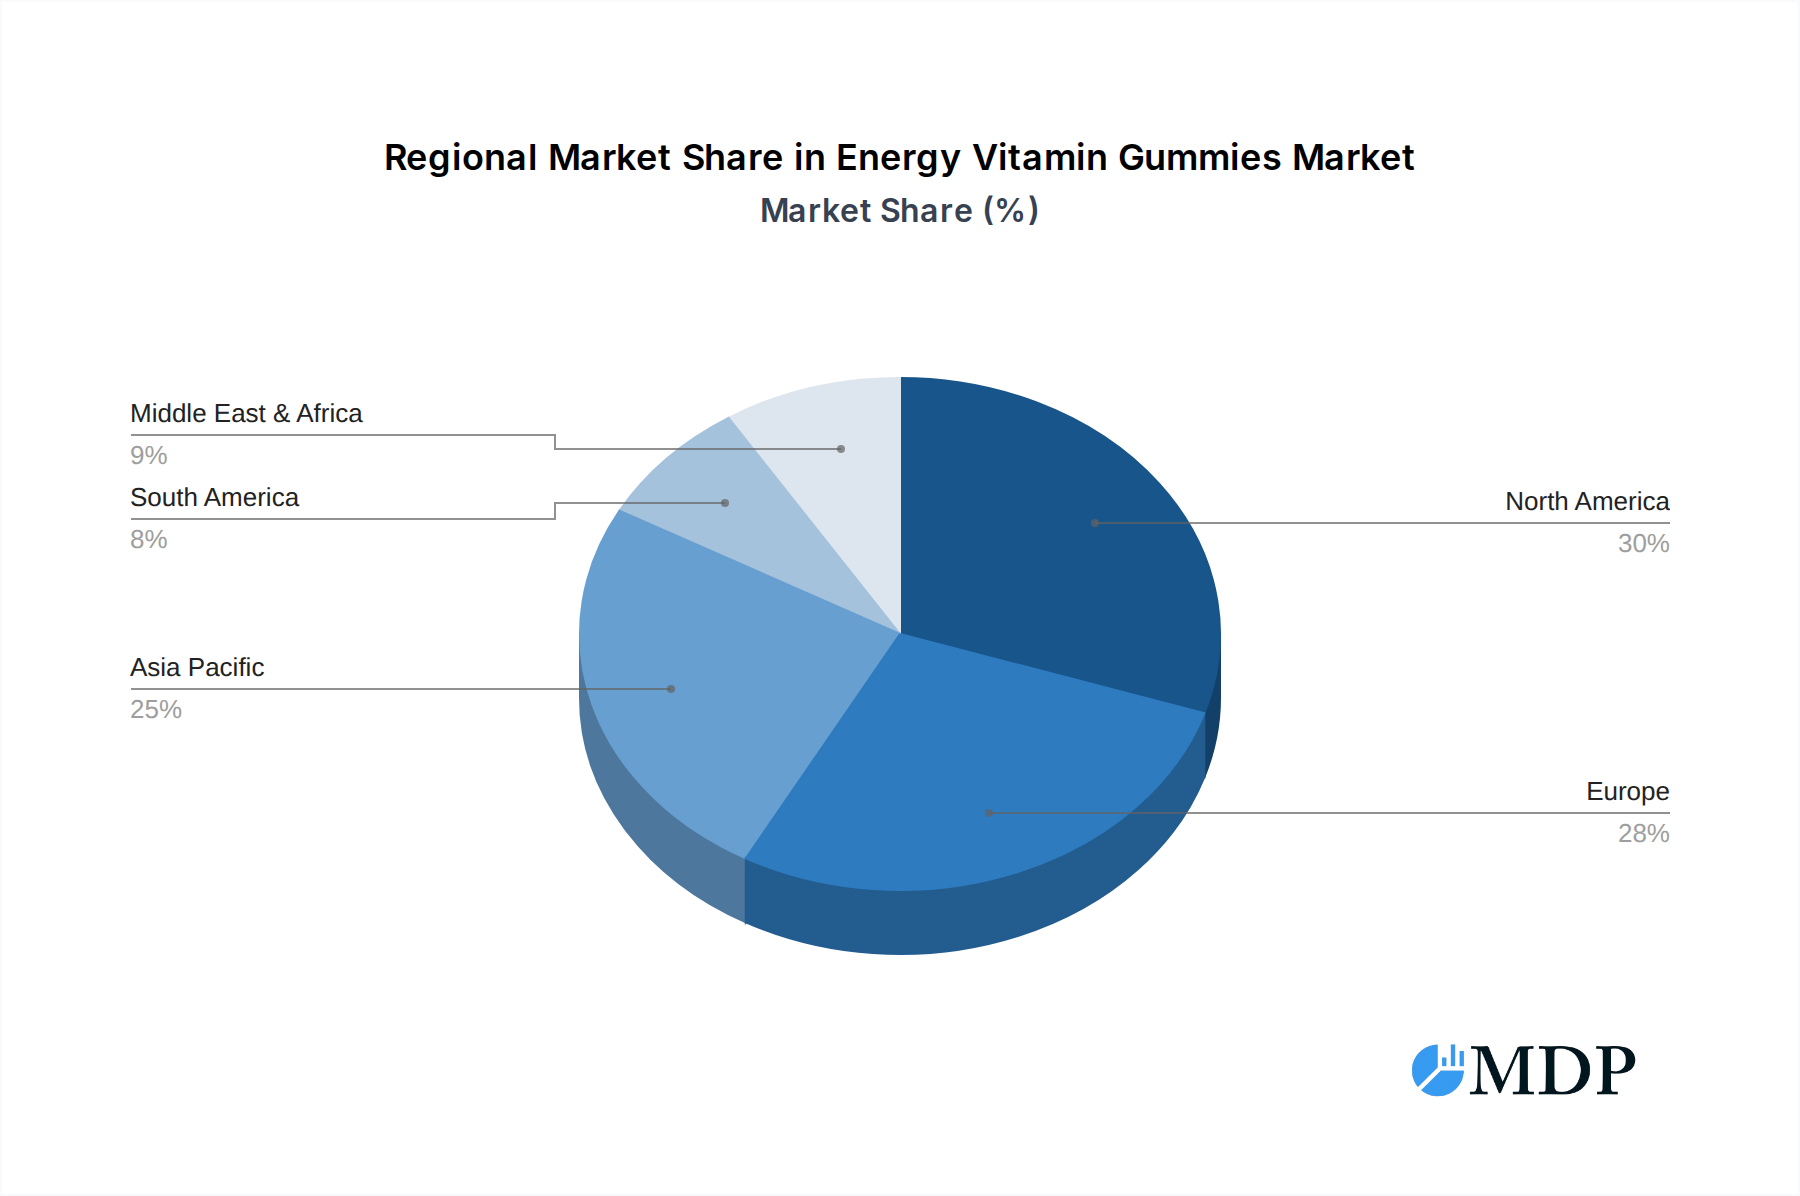
Energy Vitamin Gummies Regional Market Share
Geographic Coverage of Energy Vitamin Gummies
Energy Vitamin Gummies REPORT HIGHLIGHTS
| Aspects | Details |
|---|---|
| Study Period | 2020-2034 |
| Base Year | 2025 |
| Estimated Year | 2026 |
| Forecast Period | 2026-2034 |
| Historical Period | 2020-2025 |
| Growth Rate | CAGR of 6.57% from 2020-2034 |
| Segmentation |
|
Table of Contents
- 1. Introduction
- 1.1. Research Scope
- 1.2. Market Segmentation
- 1.3. Research Objective
- 1.4. Definitions and Assumptions
- 2. Executive Summary
- 2.1. Market Snapshot
- 3. Market Dynamics
- 3.1. Market Drivers
- 3.2. Market Restrains
- 3.3. Market Trends
- 3.4. Market Opportunities
- 4. Market Factor Analysis
- 4.1. Porters Five Forces
- 4.1.1. Bargaining Power of Suppliers
- 4.1.2. Bargaining Power of Buyers
- 4.1.3. Threat of New Entrants
- 4.1.4. Threat of Substitutes
- 4.1.5. Competitive Rivalry
- 4.2. PESTEL analysis
- 4.3. BCG Analysis
- 4.3.1. Stars (High Growth, High Market Share)
- 4.3.2. Cash Cows (Low Growth, High Market Share)
- 4.3.3. Question Mark (High Growth, Low Market Share)
- 4.3.4. Dogs (Low Growth, Low Market Share)
- 4.4. Ansoff Matrix Analysis
- 4.5. Supply Chain Analysis
- 4.6. Regulatory Landscape
- 4.7. Current Market Potential and Opportunity Assessment (TAM–SAM–SOM Framework)
- 4.8. MDP Analyst Note
- 4.1. Porters Five Forces
- 5. Market Analysis, Insights and Forecast 2021-2033
- 5.1. Market Analysis, Insights and Forecast - by Application
- 5.1.1. Online Sales
- 5.1.2. Offline Sales
- 5.2. Market Analysis, Insights and Forecast - by Type
- 5.2.1. Caffeinated
- 5.2.2. Decaffeinated
- 5.3. Market Analysis, Insights and Forecast - by Region
- 5.3.1. North America
- 5.3.2. South America
- 5.3.3. Europe
- 5.3.4. Middle East & Africa
- 5.3.5. Asia Pacific
- 5.1. Market Analysis, Insights and Forecast - by Application
- 6. Global Energy Vitamin Gummies Analysis, Insights and Forecast, 2021-2033
- 6.1. Market Analysis, Insights and Forecast - by Application
- 6.1.1. Online Sales
- 6.1.2. Offline Sales
- 6.2. Market Analysis, Insights and Forecast - by Type
- 6.2.1. Caffeinated
- 6.2.2. Decaffeinated
- 6.1. Market Analysis, Insights and Forecast - by Application
- 7. North America Energy Vitamin Gummies Analysis, Insights and Forecast, 2020-2032
- 7.1. Market Analysis, Insights and Forecast - by Application
- 7.1.1. Online Sales
- 7.1.2. Offline Sales
- 7.2. Market Analysis, Insights and Forecast - by Type
- 7.2.1. Caffeinated
- 7.2.2. Decaffeinated
- 7.1. Market Analysis, Insights and Forecast - by Application
- 8. South America Energy Vitamin Gummies Analysis, Insights and Forecast, 2020-2032
- 8.1. Market Analysis, Insights and Forecast - by Application
- 8.1.1. Online Sales
- 8.1.2. Offline Sales
- 8.2. Market Analysis, Insights and Forecast - by Type
- 8.2.1. Caffeinated
- 8.2.2. Decaffeinated
- 8.1. Market Analysis, Insights and Forecast - by Application
- 9. Europe Energy Vitamin Gummies Analysis, Insights and Forecast, 2020-2032
- 9.1. Market Analysis, Insights and Forecast - by Application
- 9.1.1. Online Sales
- 9.1.2. Offline Sales
- 9.2. Market Analysis, Insights and Forecast - by Type
- 9.2.1. Caffeinated
- 9.2.2. Decaffeinated
- 9.1. Market Analysis, Insights and Forecast - by Application
- 10. Middle East & Africa Energy Vitamin Gummies Analysis, Insights and Forecast, 2020-2032
- 10.1. Market Analysis, Insights and Forecast - by Application
- 10.1.1. Online Sales
- 10.1.2. Offline Sales
- 10.2. Market Analysis, Insights and Forecast - by Type
- 10.2.1. Caffeinated
- 10.2.2. Decaffeinated
- 10.1. Market Analysis, Insights and Forecast - by Application
- 11. Asia Pacific Energy Vitamin Gummies Analysis, Insights and Forecast, 2020-2032
- 11.1. Market Analysis, Insights and Forecast - by Application
- 11.1.1. Online Sales
- 11.1.2. Offline Sales
- 11.2. Market Analysis, Insights and Forecast - by Type
- 11.2.1. Caffeinated
- 11.2.2. Decaffeinated
- 11.1. Market Analysis, Insights and Forecast - by Application
- 12. Competitive Analysis
- 12.1. Company Profiles
- 12.1.1 Honey Stinger
- 12.1.1.1. Company Overview
- 12.1.1.2. Products
- 12.1.1.3. Company Financials
- 12.1.1.4. SWOT Analysis
- 12.1.2 GU Energy
- 12.1.2.1. Company Overview
- 12.1.2.2. Products
- 12.1.2.3. Company Financials
- 12.1.2.4. SWOT Analysis
- 12.1.3 Science In Sport
- 12.1.3.1. Company Overview
- 12.1.3.2. Products
- 12.1.3.3. Company Financials
- 12.1.3.4. SWOT Analysis
- 12.1.4 Clif Bar
- 12.1.4.1. Company Overview
- 12.1.4.2. Products
- 12.1.4.3. Company Financials
- 12.1.4.4. SWOT Analysis
- 12.1.5 Skratch Labs
- 12.1.5.1. Company Overview
- 12.1.5.2. Products
- 12.1.5.3. Company Financials
- 12.1.5.4. SWOT Analysis
- 12.1.6 Seattle Gummy Company
- 12.1.6.1. Company Overview
- 12.1.6.2. Products
- 12.1.6.3. Company Financials
- 12.1.6.4. SWOT Analysis
- 12.1.7 Alete Active Nutrition
- 12.1.7.1. Company Overview
- 12.1.7.2. Products
- 12.1.7.3. Company Financials
- 12.1.7.4. SWOT Analysis
- 12.1.8 Enervit
- 12.1.8.1. Company Overview
- 12.1.8.2. Products
- 12.1.8.3. Company Financials
- 12.1.8.4. SWOT Analysis
- 12.1.9 PROBAR
- 12.1.9.1. Company Overview
- 12.1.9.2. Products
- 12.1.9.3. Company Financials
- 12.1.9.4. SWOT Analysis
- 12.1.10 Chia Charge
- 12.1.10.1. Company Overview
- 12.1.10.2. Products
- 12.1.10.3. Company Financials
- 12.1.10.4. SWOT Analysis
- 12.1.11 Torq
- 12.1.11.1. Company Overview
- 12.1.11.2. Products
- 12.1.11.3. Company Financials
- 12.1.11.4. SWOT Analysis
- 12.1.12 Precision Hydration
- 12.1.12.1. Company Overview
- 12.1.12.2. Products
- 12.1.12.3. Company Financials
- 12.1.12.4. SWOT Analysis
- 12.1.13 Gatorade
- 12.1.13.1. Company Overview
- 12.1.13.2. Products
- 12.1.13.3. Company Financials
- 12.1.13.4. SWOT Analysis
- 12.1.14 HIGH5
- 12.1.14.1. Company Overview
- 12.1.14.2. Products
- 12.1.14.3. Company Financials
- 12.1.14.4. SWOT Analysis
- 12.1.15 Muscle MX
- 12.1.15.1. Company Overview
- 12.1.15.2. Products
- 12.1.15.3. Company Financials
- 12.1.15.4. SWOT Analysis
- 12.1.1 Honey Stinger
- 12.2. Market Entropy
- 12.2.1 Company's Key Areas Served
- 12.2.2 Recent Developments
- 12.3. Company Market Share Analysis 2025
- 12.3.1 Top 5 Companies Market Share Analysis
- 12.3.2 Top 3 Companies Market Share Analysis
- 12.4. List of Potential Customers
- 13. Research Methodology
List of Figures
- Figure 1: Global Energy Vitamin Gummies Revenue Breakdown (undefined, %) by Region 2025 & 2033
- Figure 2: Global Energy Vitamin Gummies Volume Breakdown (K, %) by Region 2025 & 2033
- Figure 3: North America Energy Vitamin Gummies Revenue (undefined), by Application 2025 & 2033
- Figure 4: North America Energy Vitamin Gummies Volume (K), by Application 2025 & 2033
- Figure 5: North America Energy Vitamin Gummies Revenue Share (%), by Application 2025 & 2033
- Figure 6: North America Energy Vitamin Gummies Volume Share (%), by Application 2025 & 2033
- Figure 7: North America Energy Vitamin Gummies Revenue (undefined), by Type 2025 & 2033
- Figure 8: North America Energy Vitamin Gummies Volume (K), by Type 2025 & 2033
- Figure 9: North America Energy Vitamin Gummies Revenue Share (%), by Type 2025 & 2033
- Figure 10: North America Energy Vitamin Gummies Volume Share (%), by Type 2025 & 2033
- Figure 11: North America Energy Vitamin Gummies Revenue (undefined), by Country 2025 & 2033
- Figure 12: North America Energy Vitamin Gummies Volume (K), by Country 2025 & 2033
- Figure 13: North America Energy Vitamin Gummies Revenue Share (%), by Country 2025 & 2033
- Figure 14: North America Energy Vitamin Gummies Volume Share (%), by Country 2025 & 2033
- Figure 15: South America Energy Vitamin Gummies Revenue (undefined), by Application 2025 & 2033
- Figure 16: South America Energy Vitamin Gummies Volume (K), by Application 2025 & 2033
- Figure 17: South America Energy Vitamin Gummies Revenue Share (%), by Application 2025 & 2033
- Figure 18: South America Energy Vitamin Gummies Volume Share (%), by Application 2025 & 2033
- Figure 19: South America Energy Vitamin Gummies Revenue (undefined), by Type 2025 & 2033
- Figure 20: South America Energy Vitamin Gummies Volume (K), by Type 2025 & 2033
- Figure 21: South America Energy Vitamin Gummies Revenue Share (%), by Type 2025 & 2033
- Figure 22: South America Energy Vitamin Gummies Volume Share (%), by Type 2025 & 2033
- Figure 23: South America Energy Vitamin Gummies Revenue (undefined), by Country 2025 & 2033
- Figure 24: South America Energy Vitamin Gummies Volume (K), by Country 2025 & 2033
- Figure 25: South America Energy Vitamin Gummies Revenue Share (%), by Country 2025 & 2033
- Figure 26: South America Energy Vitamin Gummies Volume Share (%), by Country 2025 & 2033
- Figure 27: Europe Energy Vitamin Gummies Revenue (undefined), by Application 2025 & 2033
- Figure 28: Europe Energy Vitamin Gummies Volume (K), by Application 2025 & 2033
- Figure 29: Europe Energy Vitamin Gummies Revenue Share (%), by Application 2025 & 2033
- Figure 30: Europe Energy Vitamin Gummies Volume Share (%), by Application 2025 & 2033
- Figure 31: Europe Energy Vitamin Gummies Revenue (undefined), by Type 2025 & 2033
- Figure 32: Europe Energy Vitamin Gummies Volume (K), by Type 2025 & 2033
- Figure 33: Europe Energy Vitamin Gummies Revenue Share (%), by Type 2025 & 2033
- Figure 34: Europe Energy Vitamin Gummies Volume Share (%), by Type 2025 & 2033
- Figure 35: Europe Energy Vitamin Gummies Revenue (undefined), by Country 2025 & 2033
- Figure 36: Europe Energy Vitamin Gummies Volume (K), by Country 2025 & 2033
- Figure 37: Europe Energy Vitamin Gummies Revenue Share (%), by Country 2025 & 2033
- Figure 38: Europe Energy Vitamin Gummies Volume Share (%), by Country 2025 & 2033
- Figure 39: Middle East & Africa Energy Vitamin Gummies Revenue (undefined), by Application 2025 & 2033
- Figure 40: Middle East & Africa Energy Vitamin Gummies Volume (K), by Application 2025 & 2033
- Figure 41: Middle East & Africa Energy Vitamin Gummies Revenue Share (%), by Application 2025 & 2033
- Figure 42: Middle East & Africa Energy Vitamin Gummies Volume Share (%), by Application 2025 & 2033
- Figure 43: Middle East & Africa Energy Vitamin Gummies Revenue (undefined), by Type 2025 & 2033
- Figure 44: Middle East & Africa Energy Vitamin Gummies Volume (K), by Type 2025 & 2033
- Figure 45: Middle East & Africa Energy Vitamin Gummies Revenue Share (%), by Type 2025 & 2033
- Figure 46: Middle East & Africa Energy Vitamin Gummies Volume Share (%), by Type 2025 & 2033
- Figure 47: Middle East & Africa Energy Vitamin Gummies Revenue (undefined), by Country 2025 & 2033
- Figure 48: Middle East & Africa Energy Vitamin Gummies Volume (K), by Country 2025 & 2033
- Figure 49: Middle East & Africa Energy Vitamin Gummies Revenue Share (%), by Country 2025 & 2033
- Figure 50: Middle East & Africa Energy Vitamin Gummies Volume Share (%), by Country 2025 & 2033
- Figure 51: Asia Pacific Energy Vitamin Gummies Revenue (undefined), by Application 2025 & 2033
- Figure 52: Asia Pacific Energy Vitamin Gummies Volume (K), by Application 2025 & 2033
- Figure 53: Asia Pacific Energy Vitamin Gummies Revenue Share (%), by Application 2025 & 2033
- Figure 54: Asia Pacific Energy Vitamin Gummies Volume Share (%), by Application 2025 & 2033
- Figure 55: Asia Pacific Energy Vitamin Gummies Revenue (undefined), by Type 2025 & 2033
- Figure 56: Asia Pacific Energy Vitamin Gummies Volume (K), by Type 2025 & 2033
- Figure 57: Asia Pacific Energy Vitamin Gummies Revenue Share (%), by Type 2025 & 2033
- Figure 58: Asia Pacific Energy Vitamin Gummies Volume Share (%), by Type 2025 & 2033
- Figure 59: Asia Pacific Energy Vitamin Gummies Revenue (undefined), by Country 2025 & 2033
- Figure 60: Asia Pacific Energy Vitamin Gummies Volume (K), by Country 2025 & 2033
- Figure 61: Asia Pacific Energy Vitamin Gummies Revenue Share (%), by Country 2025 & 2033
- Figure 62: Asia Pacific Energy Vitamin Gummies Volume Share (%), by Country 2025 & 2033
List of Tables
- Table 1: Global Energy Vitamin Gummies Revenue undefined Forecast, by Application 2020 & 2033
- Table 2: Global Energy Vitamin Gummies Volume K Forecast, by Application 2020 & 2033
- Table 3: Global Energy Vitamin Gummies Revenue undefined Forecast, by Type 2020 & 2033
- Table 4: Global Energy Vitamin Gummies Volume K Forecast, by Type 2020 & 2033
- Table 5: Global Energy Vitamin Gummies Revenue undefined Forecast, by Region 2020 & 2033
- Table 6: Global Energy Vitamin Gummies Volume K Forecast, by Region 2020 & 2033
- Table 7: Global Energy Vitamin Gummies Revenue undefined Forecast, by Application 2020 & 2033
- Table 8: Global Energy Vitamin Gummies Volume K Forecast, by Application 2020 & 2033
- Table 9: Global Energy Vitamin Gummies Revenue undefined Forecast, by Type 2020 & 2033
- Table 10: Global Energy Vitamin Gummies Volume K Forecast, by Type 2020 & 2033
- Table 11: Global Energy Vitamin Gummies Revenue undefined Forecast, by Country 2020 & 2033
- Table 12: Global Energy Vitamin Gummies Volume K Forecast, by Country 2020 & 2033
- Table 13: United States Energy Vitamin Gummies Revenue (undefined) Forecast, by Application 2020 & 2033
- Table 14: United States Energy Vitamin Gummies Volume (K) Forecast, by Application 2020 & 2033
- Table 15: Canada Energy Vitamin Gummies Revenue (undefined) Forecast, by Application 2020 & 2033
- Table 16: Canada Energy Vitamin Gummies Volume (K) Forecast, by Application 2020 & 2033
- Table 17: Mexico Energy Vitamin Gummies Revenue (undefined) Forecast, by Application 2020 & 2033
- Table 18: Mexico Energy Vitamin Gummies Volume (K) Forecast, by Application 2020 & 2033
- Table 19: Global Energy Vitamin Gummies Revenue undefined Forecast, by Application 2020 & 2033
- Table 20: Global Energy Vitamin Gummies Volume K Forecast, by Application 2020 & 2033
- Table 21: Global Energy Vitamin Gummies Revenue undefined Forecast, by Type 2020 & 2033
- Table 22: Global Energy Vitamin Gummies Volume K Forecast, by Type 2020 & 2033
- Table 23: Global Energy Vitamin Gummies Revenue undefined Forecast, by Country 2020 & 2033
- Table 24: Global Energy Vitamin Gummies Volume K Forecast, by Country 2020 & 2033
- Table 25: Brazil Energy Vitamin Gummies Revenue (undefined) Forecast, by Application 2020 & 2033
- Table 26: Brazil Energy Vitamin Gummies Volume (K) Forecast, by Application 2020 & 2033
- Table 27: Argentina Energy Vitamin Gummies Revenue (undefined) Forecast, by Application 2020 & 2033
- Table 28: Argentina Energy Vitamin Gummies Volume (K) Forecast, by Application 2020 & 2033
- Table 29: Rest of South America Energy Vitamin Gummies Revenue (undefined) Forecast, by Application 2020 & 2033
- Table 30: Rest of South America Energy Vitamin Gummies Volume (K) Forecast, by Application 2020 & 2033
- Table 31: Global Energy Vitamin Gummies Revenue undefined Forecast, by Application 2020 & 2033
- Table 32: Global Energy Vitamin Gummies Volume K Forecast, by Application 2020 & 2033
- Table 33: Global Energy Vitamin Gummies Revenue undefined Forecast, by Type 2020 & 2033
- Table 34: Global Energy Vitamin Gummies Volume K Forecast, by Type 2020 & 2033
- Table 35: Global Energy Vitamin Gummies Revenue undefined Forecast, by Country 2020 & 2033
- Table 36: Global Energy Vitamin Gummies Volume K Forecast, by Country 2020 & 2033
- Table 37: United Kingdom Energy Vitamin Gummies Revenue (undefined) Forecast, by Application 2020 & 2033
- Table 38: United Kingdom Energy Vitamin Gummies Volume (K) Forecast, by Application 2020 & 2033
- Table 39: Germany Energy Vitamin Gummies Revenue (undefined) Forecast, by Application 2020 & 2033
- Table 40: Germany Energy Vitamin Gummies Volume (K) Forecast, by Application 2020 & 2033
- Table 41: France Energy Vitamin Gummies Revenue (undefined) Forecast, by Application 2020 & 2033
- Table 42: France Energy Vitamin Gummies Volume (K) Forecast, by Application 2020 & 2033
- Table 43: Italy Energy Vitamin Gummies Revenue (undefined) Forecast, by Application 2020 & 2033
- Table 44: Italy Energy Vitamin Gummies Volume (K) Forecast, by Application 2020 & 2033
- Table 45: Spain Energy Vitamin Gummies Revenue (undefined) Forecast, by Application 2020 & 2033
- Table 46: Spain Energy Vitamin Gummies Volume (K) Forecast, by Application 2020 & 2033
- Table 47: Russia Energy Vitamin Gummies Revenue (undefined) Forecast, by Application 2020 & 2033
- Table 48: Russia Energy Vitamin Gummies Volume (K) Forecast, by Application 2020 & 2033
- Table 49: Benelux Energy Vitamin Gummies Revenue (undefined) Forecast, by Application 2020 & 2033
- Table 50: Benelux Energy Vitamin Gummies Volume (K) Forecast, by Application 2020 & 2033
- Table 51: Nordics Energy Vitamin Gummies Revenue (undefined) Forecast, by Application 2020 & 2033
- Table 52: Nordics Energy Vitamin Gummies Volume (K) Forecast, by Application 2020 & 2033
- Table 53: Rest of Europe Energy Vitamin Gummies Revenue (undefined) Forecast, by Application 2020 & 2033
- Table 54: Rest of Europe Energy Vitamin Gummies Volume (K) Forecast, by Application 2020 & 2033
- Table 55: Global Energy Vitamin Gummies Revenue undefined Forecast, by Application 2020 & 2033
- Table 56: Global Energy Vitamin Gummies Volume K Forecast, by Application 2020 & 2033
- Table 57: Global Energy Vitamin Gummies Revenue undefined Forecast, by Type 2020 & 2033
- Table 58: Global Energy Vitamin Gummies Volume K Forecast, by Type 2020 & 2033
- Table 59: Global Energy Vitamin Gummies Revenue undefined Forecast, by Country 2020 & 2033
- Table 60: Global Energy Vitamin Gummies Volume K Forecast, by Country 2020 & 2033
- Table 61: Turkey Energy Vitamin Gummies Revenue (undefined) Forecast, by Application 2020 & 2033
- Table 62: Turkey Energy Vitamin Gummies Volume (K) Forecast, by Application 2020 & 2033
- Table 63: Israel Energy Vitamin Gummies Revenue (undefined) Forecast, by Application 2020 & 2033
- Table 64: Israel Energy Vitamin Gummies Volume (K) Forecast, by Application 2020 & 2033
- Table 65: GCC Energy Vitamin Gummies Revenue (undefined) Forecast, by Application 2020 & 2033
- Table 66: GCC Energy Vitamin Gummies Volume (K) Forecast, by Application 2020 & 2033
- Table 67: North Africa Energy Vitamin Gummies Revenue (undefined) Forecast, by Application 2020 & 2033
- Table 68: North Africa Energy Vitamin Gummies Volume (K) Forecast, by Application 2020 & 2033
- Table 69: South Africa Energy Vitamin Gummies Revenue (undefined) Forecast, by Application 2020 & 2033
- Table 70: South Africa Energy Vitamin Gummies Volume (K) Forecast, by Application 2020 & 2033
- Table 71: Rest of Middle East & Africa Energy Vitamin Gummies Revenue (undefined) Forecast, by Application 2020 & 2033
- Table 72: Rest of Middle East & Africa Energy Vitamin Gummies Volume (K) Forecast, by Application 2020 & 2033
- Table 73: Global Energy Vitamin Gummies Revenue undefined Forecast, by Application 2020 & 2033
- Table 74: Global Energy Vitamin Gummies Volume K Forecast, by Application 2020 & 2033
- Table 75: Global Energy Vitamin Gummies Revenue undefined Forecast, by Type 2020 & 2033
- Table 76: Global Energy Vitamin Gummies Volume K Forecast, by Type 2020 & 2033
- Table 77: Global Energy Vitamin Gummies Revenue undefined Forecast, by Country 2020 & 2033
- Table 78: Global Energy Vitamin Gummies Volume K Forecast, by Country 2020 & 2033
- Table 79: China Energy Vitamin Gummies Revenue (undefined) Forecast, by Application 2020 & 2033
- Table 80: China Energy Vitamin Gummies Volume (K) Forecast, by Application 2020 & 2033
- Table 81: India Energy Vitamin Gummies Revenue (undefined) Forecast, by Application 2020 & 2033
- Table 82: India Energy Vitamin Gummies Volume (K) Forecast, by Application 2020 & 2033
- Table 83: Japan Energy Vitamin Gummies Revenue (undefined) Forecast, by Application 2020 & 2033
- Table 84: Japan Energy Vitamin Gummies Volume (K) Forecast, by Application 2020 & 2033
- Table 85: South Korea Energy Vitamin Gummies Revenue (undefined) Forecast, by Application 2020 & 2033
- Table 86: South Korea Energy Vitamin Gummies Volume (K) Forecast, by Application 2020 & 2033
- Table 87: ASEAN Energy Vitamin Gummies Revenue (undefined) Forecast, by Application 2020 & 2033
- Table 88: ASEAN Energy Vitamin Gummies Volume (K) Forecast, by Application 2020 & 2033
- Table 89: Oceania Energy Vitamin Gummies Revenue (undefined) Forecast, by Application 2020 & 2033
- Table 90: Oceania Energy Vitamin Gummies Volume (K) Forecast, by Application 2020 & 2033
- Table 91: Rest of Asia Pacific Energy Vitamin Gummies Revenue (undefined) Forecast, by Application 2020 & 2033
- Table 92: Rest of Asia Pacific Energy Vitamin Gummies Volume (K) Forecast, by Application 2020 & 2033
Frequently Asked Questions
1. What is the projected Compound Annual Growth Rate (CAGR) of the Energy Vitamin Gummies?
The projected CAGR is approximately 6.57%.
2. Which companies are prominent players in the Energy Vitamin Gummies?
Key companies in the market include Honey Stinger, GU Energy, Science In Sport, Clif Bar, Skratch Labs, Seattle Gummy Company, Alete Active Nutrition, Enervit, PROBAR, Chia Charge, Torq, Precision Hydration, Gatorade, HIGH5, Muscle MX.
3. What are the main segments of the Energy Vitamin Gummies?
The market segments include Application, Type.
4. Can you provide details about the market size?
The market size is estimated to be USD XXX N/A as of 2022.
5. What are some drivers contributing to market growth?
N/A
6. What are the notable trends driving market growth?
N/A
7. Are there any restraints impacting market growth?
N/A
8. Can you provide examples of recent developments in the market?
N/A
9. What pricing options are available for accessing the report?
Pricing options include single-user, multi-user, and enterprise licenses priced at USD 3950.00, USD 5925.00, and USD 7900.00 respectively.
10. Is the market size provided in terms of value or volume?
The market size is provided in terms of value, measured in N/A and volume, measured in K.
11. Are there any specific market keywords associated with the report?
Yes, the market keyword associated with the report is "Energy Vitamin Gummies," which aids in identifying and referencing the specific market segment covered.
12. How do I determine which pricing option suits my needs best?
The pricing options vary based on user requirements and access needs. Individual users may opt for single-user licenses, while businesses requiring broader access may choose multi-user or enterprise licenses for cost-effective access to the report.
13. Are there any additional resources or data provided in the Energy Vitamin Gummies report?
While the report offers comprehensive insights, it's advisable to review the specific contents or supplementary materials provided to ascertain if additional resources or data are available.
14. How can I stay updated on further developments or reports in the Energy Vitamin Gummies?
To stay informed about further developments, trends, and reports in the Energy Vitamin Gummies, consider subscribing to industry newsletters, following relevant companies and organizations, or regularly checking reputable industry news sources and publications.
Methodology
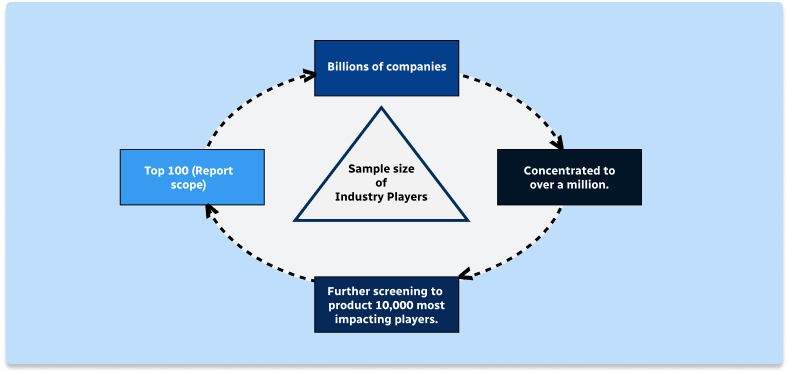
Step 1 - Identification of Relevant Samples Size from Population Database

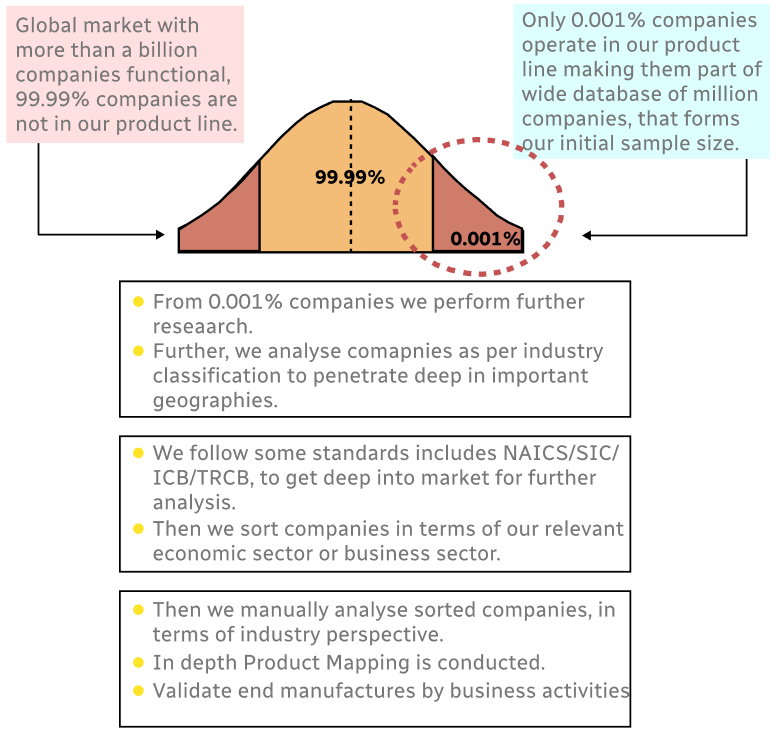
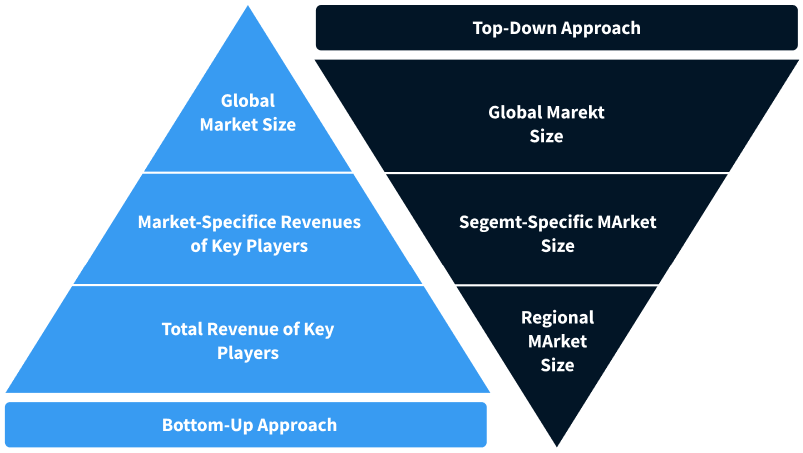
Step 2 - Approaches for Defining Global Market Size (Value, Volume* & Price*)
Note*: In applicable scenarios
Step 3 - Data Sources
Primary Research
- Web Analytics
- Survey Reports
- Research Institute
- Latest Research Reports
- Opinion Leaders
Secondary Research
- Annual Reports
- White Paper
- Latest Press Release
- Industry Association
- Paid Database
- Investor Presentations
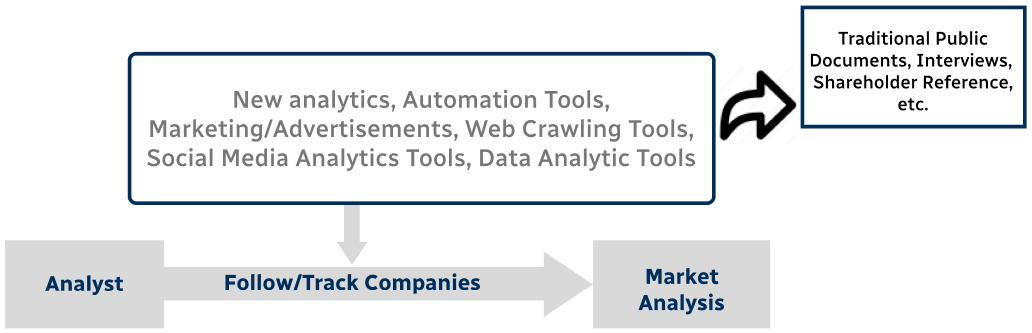
Step 4 - Data Triangulation
Involves using different sources of information in order to increase the validity of a study
These sources are likely to be stakeholders in a program - participants, other researchers, program staff, other community members, and so on.
Then we put all data in single framework & apply various statistical tools to find out the dynamic on the market.
During the analysis stage, feedback from the stakeholder groups would be compared to determine areas of agreement as well as areas of divergence