

Key Insights
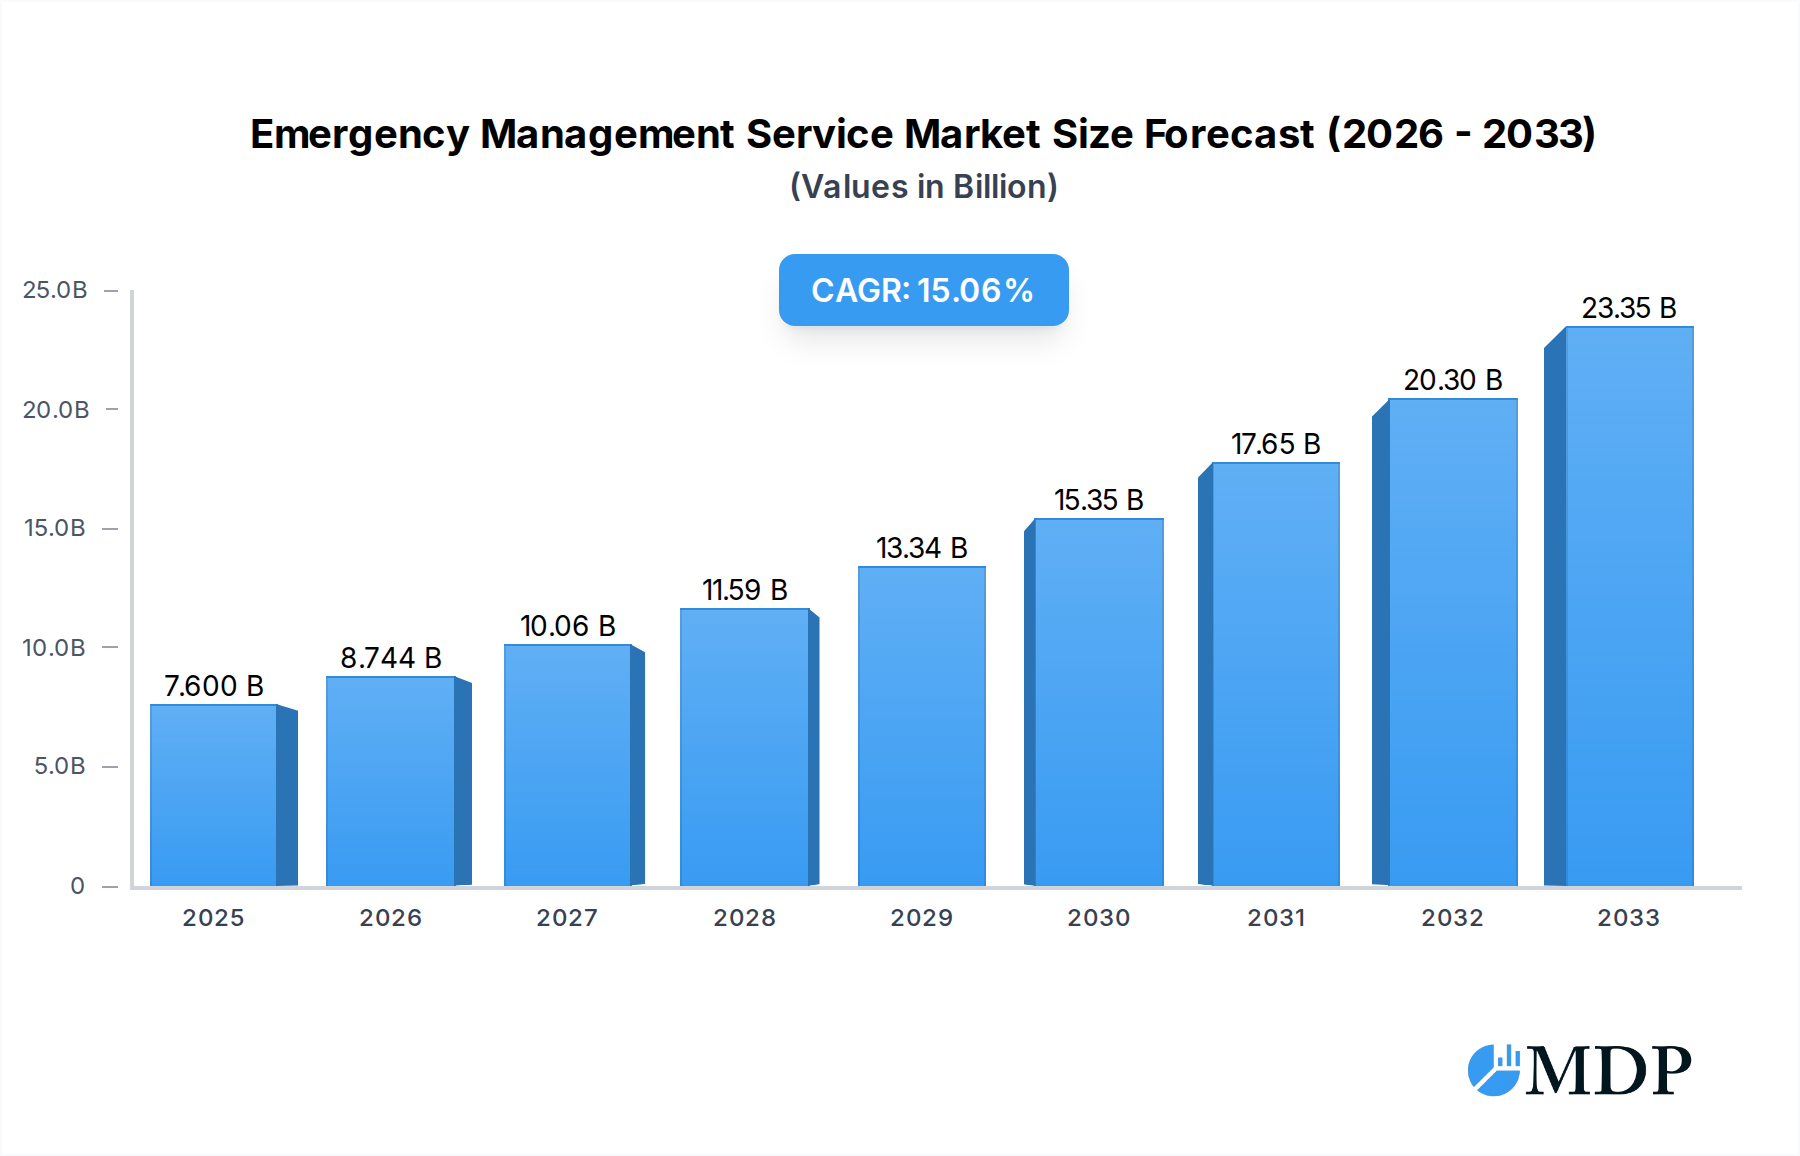
The global Emergency Management Service market is poised for significant expansion, projected to reach $7.6 billion by 2025. This robust growth is propelled by a compelling CAGR of 15.01% over the forecast period of 2025-2033. A primary driver for this surge is the escalating frequency and intensity of natural disasters, including hurricanes, floods, wildfires, and pandemics, which necessitate sophisticated and rapid response mechanisms. Government agencies are increasingly investing in advanced emergency preparedness and response systems to safeguard citizens and critical infrastructure. Furthermore, the growing awareness and implementation of public-private partnerships are fostering greater collaboration and resource pooling, thereby enhancing the overall effectiveness of emergency management efforts. The demand for specialized consulting services to develop comprehensive disaster plans, conduct risk assessments, and implement mitigation strategies is also a significant contributor to market growth.

Emergency Management Service Market Size (In Billion)
The market's trajectory is further shaped by evolving technological advancements, such as the integration of AI-powered predictive analytics for early warning systems, drone technology for damage assessment and search and rescue operations, and cloud-based platforms for real-time situational awareness and communication. These innovations are transforming the landscape of emergency management, enabling more proactive and efficient responses. However, challenges such as budget constraints for some public entities and the complexity of coordinating diverse stakeholders can present hurdles. Nevertheless, the increasing emphasis on resilience building, coupled with favorable regulatory frameworks and a rising demand for training and simulation services to ensure preparedness, will continue to fuel sustained market expansion across various applications and service types. The market is segmented across Government, Private Sector, and Others, with Consulting Services, Emergency Operation Services, and Training and Simulation Services emerging as key growth areas.
Emergency Management Service Company Market Share
Emergency Management Service Market Report: A Comprehensive Analysis (2019-2033)
This in-depth report provides a critical analysis of the global Emergency Management Service market, a sector vital for ensuring public safety, business continuity, and disaster resilience. With a study period spanning from 2019 to 2033, the report leverages historical data from 2019–2024 and forecasts future trends from the base year of 2025 through 2033. Our comprehensive research delves into market dynamics, key trends, leading players, and strategic opportunities within this evolving landscape, offering actionable insights for industry stakeholders, including government agencies, private sector organizations, and technology providers. This report is estimated to be valued at over one billion dollars.
Emergency Management Service Market Dynamics & Concentration
The Emergency Management Service market exhibits a moderate to high concentration, with a few dominant players holding significant market share. In 2025, the estimated market share of the top five companies is projected to exceed fifty billion dollars. Innovation drivers are primarily fueled by advancements in technology, including AI-powered predictive analytics, sophisticated communication platforms, and integrated command and control systems. Regulatory frameworks, such as FEMA's National Incident Management System (NIMS) in the United States and similar mandates globally, are crucial in shaping service offerings and ensuring standardization. The threat of natural disasters and complex emergencies continues to drive demand, while advancements in cloud computing and IoT are creating new product substitutes, offering more agile and scalable solutions. End-user trends point towards a greater emphasis on proactive risk assessment, enhanced preparedness, and efficient response coordination. Merger and acquisition (M&A) activities are expected to remain robust, with over twenty billion dollars in deal value anticipated between 2025 and 2033 as larger firms seek to consolidate market position and acquire specialized capabilities.
Emergency Management Service Industry Trends & Analysis
The Emergency Management Service industry is experiencing robust growth, driven by an escalating frequency and severity of natural and man-made disasters. The global market is projected to witness a Compound Annual Growth Rate (CAGR) of approximately seven percent from 2025 to 2033, reaching an estimated value exceeding two hundred billion dollars by the end of the forecast period. Technological disruptions are at the forefront of this growth, with the integration of artificial intelligence (AI) for predictive modeling of disaster impact, drone technology for real-time situational awareness and damage assessment, and the Internet of Things (IoT) for early warning systems and infrastructure monitoring. Consumer preferences are shifting towards integrated, end-to-end solutions that encompass preparedness, response, and recovery. This includes a demand for real-time data analytics, seamless communication across multiple agencies and stakeholders, and robust public information dissemination capabilities. Competitive dynamics are intensifying, with established providers investing heavily in R&D to enhance their digital offerings, while new entrants are emerging with specialized, niche solutions. Market penetration is steadily increasing across both the government and private sectors as organizations recognize the critical importance of comprehensive emergency management strategies.
Leading Markets & Segments in Emergency Management Service
The Government application segment is the dominant force within the Emergency Management Service market, projected to account for over sixty percent of the global market share by 2025, valued at over one hundred twenty billion dollars. This dominance is fueled by significant public sector investment in national security, disaster relief, and public safety infrastructure. Key drivers include stringent regulatory mandates for preparedness and response, increased funding for homeland security initiatives following major global events, and the inherent responsibility of governments to protect their citizens.
Within the Types of services, Consulting Services are a significant segment, valued at over fifty billion dollars in 2025, driven by the need for expert guidance in developing comprehensive emergency plans, conducting risk assessments, and implementing best practices. However, Emergency Operation Services are experiencing rapid expansion, with a projected market size exceeding seventy billion dollars by 2025, as organizations seek efficient and technologically advanced solutions for real-time incident management and response coordination.
The Private Sector is also a crucial and growing segment, driven by business continuity planning, supply chain resilience, and the increasing focus on corporate social responsibility in disaster preparedness. The Others segment, encompassing non-governmental organizations and international bodies, also contributes to market growth through their vital roles in humanitarian aid and global disaster response coordination.
Emergency Management Service Product Developments
Recent product developments in the Emergency Management Service market are heavily influenced by advancements in AI, IoT, and cloud computing. Companies are focusing on integrated platforms that offer predictive analytics for disaster forecasting, real-time monitoring of critical infrastructure, and automated communication systems for public alerts and emergency personnel coordination. Innovations include AI-driven sentiment analysis of social media for early threat detection, drone deployment for rapid damage assessment, and sophisticated simulation tools for training exercises. These developments aim to enhance situational awareness, optimize resource allocation, and improve response times, providing a significant competitive advantage in a market prioritizing efficiency and resilience.
Key Drivers of Emergency Management Service Growth
The Emergency Management Service market is propelled by several key drivers. Technological advancements, such as AI for predictive analytics and IoT for real-time monitoring, are revolutionizing preparedness and response capabilities, leading to an estimated fifty billion dollar investment in these areas by 2025. Increasing global threats, including the escalating frequency of extreme weather events and the persistent risk of pandemics, necessitate robust emergency management frameworks, driving market expansion by over forty billion dollars annually. Government mandates and funding, such as national preparedness initiatives and homeland security budgets, provide a stable revenue stream and encourage the adoption of advanced services, contributing an additional thirty billion dollars in demand. Furthermore, growing awareness of business continuity and resilience among private sector organizations is fostering a proactive approach to risk management.
Challenges in the Emergency Management Service Market
Despite significant growth, the Emergency Management Service market faces several challenges. High initial investment costs for sophisticated technology and infrastructure can be a barrier for some organizations, potentially limiting adoption and impacting the market by an estimated twenty billion dollars in lost opportunities annually. Regulatory complexities and interoperability issues across different jurisdictions and agencies can hinder seamless coordination and data sharing, creating an estimated fifteen billion dollar inefficiency. Data security and privacy concerns are paramount, especially with the increasing reliance on digital platforms, requiring substantial investment in cybersecurity measures. Furthermore, shortage of skilled personnel trained in advanced emergency management technologies presents a human capital challenge, potentially impacting service delivery.
Emerging Opportunities in Emergency Management Service
Emerging opportunities in the Emergency Management Service market are vast and largely driven by technological innovation and evolving global needs. The widespread adoption of AI and machine learning presents significant opportunities for developing more accurate predictive models for disaster impact assessment and resource allocation, potentially unlocking an additional thirty billion dollar market segment. Strategic partnerships between technology providers and established emergency management firms can foster the development of integrated, end-to-end solutions, creating synergy and market expansion valued at over twenty billion dollars. Furthermore, the increasing focus on climate change resilience and adaptation strategies opens avenues for specialized consulting and technology services aimed at mitigating the impact of extreme weather events, estimated to grow by fifteen billion dollars. Expansion into underserved markets and the development of scalable, cloud-based solutions will also be critical growth catalysts.
Leading Players in the Emergency Management Service Sector
- IBM Corporation
- Atos SE
- West Central Environmental Consultants
- Dewberry
- Dynamiq Pty Ltd.
- Hss Inc.
- Hexagon Ab
- Honeywell International Inc.
- Willdan Group, Inc.
- Hagerty Consulting
- Witt O’ Brien (Seacor Holdings Inc.)
- Obsidian Analytics (Cadmus Group)
- Tetra Tech, Inc.
- ICF International, Inc.
- Battelle National Biodefense Institute
- Science Applications International Corporation (Saic)
- Leidos Holdings, Inc.
Key Milestones in Emergency Management Service Industry
- 2019: Increased adoption of AI for predictive disaster modeling.
- 2020: Global COVID-19 pandemic accelerated investment in public health emergency response services, valued at over fifty billion dollars.
- 2021: Significant advancements in drone technology for disaster assessment and reconnaissance.
- 2022: Growing focus on cybersecurity for critical infrastructure protection in emergency management.
- 2023: Expansion of cloud-based emergency management platforms to enhance scalability and accessibility.
- 2024: Growing integration of IoT devices for early warning systems and real-time data collection.
Strategic Outlook for Emergency Management Service Market
The strategic outlook for the Emergency Management Service market is exceptionally positive, driven by an unwavering demand for enhanced resilience and preparedness. Key growth accelerators include the continued integration of advanced technologies like AI, IoT, and sophisticated data analytics, which are expected to drive over fifty billion dollars in new service development. Strategic partnerships and M&A activities will continue to shape the competitive landscape, fostering consolidation and the creation of comprehensive solution providers. The increasing recognition of climate change impacts will fuel demand for specialized resilience and adaptation services, representing a market expansion opportunity valued at over thirty billion dollars. Furthermore, the ongoing evolution of regulatory frameworks and government investment in national security and public safety will provide a stable foundation for sustained market growth and innovation.
Emergency Management Service Segmentation
-
1. Application
- 1.1. Government
- 1.2. Private Sector
- 1.3. Others
-
2. Types
- 2.1. Consulting Services
- 2.2. Emergency Operation Services
- 2.3. Training and Simulation Services
- 2.4. Public Information Services
Emergency Management Service Segmentation By Geography
-
1. North America
- 1.1. United States
- 1.2. Canada
- 1.3. Mexico
-
2. South America
- 2.1. Brazil
- 2.2. Argentina
- 2.3. Rest of South America
-
3. Europe
- 3.1. United Kingdom
- 3.2. Germany
- 3.3. France
- 3.4. Italy
- 3.5. Spain
- 3.6. Russia
- 3.7. Benelux
- 3.8. Nordics
- 3.9. Rest of Europe
-
4. Middle East & Africa
- 4.1. Turkey
- 4.2. Israel
- 4.3. GCC
- 4.4. North Africa
- 4.5. South Africa
- 4.6. Rest of Middle East & Africa
-
5. Asia Pacific
- 5.1. China
- 5.2. India
- 5.3. Japan
- 5.4. South Korea
- 5.5. ASEAN
- 5.6. Oceania
- 5.7. Rest of Asia Pacific
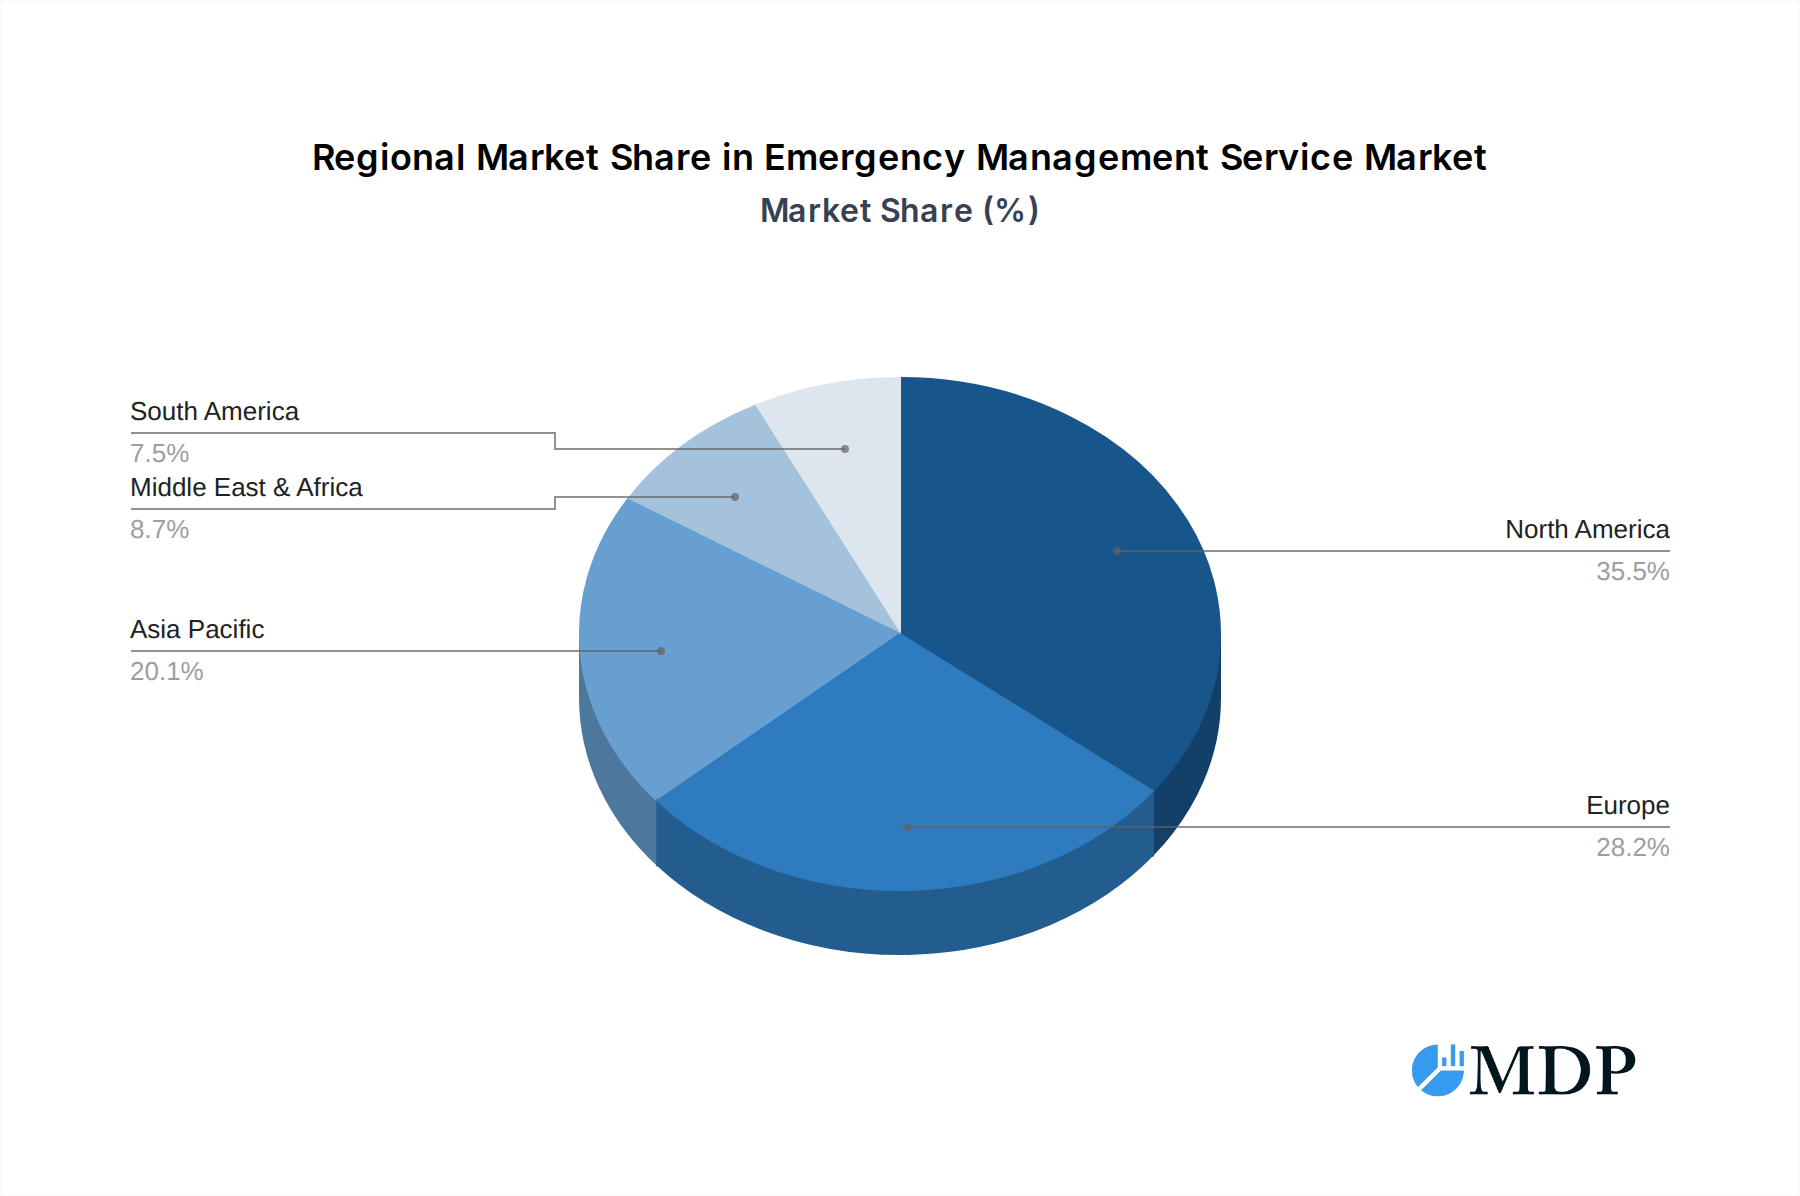
Emergency Management Service Regional Market Share
Geographic Coverage of Emergency Management Service
Emergency Management Service REPORT HIGHLIGHTS
| Aspects | Details |
|---|---|
| Study Period | 2020-2034 |
| Base Year | 2025 |
| Estimated Year | 2026 |
| Forecast Period | 2026-2034 |
| Historical Period | 2020-2025 |
| Growth Rate | CAGR of 15.01% from 2020-2034 |
| Segmentation |
|
Table of Contents
- 1. Introduction
- 1.1. Research Scope
- 1.2. Market Segmentation
- 1.3. Research Methodology
- 1.4. Definitions and Assumptions
- 2. Executive Summary
- 2.1. Introduction
- 3. Market Dynamics
- 3.1. Introduction
- 3.2. Market Drivers
- 3.3. Market Restrains
- 3.4. Market Trends
- 4. Market Factor Analysis
- 4.1. Porters Five Forces
- 4.2. Supply/Value Chain
- 4.3. PESTEL analysis
- 4.4. Market Entropy
- 4.5. Patent/Trademark Analysis
- 5. Global Emergency Management Service Analysis, Insights and Forecast, 2020-2032
- 5.1. Market Analysis, Insights and Forecast - by Application
- 5.1.1. Government
- 5.1.2. Private Sector
- 5.1.3. Others
- 5.2. Market Analysis, Insights and Forecast - by Types
- 5.2.1. Consulting Services
- 5.2.2. Emergency Operation Services
- 5.2.3. Training and Simulation Services
- 5.2.4. Public Information Services
- 5.3. Market Analysis, Insights and Forecast - by Region
- 5.3.1. North America
- 5.3.2. South America
- 5.3.3. Europe
- 5.3.4. Middle East & Africa
- 5.3.5. Asia Pacific
- 5.1. Market Analysis, Insights and Forecast - by Application
- 6. North America Emergency Management Service Analysis, Insights and Forecast, 2020-2032
- 6.1. Market Analysis, Insights and Forecast - by Application
- 6.1.1. Government
- 6.1.2. Private Sector
- 6.1.3. Others
- 6.2. Market Analysis, Insights and Forecast - by Types
- 6.2.1. Consulting Services
- 6.2.2. Emergency Operation Services
- 6.2.3. Training and Simulation Services
- 6.2.4. Public Information Services
- 6.1. Market Analysis, Insights and Forecast - by Application
- 7. South America Emergency Management Service Analysis, Insights and Forecast, 2020-2032
- 7.1. Market Analysis, Insights and Forecast - by Application
- 7.1.1. Government
- 7.1.2. Private Sector
- 7.1.3. Others
- 7.2. Market Analysis, Insights and Forecast - by Types
- 7.2.1. Consulting Services
- 7.2.2. Emergency Operation Services
- 7.2.3. Training and Simulation Services
- 7.2.4. Public Information Services
- 7.1. Market Analysis, Insights and Forecast - by Application
- 8. Europe Emergency Management Service Analysis, Insights and Forecast, 2020-2032
- 8.1. Market Analysis, Insights and Forecast - by Application
- 8.1.1. Government
- 8.1.2. Private Sector
- 8.1.3. Others
- 8.2. Market Analysis, Insights and Forecast - by Types
- 8.2.1. Consulting Services
- 8.2.2. Emergency Operation Services
- 8.2.3. Training and Simulation Services
- 8.2.4. Public Information Services
- 8.1. Market Analysis, Insights and Forecast - by Application
- 9. Middle East & Africa Emergency Management Service Analysis, Insights and Forecast, 2020-2032
- 9.1. Market Analysis, Insights and Forecast - by Application
- 9.1.1. Government
- 9.1.2. Private Sector
- 9.1.3. Others
- 9.2. Market Analysis, Insights and Forecast - by Types
- 9.2.1. Consulting Services
- 9.2.2. Emergency Operation Services
- 9.2.3. Training and Simulation Services
- 9.2.4. Public Information Services
- 9.1. Market Analysis, Insights and Forecast - by Application
- 10. Asia Pacific Emergency Management Service Analysis, Insights and Forecast, 2020-2032
- 10.1. Market Analysis, Insights and Forecast - by Application
- 10.1.1. Government
- 10.1.2. Private Sector
- 10.1.3. Others
- 10.2. Market Analysis, Insights and Forecast - by Types
- 10.2.1. Consulting Services
- 10.2.2. Emergency Operation Services
- 10.2.3. Training and Simulation Services
- 10.2.4. Public Information Services
- 10.1. Market Analysis, Insights and Forecast - by Application
- 11. Competitive Analysis
- 11.1. Global Market Share Analysis 2025
- 11.2. Company Profiles
- 11.2.1 IBM Corporation
- 11.2.1.1. Overview
- 11.2.1.2. Products
- 11.2.1.3. SWOT Analysis
- 11.2.1.4. Recent Developments
- 11.2.1.5. Financials (Based on Availability)
- 11.2.2 Atos SE
- 11.2.2.1. Overview
- 11.2.2.2. Products
- 11.2.2.3. SWOT Analysis
- 11.2.2.4. Recent Developments
- 11.2.2.5. Financials (Based on Availability)
- 11.2.3 West Central Environmental Consultants
- 11.2.3.1. Overview
- 11.2.3.2. Products
- 11.2.3.3. SWOT Analysis
- 11.2.3.4. Recent Developments
- 11.2.3.5. Financials (Based on Availability)
- 11.2.4 Dewberry
- 11.2.4.1. Overview
- 11.2.4.2. Products
- 11.2.4.3. SWOT Analysis
- 11.2.4.4. Recent Developments
- 11.2.4.5. Financials (Based on Availability)
- 11.2.5 Dynamiq Pty Ltd.
- 11.2.5.1. Overview
- 11.2.5.2. Products
- 11.2.5.3. SWOT Analysis
- 11.2.5.4. Recent Developments
- 11.2.5.5. Financials (Based on Availability)
- 11.2.6 Hss Inc.
- 11.2.6.1. Overview
- 11.2.6.2. Products
- 11.2.6.3. SWOT Analysis
- 11.2.6.4. Recent Developments
- 11.2.6.5. Financials (Based on Availability)
- 11.2.7 Hexagon Ab
- 11.2.7.1. Overview
- 11.2.7.2. Products
- 11.2.7.3. SWOT Analysis
- 11.2.7.4. Recent Developments
- 11.2.7.5. Financials (Based on Availability)
- 11.2.8 Honeywell International Inc.
- 11.2.8.1. Overview
- 11.2.8.2. Products
- 11.2.8.3. SWOT Analysis
- 11.2.8.4. Recent Developments
- 11.2.8.5. Financials (Based on Availability)
- 11.2.9 Willdan Group
- 11.2.9.1. Overview
- 11.2.9.2. Products
- 11.2.9.3. SWOT Analysis
- 11.2.9.4. Recent Developments
- 11.2.9.5. Financials (Based on Availability)
- 11.2.10 Inc.
- 11.2.10.1. Overview
- 11.2.10.2. Products
- 11.2.10.3. SWOT Analysis
- 11.2.10.4. Recent Developments
- 11.2.10.5. Financials (Based on Availability)
- 11.2.11 Hagerty Consulting
- 11.2.11.1. Overview
- 11.2.11.2. Products
- 11.2.11.3. SWOT Analysis
- 11.2.11.4. Recent Developments
- 11.2.11.5. Financials (Based on Availability)
- 11.2.12 Witt O’ Brien (Seacor Holdings Inc.)
- 11.2.12.1. Overview
- 11.2.12.2. Products
- 11.2.12.3. SWOT Analysis
- 11.2.12.4. Recent Developments
- 11.2.12.5. Financials (Based on Availability)
- 11.2.13 Obsidian Analytics (Cadmus Group)
- 11.2.13.1. Overview
- 11.2.13.2. Products
- 11.2.13.3. SWOT Analysis
- 11.2.13.4. Recent Developments
- 11.2.13.5. Financials (Based on Availability)
- 11.2.14 Tetra Tech
- 11.2.14.1. Overview
- 11.2.14.2. Products
- 11.2.14.3. SWOT Analysis
- 11.2.14.4. Recent Developments
- 11.2.14.5. Financials (Based on Availability)
- 11.2.15 Inc.
- 11.2.15.1. Overview
- 11.2.15.2. Products
- 11.2.15.3. SWOT Analysis
- 11.2.15.4. Recent Developments
- 11.2.15.5. Financials (Based on Availability)
- 11.2.16 ICF International
- 11.2.16.1. Overview
- 11.2.16.2. Products
- 11.2.16.3. SWOT Analysis
- 11.2.16.4. Recent Developments
- 11.2.16.5. Financials (Based on Availability)
- 11.2.17 Inc.
- 11.2.17.1. Overview
- 11.2.17.2. Products
- 11.2.17.3. SWOT Analysis
- 11.2.17.4. Recent Developments
- 11.2.17.5. Financials (Based on Availability)
- 11.2.18 Battelle National Biodefense Institute
- 11.2.18.1. Overview
- 11.2.18.2. Products
- 11.2.18.3. SWOT Analysis
- 11.2.18.4. Recent Developments
- 11.2.18.5. Financials (Based on Availability)
- 11.2.19 Science Applications International Corporation (Saic)
- 11.2.19.1. Overview
- 11.2.19.2. Products
- 11.2.19.3. SWOT Analysis
- 11.2.19.4. Recent Developments
- 11.2.19.5. Financials (Based on Availability)
- 11.2.20 Leidos Holdings
- 11.2.20.1. Overview
- 11.2.20.2. Products
- 11.2.20.3. SWOT Analysis
- 11.2.20.4. Recent Developments
- 11.2.20.5. Financials (Based on Availability)
- 11.2.21 Inc.
- 11.2.21.1. Overview
- 11.2.21.2. Products
- 11.2.21.3. SWOT Analysis
- 11.2.21.4. Recent Developments
- 11.2.21.5. Financials (Based on Availability)
- 11.2.1 IBM Corporation
List of Figures
- Figure 1: Global Emergency Management Service Revenue Breakdown (undefined, %) by Region 2025 & 2033
- Figure 2: North America Emergency Management Service Revenue (undefined), by Application 2025 & 2033
- Figure 3: North America Emergency Management Service Revenue Share (%), by Application 2025 & 2033
- Figure 4: North America Emergency Management Service Revenue (undefined), by Types 2025 & 2033
- Figure 5: North America Emergency Management Service Revenue Share (%), by Types 2025 & 2033
- Figure 6: North America Emergency Management Service Revenue (undefined), by Country 2025 & 2033
- Figure 7: North America Emergency Management Service Revenue Share (%), by Country 2025 & 2033
- Figure 8: South America Emergency Management Service Revenue (undefined), by Application 2025 & 2033
- Figure 9: South America Emergency Management Service Revenue Share (%), by Application 2025 & 2033
- Figure 10: South America Emergency Management Service Revenue (undefined), by Types 2025 & 2033
- Figure 11: South America Emergency Management Service Revenue Share (%), by Types 2025 & 2033
- Figure 12: South America Emergency Management Service Revenue (undefined), by Country 2025 & 2033
- Figure 13: South America Emergency Management Service Revenue Share (%), by Country 2025 & 2033
- Figure 14: Europe Emergency Management Service Revenue (undefined), by Application 2025 & 2033
- Figure 15: Europe Emergency Management Service Revenue Share (%), by Application 2025 & 2033
- Figure 16: Europe Emergency Management Service Revenue (undefined), by Types 2025 & 2033
- Figure 17: Europe Emergency Management Service Revenue Share (%), by Types 2025 & 2033
- Figure 18: Europe Emergency Management Service Revenue (undefined), by Country 2025 & 2033
- Figure 19: Europe Emergency Management Service Revenue Share (%), by Country 2025 & 2033
- Figure 20: Middle East & Africa Emergency Management Service Revenue (undefined), by Application 2025 & 2033
- Figure 21: Middle East & Africa Emergency Management Service Revenue Share (%), by Application 2025 & 2033
- Figure 22: Middle East & Africa Emergency Management Service Revenue (undefined), by Types 2025 & 2033
- Figure 23: Middle East & Africa Emergency Management Service Revenue Share (%), by Types 2025 & 2033
- Figure 24: Middle East & Africa Emergency Management Service Revenue (undefined), by Country 2025 & 2033
- Figure 25: Middle East & Africa Emergency Management Service Revenue Share (%), by Country 2025 & 2033
- Figure 26: Asia Pacific Emergency Management Service Revenue (undefined), by Application 2025 & 2033
- Figure 27: Asia Pacific Emergency Management Service Revenue Share (%), by Application 2025 & 2033
- Figure 28: Asia Pacific Emergency Management Service Revenue (undefined), by Types 2025 & 2033
- Figure 29: Asia Pacific Emergency Management Service Revenue Share (%), by Types 2025 & 2033
- Figure 30: Asia Pacific Emergency Management Service Revenue (undefined), by Country 2025 & 2033
- Figure 31: Asia Pacific Emergency Management Service Revenue Share (%), by Country 2025 & 2033
List of Tables
- Table 1: Global Emergency Management Service Revenue undefined Forecast, by Application 2020 & 2033
- Table 2: Global Emergency Management Service Revenue undefined Forecast, by Types 2020 & 2033
- Table 3: Global Emergency Management Service Revenue undefined Forecast, by Region 2020 & 2033
- Table 4: Global Emergency Management Service Revenue undefined Forecast, by Application 2020 & 2033
- Table 5: Global Emergency Management Service Revenue undefined Forecast, by Types 2020 & 2033
- Table 6: Global Emergency Management Service Revenue undefined Forecast, by Country 2020 & 2033
- Table 7: United States Emergency Management Service Revenue (undefined) Forecast, by Application 2020 & 2033
- Table 8: Canada Emergency Management Service Revenue (undefined) Forecast, by Application 2020 & 2033
- Table 9: Mexico Emergency Management Service Revenue (undefined) Forecast, by Application 2020 & 2033
- Table 10: Global Emergency Management Service Revenue undefined Forecast, by Application 2020 & 2033
- Table 11: Global Emergency Management Service Revenue undefined Forecast, by Types 2020 & 2033
- Table 12: Global Emergency Management Service Revenue undefined Forecast, by Country 2020 & 2033
- Table 13: Brazil Emergency Management Service Revenue (undefined) Forecast, by Application 2020 & 2033
- Table 14: Argentina Emergency Management Service Revenue (undefined) Forecast, by Application 2020 & 2033
- Table 15: Rest of South America Emergency Management Service Revenue (undefined) Forecast, by Application 2020 & 2033
- Table 16: Global Emergency Management Service Revenue undefined Forecast, by Application 2020 & 2033
- Table 17: Global Emergency Management Service Revenue undefined Forecast, by Types 2020 & 2033
- Table 18: Global Emergency Management Service Revenue undefined Forecast, by Country 2020 & 2033
- Table 19: United Kingdom Emergency Management Service Revenue (undefined) Forecast, by Application 2020 & 2033
- Table 20: Germany Emergency Management Service Revenue (undefined) Forecast, by Application 2020 & 2033
- Table 21: France Emergency Management Service Revenue (undefined) Forecast, by Application 2020 & 2033
- Table 22: Italy Emergency Management Service Revenue (undefined) Forecast, by Application 2020 & 2033
- Table 23: Spain Emergency Management Service Revenue (undefined) Forecast, by Application 2020 & 2033
- Table 24: Russia Emergency Management Service Revenue (undefined) Forecast, by Application 2020 & 2033
- Table 25: Benelux Emergency Management Service Revenue (undefined) Forecast, by Application 2020 & 2033
- Table 26: Nordics Emergency Management Service Revenue (undefined) Forecast, by Application 2020 & 2033
- Table 27: Rest of Europe Emergency Management Service Revenue (undefined) Forecast, by Application 2020 & 2033
- Table 28: Global Emergency Management Service Revenue undefined Forecast, by Application 2020 & 2033
- Table 29: Global Emergency Management Service Revenue undefined Forecast, by Types 2020 & 2033
- Table 30: Global Emergency Management Service Revenue undefined Forecast, by Country 2020 & 2033
- Table 31: Turkey Emergency Management Service Revenue (undefined) Forecast, by Application 2020 & 2033
- Table 32: Israel Emergency Management Service Revenue (undefined) Forecast, by Application 2020 & 2033
- Table 33: GCC Emergency Management Service Revenue (undefined) Forecast, by Application 2020 & 2033
- Table 34: North Africa Emergency Management Service Revenue (undefined) Forecast, by Application 2020 & 2033
- Table 35: South Africa Emergency Management Service Revenue (undefined) Forecast, by Application 2020 & 2033
- Table 36: Rest of Middle East & Africa Emergency Management Service Revenue (undefined) Forecast, by Application 2020 & 2033
- Table 37: Global Emergency Management Service Revenue undefined Forecast, by Application 2020 & 2033
- Table 38: Global Emergency Management Service Revenue undefined Forecast, by Types 2020 & 2033
- Table 39: Global Emergency Management Service Revenue undefined Forecast, by Country 2020 & 2033
- Table 40: China Emergency Management Service Revenue (undefined) Forecast, by Application 2020 & 2033
- Table 41: India Emergency Management Service Revenue (undefined) Forecast, by Application 2020 & 2033
- Table 42: Japan Emergency Management Service Revenue (undefined) Forecast, by Application 2020 & 2033
- Table 43: South Korea Emergency Management Service Revenue (undefined) Forecast, by Application 2020 & 2033
- Table 44: ASEAN Emergency Management Service Revenue (undefined) Forecast, by Application 2020 & 2033
- Table 45: Oceania Emergency Management Service Revenue (undefined) Forecast, by Application 2020 & 2033
- Table 46: Rest of Asia Pacific Emergency Management Service Revenue (undefined) Forecast, by Application 2020 & 2033
Frequently Asked Questions
1. What is the projected Compound Annual Growth Rate (CAGR) of the Emergency Management Service?
The projected CAGR is approximately 15.01%.
2. Which companies are prominent players in the Emergency Management Service?
Key companies in the market include IBM Corporation, Atos SE, West Central Environmental Consultants, Dewberry, Dynamiq Pty Ltd., Hss Inc., Hexagon Ab, Honeywell International Inc., Willdan Group, Inc., Hagerty Consulting, Witt O’ Brien (Seacor Holdings Inc.), Obsidian Analytics (Cadmus Group), Tetra Tech, Inc., ICF International, Inc., Battelle National Biodefense Institute, Science Applications International Corporation (Saic), Leidos Holdings, Inc..
3. What are the main segments of the Emergency Management Service?
The market segments include Application, Types.
4. Can you provide details about the market size?
The market size is estimated to be USD XXX N/A as of 2022.
5. What are some drivers contributing to market growth?
N/A
6. What are the notable trends driving market growth?
N/A
7. Are there any restraints impacting market growth?
N/A
8. Can you provide examples of recent developments in the market?
N/A
9. What pricing options are available for accessing the report?
Pricing options include single-user, multi-user, and enterprise licenses priced at USD 3350.00, USD 5025.00, and USD 6700.00 respectively.
10. Is the market size provided in terms of value or volume?
The market size is provided in terms of value, measured in N/A.
11. Are there any specific market keywords associated with the report?
Yes, the market keyword associated with the report is "Emergency Management Service," which aids in identifying and referencing the specific market segment covered.
12. How do I determine which pricing option suits my needs best?
The pricing options vary based on user requirements and access needs. Individual users may opt for single-user licenses, while businesses requiring broader access may choose multi-user or enterprise licenses for cost-effective access to the report.
13. Are there any additional resources or data provided in the Emergency Management Service report?
While the report offers comprehensive insights, it's advisable to review the specific contents or supplementary materials provided to ascertain if additional resources or data are available.
14. How can I stay updated on further developments or reports in the Emergency Management Service?
To stay informed about further developments, trends, and reports in the Emergency Management Service, consider subscribing to industry newsletters, following relevant companies and organizations, or regularly checking reputable industry news sources and publications.
Methodology
Step 1 - Identification of Relevant Samples Size from Population Database


Step 2 - Approaches for Defining Global Market Size (Value, Volume* & Price*)

Note*: In applicable scenarios
Step 3 - Data Sources
Primary Research
- Web Analytics
- Survey Reports
- Research Institute
- Latest Research Reports
- Opinion Leaders
Secondary Research
- Annual Reports
- White Paper
- Latest Press Release
- Industry Association
- Paid Database
- Investor Presentations

Step 4 - Data Triangulation
Involves using different sources of information in order to increase the validity of a study
These sources are likely to be stakeholders in a program - participants, other researchers, program staff, other community members, and so on.
Then we put all data in single framework & apply various statistical tools to find out the dynamic on the market.
During the analysis stage, feedback from the stakeholder groups would be compared to determine areas of agreement as well as areas of divergence