


Key Insights
The global edible dessert toppers market is poised for significant expansion, projected to reach an estimated $2.5 billion in 2025 and grow at a robust CAGR of 7% through 2033. This dynamic growth is fueled by an increasing consumer demand for visually appealing and customized desserts, driven by social media trends and the desire for unique culinary experiences. The market encompasses a wide array of products, including decorative sprinkles, flavorful syrups, and other innovative confectionery elements. Key drivers for this growth include the rising popularity of home baking and celebratory occasions, where edible toppers play a crucial role in enhancing visual appeal and personalizing treats. Furthermore, advancements in product innovation, offering diverse flavors, textures, and shapes, are catering to evolving consumer preferences and expanding the market's reach. The convenience and ease of use associated with edible dessert toppers also contribute to their widespread adoption across both commercial and residential applications.
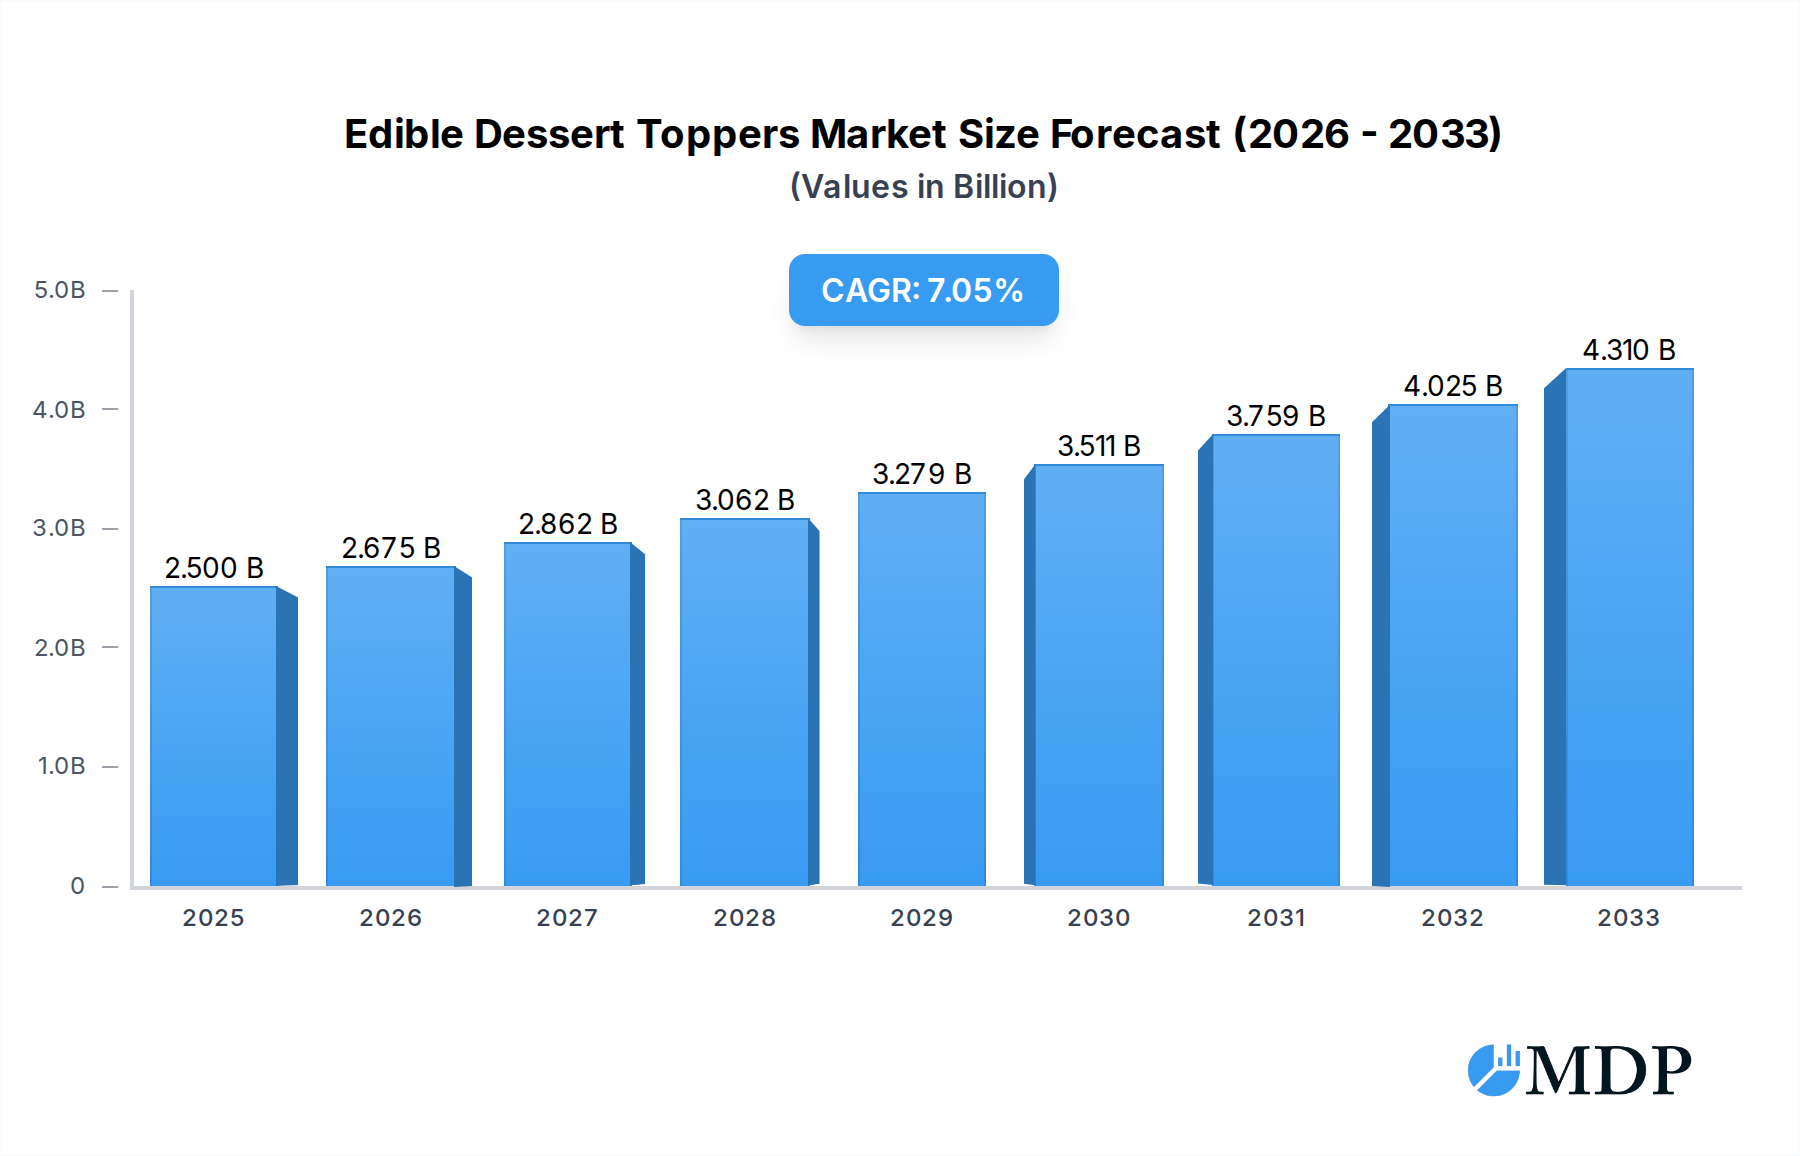
Edible Dessert Toppers Market Size (In Billion)

The market is segmented into two primary applications: Commercial Application and Residential Application. Within these, the product types include Sprinkles, Syrups, and Others, reflecting the diverse range of options available to consumers and businesses. Major players like Dr. Oetker, DecoPac, Hershey's, and Barry Callebaut are actively innovating and expanding their product portfolios to capture a larger market share. Geographically, North America and Europe currently lead the market due to established dessert cultures and high disposable incomes. However, the Asia Pacific region is demonstrating substantial growth potential, driven by a rapidly expanding middle class, increasing urbanization, and a burgeoning interest in Western dessert trends. While the market is attractive, certain restraints, such as the fluctuating prices of raw materials and increasing competition, warrant careful consideration by market participants. Nevertheless, the overall outlook for the edible dessert toppers market remains exceptionally positive, supported by sustained consumer interest and ongoing innovation.
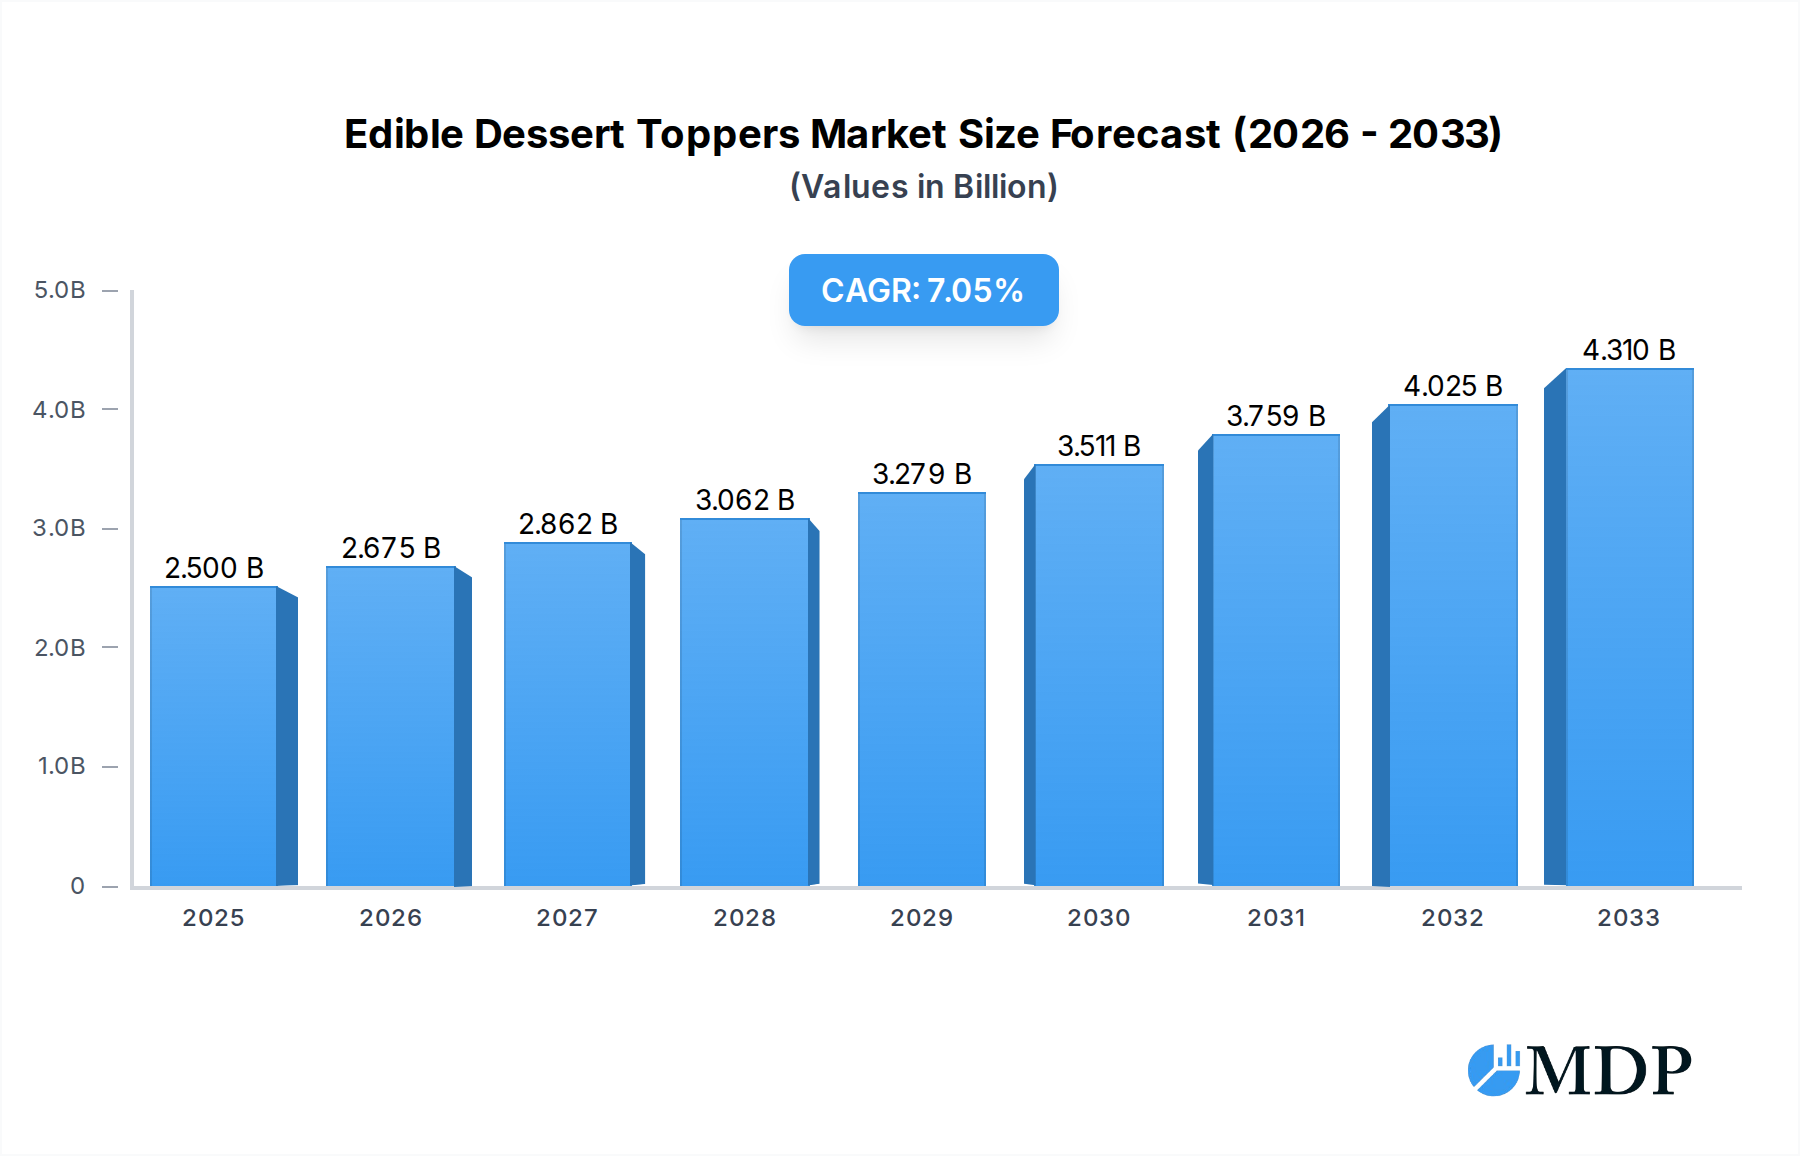
Edible Dessert Toppers Company Market Share
Edible Dessert Toppers Market: Comprehensive Analysis & Strategic Outlook (2019–2033)
This in-depth report provides a comprehensive analysis of the global edible dessert toppers market, forecasting its trajectory from 2025 to 2033. Delving into market dynamics, key trends, leading segments, product innovations, growth drivers, challenges, and emerging opportunities, this report equips industry stakeholders with actionable insights. Our extensive research covers historical data from 2019 to 2024, with 2025 serving as the base and estimated year. Unlock your competitive advantage in the burgeoning edible dessert toppers industry.
Edible Dessert Toppers Market Dynamics & Concentration
The edible dessert toppers market exhibits a moderate level of concentration, with a blend of large multinational corporations and agile regional players. Key innovation drivers include the increasing demand for visually appealing and customizable dessert experiences, fueled by social media trends and a growing home baking culture. Regulatory frameworks, particularly concerning food safety standards and labeling requirements in regions like North America and Europe, play a crucial role in shaping product development and market access. Product substitutes, such as fresh fruit, whipped cream, and artificial decorations, present ongoing competition, necessitating continuous product differentiation. End-user trends reveal a strong preference for natural ingredients, vibrant colors, and unique textures. Mergers and acquisitions (M&A) activities are anticipated to increase as established companies seek to expand their product portfolios and market reach, and smaller innovative firms aim for scalability. Recent M&A activities show a trend towards consolidating specialized capabilities and acquiring brands with strong consumer recognition. The market share landscape is dynamic, with leading players holding significant, yet not dominant, positions, indicating room for strategic expansion and niche market penetration.
Edible Dessert Toppers Industry Trends & Analysis
The global edible dessert toppers market is poised for significant growth, driven by evolving consumer preferences and technological advancements. The market is projected to expand at a Compound Annual Growth Rate (CAGR) of xx% during the forecast period of 2025–2033. This robust growth is underpinned by several key factors. Firstly, the burgeoning home baking trend has seen a substantial surge, with consumers increasingly seeking ways to elevate their homemade treats for special occasions and everyday indulgence. This has directly translated into higher demand for decorative and flavorful edible toppers. Secondly, the ever-increasing influence of social media platforms like Instagram and TikTok has created a visual culture around food, with aesthetically pleasing desserts taking center stage. This phenomenon encourages consumers and professional bakers alike to utilize attractive edible toppers to enhance the visual appeal of their creations, thereby driving market penetration.
Technological disruptions are also playing a pivotal role. Advancements in food printing technology are enabling the creation of highly customized and intricate edible toppers, opening up new avenues for personalization in both commercial and residential applications. Furthermore, innovations in ingredient formulation are leading to the development of toppers with improved textures, vibrant natural colors, and enhanced shelf stability, catering to health-conscious consumers and diverse dietary needs. The competitive dynamics within the market are characterized by a mix of established global brands and emerging niche players. Companies are increasingly focusing on product diversification, introducing a wider range of flavors, shapes, and thematic designs to cater to specific holidays, events, and dietary preferences. The premiumization trend is also evident, with consumers willing to pay more for high-quality, artisanal, and uniquely designed edible toppers. This trend is particularly pronounced in developed markets, where disposable incomes are higher and consumers are more experimental with their culinary choices. The overall market penetration is steadily increasing as edible dessert toppers move beyond traditional bakery applications into everyday culinary exploration.
Leading Markets & Segments in Edible Dessert Toppers
The Commercial Application segment is currently the dominant force in the edible dessert toppers market, driven by the extensive use of these products by bakeries, confectionery manufacturers, hotels, restaurants, and catering services. The sheer volume of desserts produced in these commercial settings, coupled with the constant need for visually appealing and consistent product presentation, makes them primary consumers. Within this segment, the Sprinkles sub-segment holds a commanding share, owing to their versatility, cost-effectiveness, and wide array of colors, shapes, and flavors that appeal to a broad range of desserts. The Syrup sub-segment also contributes significantly, particularly in the foodservice industry for drizzling over ice cream, pancakes, and waffles.
Geographically, North America is the leading market for edible dessert toppers, attributed to its mature food industry, high disposable incomes, and a deeply ingrained culture of celebrating special occasions with elaborate desserts. The region's strong focus on innovation in food products and the widespread popularity of home baking further bolster demand. The United States alone accounts for a substantial portion of this market share, driven by major confectionery manufacturers and a vast network of commercial food service providers. Key drivers for this dominance include:
- Economic Policies: Favorable business environments and supportive trade policies in countries like the United States facilitate market entry and expansion for both domestic and international players.
- Infrastructure: Robust supply chain and distribution networks ensure the efficient availability of raw materials and finished edible dessert toppers across the country.
- Consumer Affluence and Lifestyle: A high level of disposable income allows consumers to spend more on premium and decorative food items, including elaborate dessert toppings.
- Cultural Significance of Desserts: Desserts play a significant role in social gatherings and celebrations, driving the demand for visually appealing and festive toppings.
The Residential Application segment is also experiencing robust growth, albeit from a smaller base. The rise of home baking as a hobby, coupled with the desire to recreate professional-looking desserts at home, is fueling this expansion. The increasing popularity of themed parties and DIY dessert decoration kits further contributes to this segment's upward trajectory. The Others sub-segment, encompassing items like edible glitters, fondant decorations, and wafer paper, is also showing promising growth due to the increasing demand for unique and personalized dessert embellishments.
Edible Dessert Toppers Product Developments
Recent product developments in the edible dessert toppers market focus on enhancing visual appeal, catering to specific dietary needs, and introducing novel textures and flavors. Companies are innovating with natural colorants derived from fruits and vegetables, meeting consumer demand for cleaner labels. The introduction of allergen-free and vegan-certified toppers is expanding market reach to a wider consumer base. Furthermore, advancements in 3D printing and precision manufacturing are enabling the creation of highly intricate and custom-designed toppers, offering unique branding opportunities for commercial clients and personalized touches for residential users. These innovations provide a competitive edge by meeting evolving consumer preferences and addressing niche market demands.
Key Drivers of Edible Dessert Toppers Growth
The edible dessert toppers market is propelled by several potent growth drivers. The increasing consumer demand for visually appealing and Instagrammable food experiences is a primary catalyst, fueled by social media trends. The resurgence of home baking and DIY dessert culture further amplifies this demand, as individuals seek to enhance their homemade creations. Technological advancements in food manufacturing and decoration, such as edible printing and natural coloring agents, enable greater customization and healthier options. Furthermore, the expanding confectionery and bakery industries, both in commercial and retail sectors, provide a consistent and growing customer base. Economic growth and rising disposable incomes in emerging economies also contribute to increased per capita spending on premium dessert ingredients.
Challenges in the Edible Dessert Toppers Market
Despite its promising growth, the edible dessert toppers market faces several challenges. Stringent food safety regulations and evolving labeling requirements across different geographies can pose compliance hurdles for manufacturers, increasing operational costs. Fluctuations in the prices of raw materials, such as sugar, corn syrup, and food-grade dyes, can impact profit margins and product pricing strategies. Intense competition from both established global brands and numerous smaller niche players leads to price pressures and the need for continuous innovation. Consumer awareness regarding artificial ingredients and the demand for natural alternatives presents a challenge for traditional manufacturers reliant on synthetic colorants and flavors, necessitating a shift in product formulation. Supply chain disruptions, as witnessed in recent years, can also affect the availability and cost of essential ingredients.
Emerging Opportunities in Edible Dessert Toppers
The edible dessert toppers market is ripe with emerging opportunities for growth and innovation. The increasing demand for personalized and customizable toppers presents a significant avenue, with the potential for custom 3D-printed designs and bespoke flavor profiles for special events and branding. The expansion of the plant-based and vegan dessert market creates a strong opportunity for developing a wider array of attractive and flavorful vegan edible toppers. Leveraging e-commerce platforms and direct-to-consumer (DTC) models can allow smaller brands to reach a global audience and build stronger customer relationships. Furthermore, the growing interest in health-conscious indulgence opens doors for toppers made with natural sweeteners, whole-food ingredients, and functional benefits, appealing to a health-aware consumer base. Strategic partnerships with dessert influencers and celebrity chefs can also drive brand awareness and product adoption.
Leading Players in the Edible Dessert Toppers Sector
- Dr. Oetker
- DecoPac
- The J.M. Smucker
- DORI ALIMENTOS
- HERSHEY'S
- Barry Callebaut
- PHILIPPINE GUM PASTE
- Pecan Deluxe Candy
- Cake Décor
- Girrbach
- Fancy Sprinkles
- American Sprinkle
- Happy Sprinkles
- Sweets Indeed
- Carroll Industries
- Jubilee Candy Corp
- Calay Candy
- Xiamen Yasin Industry
Key Milestones in Edible Dessert Toppers Industry
- 2019: Increased consumer adoption of online grocery shopping, leading to greater accessibility for specialized dessert ingredients.
- 2020: Surge in home baking activities due to global lockdowns, significantly boosting demand for decorative edible toppers.
- 2021: Growing consumer preference for natural ingredients and clean labels, prompting manufacturers to invest in natural color and flavor development.
- 2022: Advancements in edible printing technology enabling more intricate and personalized topper designs.
- 2023: Expansion of vegan and plant-based dessert options, driving the need for corresponding edible topper solutions.
- 2024: Greater emphasis on sustainable packaging and ethical sourcing of ingredients by key industry players.
Strategic Outlook for Edible Dessert Toppers Market
The strategic outlook for the edible dessert toppers market is exceptionally positive, driven by sustained consumer engagement with desserts and continuous innovation. Growth accelerators include the ongoing digitalization of food retail, which enhances product discoverability and accessibility, and the increasing demand for experiential food products, where decorative toppers play a crucial role. Companies that can effectively leverage personalized and customizable offerings, embrace sustainable practices, and cater to the growing health-conscious consumer segment will be best positioned for success. Strategic partnerships with influencers and key retailers, coupled with investments in novel ingredient technologies and advanced manufacturing processes, will further solidify market leadership and unlock new revenue streams in this dynamic and expanding sector.
Edible Dessert Toppers Segmentation
-
1. Application
- 1.1. Commercial Application
- 1.2. Residential Application
-
2. Type
- 2.1. Sprinkles
- 2.2. Syrup
- 2.3. Others
Edible Dessert Toppers Segmentation By Geography
-
1. North America
- 1.1. United States
- 1.2. Canada
- 1.3. Mexico
-
2. South America
- 2.1. Brazil
- 2.2. Argentina
- 2.3. Rest of South America
-
3. Europe
- 3.1. United Kingdom
- 3.2. Germany
- 3.3. France
- 3.4. Italy
- 3.5. Spain
- 3.6. Russia
- 3.7. Benelux
- 3.8. Nordics
- 3.9. Rest of Europe
-
4. Middle East & Africa
- 4.1. Turkey
- 4.2. Israel
- 4.3. GCC
- 4.4. North Africa
- 4.5. South Africa
- 4.6. Rest of Middle East & Africa
-
5. Asia Pacific
- 5.1. China
- 5.2. India
- 5.3. Japan
- 5.4. South Korea
- 5.5. ASEAN
- 5.6. Oceania
- 5.7. Rest of Asia Pacific
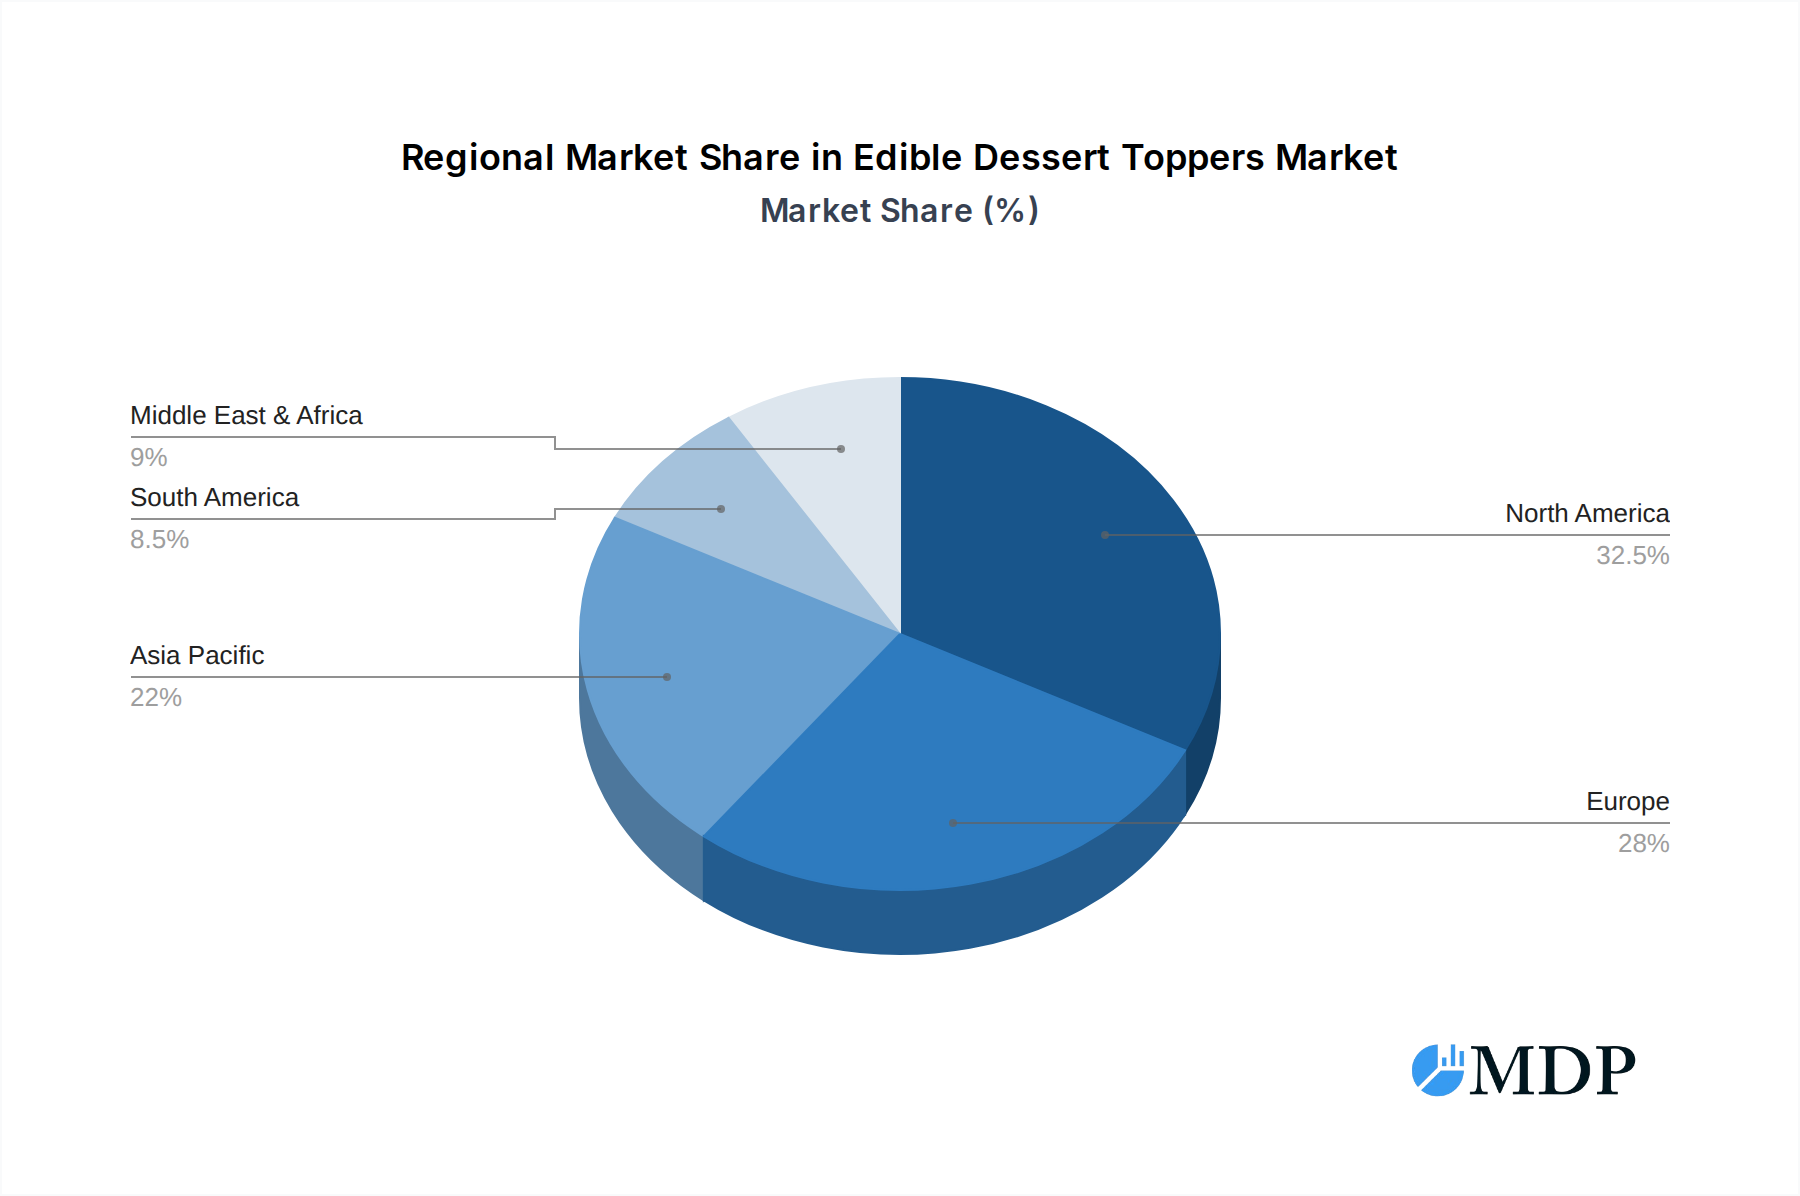
Edible Dessert Toppers Regional Market Share
Geographic Coverage of Edible Dessert Toppers
Edible Dessert Toppers REPORT HIGHLIGHTS
| Aspects | Details |
|---|---|
| Study Period | 2020-2034 |
| Base Year | 2025 |
| Estimated Year | 2026 |
| Forecast Period | 2026-2034 |
| Historical Period | 2020-2025 |
| Growth Rate | CAGR of 7% from 2020-2034 |
| Segmentation |
|
Table of Contents
- 1. Introduction
- 1.1. Research Scope
- 1.2. Market Segmentation
- 1.3. Research Objective
- 1.4. Definitions and Assumptions
- 2. Executive Summary
- 2.1. Market Snapshot
- 3. Market Dynamics
- 3.1. Market Drivers
- 3.2. Market Restrains
- 3.3. Market Trends
- 3.4. Market Opportunities
- 4. Market Factor Analysis
- 4.1. Porters Five Forces
- 4.1.1. Bargaining Power of Suppliers
- 4.1.2. Bargaining Power of Buyers
- 4.1.3. Threat of New Entrants
- 4.1.4. Threat of Substitutes
- 4.1.5. Competitive Rivalry
- 4.2. PESTEL analysis
- 4.3. BCG Analysis
- 4.3.1. Stars (High Growth, High Market Share)
- 4.3.2. Cash Cows (Low Growth, High Market Share)
- 4.3.3. Question Mark (High Growth, Low Market Share)
- 4.3.4. Dogs (Low Growth, Low Market Share)
- 4.4. Ansoff Matrix Analysis
- 4.5. Supply Chain Analysis
- 4.6. Regulatory Landscape
- 4.7. Current Market Potential and Opportunity Assessment (TAM–SAM–SOM Framework)
- 4.8. MDP Analyst Note
- 4.1. Porters Five Forces
- 5. Market Analysis, Insights and Forecast 2021-2033
- 5.1. Market Analysis, Insights and Forecast - by Application
- 5.1.1. Commercial Application
- 5.1.2. Residential Application
- 5.2. Market Analysis, Insights and Forecast - by Type
- 5.2.1. Sprinkles
- 5.2.2. Syrup
- 5.2.3. Others
- 5.3. Market Analysis, Insights and Forecast - by Region
- 5.3.1. North America
- 5.3.2. South America
- 5.3.3. Europe
- 5.3.4. Middle East & Africa
- 5.3.5. Asia Pacific
- 5.1. Market Analysis, Insights and Forecast - by Application
- 6. Global Edible Dessert Toppers Analysis, Insights and Forecast, 2021-2033
- 6.1. Market Analysis, Insights and Forecast - by Application
- 6.1.1. Commercial Application
- 6.1.2. Residential Application
- 6.2. Market Analysis, Insights and Forecast - by Type
- 6.2.1. Sprinkles
- 6.2.2. Syrup
- 6.2.3. Others
- 6.1. Market Analysis, Insights and Forecast - by Application
- 7. North America Edible Dessert Toppers Analysis, Insights and Forecast, 2020-2032
- 7.1. Market Analysis, Insights and Forecast - by Application
- 7.1.1. Commercial Application
- 7.1.2. Residential Application
- 7.2. Market Analysis, Insights and Forecast - by Type
- 7.2.1. Sprinkles
- 7.2.2. Syrup
- 7.2.3. Others
- 7.1. Market Analysis, Insights and Forecast - by Application
- 8. South America Edible Dessert Toppers Analysis, Insights and Forecast, 2020-2032
- 8.1. Market Analysis, Insights and Forecast - by Application
- 8.1.1. Commercial Application
- 8.1.2. Residential Application
- 8.2. Market Analysis, Insights and Forecast - by Type
- 8.2.1. Sprinkles
- 8.2.2. Syrup
- 8.2.3. Others
- 8.1. Market Analysis, Insights and Forecast - by Application
- 9. Europe Edible Dessert Toppers Analysis, Insights and Forecast, 2020-2032
- 9.1. Market Analysis, Insights and Forecast - by Application
- 9.1.1. Commercial Application
- 9.1.2. Residential Application
- 9.2. Market Analysis, Insights and Forecast - by Type
- 9.2.1. Sprinkles
- 9.2.2. Syrup
- 9.2.3. Others
- 9.1. Market Analysis, Insights and Forecast - by Application
- 10. Middle East & Africa Edible Dessert Toppers Analysis, Insights and Forecast, 2020-2032
- 10.1. Market Analysis, Insights and Forecast - by Application
- 10.1.1. Commercial Application
- 10.1.2. Residential Application
- 10.2. Market Analysis, Insights and Forecast - by Type
- 10.2.1. Sprinkles
- 10.2.2. Syrup
- 10.2.3. Others
- 10.1. Market Analysis, Insights and Forecast - by Application
- 11. Asia Pacific Edible Dessert Toppers Analysis, Insights and Forecast, 2020-2032
- 11.1. Market Analysis, Insights and Forecast - by Application
- 11.1.1. Commercial Application
- 11.1.2. Residential Application
- 11.2. Market Analysis, Insights and Forecast - by Type
- 11.2.1. Sprinkles
- 11.2.2. Syrup
- 11.2.3. Others
- 11.1. Market Analysis, Insights and Forecast - by Application
- 12. Competitive Analysis
- 12.1. Company Profiles
- 12.1.1 Dr. Oetker
- 12.1.1.1. Company Overview
- 12.1.1.2. Products
- 12.1.1.3. Company Financials
- 12.1.1.4. SWOT Analysis
- 12.1.2 DecoPac
- 12.1.2.1. Company Overview
- 12.1.2.2. Products
- 12.1.2.3. Company Financials
- 12.1.2.4. SWOT Analysis
- 12.1.3 The J.M. Smucker
- 12.1.3.1. Company Overview
- 12.1.3.2. Products
- 12.1.3.3. Company Financials
- 12.1.3.4. SWOT Analysis
- 12.1.4 DORI ALIMENTOS
- 12.1.4.1. Company Overview
- 12.1.4.2. Products
- 12.1.4.3. Company Financials
- 12.1.4.4. SWOT Analysis
- 12.1.5 HERSHEY'S
- 12.1.5.1. Company Overview
- 12.1.5.2. Products
- 12.1.5.3. Company Financials
- 12.1.5.4. SWOT Analysis
- 12.1.6 Barry Callebaut
- 12.1.6.1. Company Overview
- 12.1.6.2. Products
- 12.1.6.3. Company Financials
- 12.1.6.4. SWOT Analysis
- 12.1.7 PHILIPPINE GUM PASTE
- 12.1.7.1. Company Overview
- 12.1.7.2. Products
- 12.1.7.3. Company Financials
- 12.1.7.4. SWOT Analysis
- 12.1.8 Pecan Deluxe Candy
- 12.1.8.1. Company Overview
- 12.1.8.2. Products
- 12.1.8.3. Company Financials
- 12.1.8.4. SWOT Analysis
- 12.1.9 Cake Décor
- 12.1.9.1. Company Overview
- 12.1.9.2. Products
- 12.1.9.3. Company Financials
- 12.1.9.4. SWOT Analysis
- 12.1.10 Girrbach
- 12.1.10.1. Company Overview
- 12.1.10.2. Products
- 12.1.10.3. Company Financials
- 12.1.10.4. SWOT Analysis
- 12.1.11 Fancy Sprinkles
- 12.1.11.1. Company Overview
- 12.1.11.2. Products
- 12.1.11.3. Company Financials
- 12.1.11.4. SWOT Analysis
- 12.1.12 American Sprinkle
- 12.1.12.1. Company Overview
- 12.1.12.2. Products
- 12.1.12.3. Company Financials
- 12.1.12.4. SWOT Analysis
- 12.1.13 Happy Sprinkles
- 12.1.13.1. Company Overview
- 12.1.13.2. Products
- 12.1.13.3. Company Financials
- 12.1.13.4. SWOT Analysis
- 12.1.14 Sweets Indeed
- 12.1.14.1. Company Overview
- 12.1.14.2. Products
- 12.1.14.3. Company Financials
- 12.1.14.4. SWOT Analysis
- 12.1.15 Carroll Industries
- 12.1.15.1. Company Overview
- 12.1.15.2. Products
- 12.1.15.3. Company Financials
- 12.1.15.4. SWOT Analysis
- 12.1.16 Jubilee Candy Corp
- 12.1.16.1. Company Overview
- 12.1.16.2. Products
- 12.1.16.3. Company Financials
- 12.1.16.4. SWOT Analysis
- 12.1.17 Calay Candy
- 12.1.17.1. Company Overview
- 12.1.17.2. Products
- 12.1.17.3. Company Financials
- 12.1.17.4. SWOT Analysis
- 12.1.18 Xiamen Yasin Industry
- 12.1.18.1. Company Overview
- 12.1.18.2. Products
- 12.1.18.3. Company Financials
- 12.1.18.4. SWOT Analysis
- 12.1.1 Dr. Oetker
- 12.2. Market Entropy
- 12.2.1 Company's Key Areas Served
- 12.2.2 Recent Developments
- 12.3. Company Market Share Analysis 2025
- 12.3.1 Top 5 Companies Market Share Analysis
- 12.3.2 Top 3 Companies Market Share Analysis
- 12.4. List of Potential Customers
- 13. Research Methodology
List of Figures
- Figure 1: Global Edible Dessert Toppers Revenue Breakdown (billion, %) by Region 2025 & 2033
- Figure 2: North America Edible Dessert Toppers Revenue (billion), by Application 2025 & 2033
- Figure 3: North America Edible Dessert Toppers Revenue Share (%), by Application 2025 & 2033
- Figure 4: North America Edible Dessert Toppers Revenue (billion), by Type 2025 & 2033
- Figure 5: North America Edible Dessert Toppers Revenue Share (%), by Type 2025 & 2033
- Figure 6: North America Edible Dessert Toppers Revenue (billion), by Country 2025 & 2033
- Figure 7: North America Edible Dessert Toppers Revenue Share (%), by Country 2025 & 2033
- Figure 8: South America Edible Dessert Toppers Revenue (billion), by Application 2025 & 2033
- Figure 9: South America Edible Dessert Toppers Revenue Share (%), by Application 2025 & 2033
- Figure 10: South America Edible Dessert Toppers Revenue (billion), by Type 2025 & 2033
- Figure 11: South America Edible Dessert Toppers Revenue Share (%), by Type 2025 & 2033
- Figure 12: South America Edible Dessert Toppers Revenue (billion), by Country 2025 & 2033
- Figure 13: South America Edible Dessert Toppers Revenue Share (%), by Country 2025 & 2033
- Figure 14: Europe Edible Dessert Toppers Revenue (billion), by Application 2025 & 2033
- Figure 15: Europe Edible Dessert Toppers Revenue Share (%), by Application 2025 & 2033
- Figure 16: Europe Edible Dessert Toppers Revenue (billion), by Type 2025 & 2033
- Figure 17: Europe Edible Dessert Toppers Revenue Share (%), by Type 2025 & 2033
- Figure 18: Europe Edible Dessert Toppers Revenue (billion), by Country 2025 & 2033
- Figure 19: Europe Edible Dessert Toppers Revenue Share (%), by Country 2025 & 2033
- Figure 20: Middle East & Africa Edible Dessert Toppers Revenue (billion), by Application 2025 & 2033
- Figure 21: Middle East & Africa Edible Dessert Toppers Revenue Share (%), by Application 2025 & 2033
- Figure 22: Middle East & Africa Edible Dessert Toppers Revenue (billion), by Type 2025 & 2033
- Figure 23: Middle East & Africa Edible Dessert Toppers Revenue Share (%), by Type 2025 & 2033
- Figure 24: Middle East & Africa Edible Dessert Toppers Revenue (billion), by Country 2025 & 2033
- Figure 25: Middle East & Africa Edible Dessert Toppers Revenue Share (%), by Country 2025 & 2033
- Figure 26: Asia Pacific Edible Dessert Toppers Revenue (billion), by Application 2025 & 2033
- Figure 27: Asia Pacific Edible Dessert Toppers Revenue Share (%), by Application 2025 & 2033
- Figure 28: Asia Pacific Edible Dessert Toppers Revenue (billion), by Type 2025 & 2033
- Figure 29: Asia Pacific Edible Dessert Toppers Revenue Share (%), by Type 2025 & 2033
- Figure 30: Asia Pacific Edible Dessert Toppers Revenue (billion), by Country 2025 & 2033
- Figure 31: Asia Pacific Edible Dessert Toppers Revenue Share (%), by Country 2025 & 2033
List of Tables
- Table 1: Global Edible Dessert Toppers Revenue billion Forecast, by Application 2020 & 2033
- Table 2: Global Edible Dessert Toppers Revenue billion Forecast, by Type 2020 & 2033
- Table 3: Global Edible Dessert Toppers Revenue billion Forecast, by Region 2020 & 2033
- Table 4: Global Edible Dessert Toppers Revenue billion Forecast, by Application 2020 & 2033
- Table 5: Global Edible Dessert Toppers Revenue billion Forecast, by Type 2020 & 2033
- Table 6: Global Edible Dessert Toppers Revenue billion Forecast, by Country 2020 & 2033
- Table 7: United States Edible Dessert Toppers Revenue (billion) Forecast, by Application 2020 & 2033
- Table 8: Canada Edible Dessert Toppers Revenue (billion) Forecast, by Application 2020 & 2033
- Table 9: Mexico Edible Dessert Toppers Revenue (billion) Forecast, by Application 2020 & 2033
- Table 10: Global Edible Dessert Toppers Revenue billion Forecast, by Application 2020 & 2033
- Table 11: Global Edible Dessert Toppers Revenue billion Forecast, by Type 2020 & 2033
- Table 12: Global Edible Dessert Toppers Revenue billion Forecast, by Country 2020 & 2033
- Table 13: Brazil Edible Dessert Toppers Revenue (billion) Forecast, by Application 2020 & 2033
- Table 14: Argentina Edible Dessert Toppers Revenue (billion) Forecast, by Application 2020 & 2033
- Table 15: Rest of South America Edible Dessert Toppers Revenue (billion) Forecast, by Application 2020 & 2033
- Table 16: Global Edible Dessert Toppers Revenue billion Forecast, by Application 2020 & 2033
- Table 17: Global Edible Dessert Toppers Revenue billion Forecast, by Type 2020 & 2033
- Table 18: Global Edible Dessert Toppers Revenue billion Forecast, by Country 2020 & 2033
- Table 19: United Kingdom Edible Dessert Toppers Revenue (billion) Forecast, by Application 2020 & 2033
- Table 20: Germany Edible Dessert Toppers Revenue (billion) Forecast, by Application 2020 & 2033
- Table 21: France Edible Dessert Toppers Revenue (billion) Forecast, by Application 2020 & 2033
- Table 22: Italy Edible Dessert Toppers Revenue (billion) Forecast, by Application 2020 & 2033
- Table 23: Spain Edible Dessert Toppers Revenue (billion) Forecast, by Application 2020 & 2033
- Table 24: Russia Edible Dessert Toppers Revenue (billion) Forecast, by Application 2020 & 2033
- Table 25: Benelux Edible Dessert Toppers Revenue (billion) Forecast, by Application 2020 & 2033
- Table 26: Nordics Edible Dessert Toppers Revenue (billion) Forecast, by Application 2020 & 2033
- Table 27: Rest of Europe Edible Dessert Toppers Revenue (billion) Forecast, by Application 2020 & 2033
- Table 28: Global Edible Dessert Toppers Revenue billion Forecast, by Application 2020 & 2033
- Table 29: Global Edible Dessert Toppers Revenue billion Forecast, by Type 2020 & 2033
- Table 30: Global Edible Dessert Toppers Revenue billion Forecast, by Country 2020 & 2033
- Table 31: Turkey Edible Dessert Toppers Revenue (billion) Forecast, by Application 2020 & 2033
- Table 32: Israel Edible Dessert Toppers Revenue (billion) Forecast, by Application 2020 & 2033
- Table 33: GCC Edible Dessert Toppers Revenue (billion) Forecast, by Application 2020 & 2033
- Table 34: North Africa Edible Dessert Toppers Revenue (billion) Forecast, by Application 2020 & 2033
- Table 35: South Africa Edible Dessert Toppers Revenue (billion) Forecast, by Application 2020 & 2033
- Table 36: Rest of Middle East & Africa Edible Dessert Toppers Revenue (billion) Forecast, by Application 2020 & 2033
- Table 37: Global Edible Dessert Toppers Revenue billion Forecast, by Application 2020 & 2033
- Table 38: Global Edible Dessert Toppers Revenue billion Forecast, by Type 2020 & 2033
- Table 39: Global Edible Dessert Toppers Revenue billion Forecast, by Country 2020 & 2033
- Table 40: China Edible Dessert Toppers Revenue (billion) Forecast, by Application 2020 & 2033
- Table 41: India Edible Dessert Toppers Revenue (billion) Forecast, by Application 2020 & 2033
- Table 42: Japan Edible Dessert Toppers Revenue (billion) Forecast, by Application 2020 & 2033
- Table 43: South Korea Edible Dessert Toppers Revenue (billion) Forecast, by Application 2020 & 2033
- Table 44: ASEAN Edible Dessert Toppers Revenue (billion) Forecast, by Application 2020 & 2033
- Table 45: Oceania Edible Dessert Toppers Revenue (billion) Forecast, by Application 2020 & 2033
- Table 46: Rest of Asia Pacific Edible Dessert Toppers Revenue (billion) Forecast, by Application 2020 & 2033
Frequently Asked Questions
1. What is the projected Compound Annual Growth Rate (CAGR) of the Edible Dessert Toppers?
The projected CAGR is approximately 7%.
2. Which companies are prominent players in the Edible Dessert Toppers?
Key companies in the market include Dr. Oetker, DecoPac, The J.M. Smucker, DORI ALIMENTOS, HERSHEY'S, Barry Callebaut, PHILIPPINE GUM PASTE, Pecan Deluxe Candy, Cake Décor, Girrbach, Fancy Sprinkles, American Sprinkle, Happy Sprinkles, Sweets Indeed, Carroll Industries, Jubilee Candy Corp, Calay Candy, Xiamen Yasin Industry.
3. What are the main segments of the Edible Dessert Toppers?
The market segments include Application, Type.
4. Can you provide details about the market size?
The market size is estimated to be USD 2.5 billion as of 2022.
5. What are some drivers contributing to market growth?
N/A
6. What are the notable trends driving market growth?
N/A
7. Are there any restraints impacting market growth?
N/A
8. Can you provide examples of recent developments in the market?
N/A
9. What pricing options are available for accessing the report?
Pricing options include single-user, multi-user, and enterprise licenses priced at USD 4900.00, USD 7350.00, and USD 9800.00 respectively.
10. Is the market size provided in terms of value or volume?
The market size is provided in terms of value, measured in billion.
11. Are there any specific market keywords associated with the report?
Yes, the market keyword associated with the report is "Edible Dessert Toppers," which aids in identifying and referencing the specific market segment covered.
12. How do I determine which pricing option suits my needs best?
The pricing options vary based on user requirements and access needs. Individual users may opt for single-user licenses, while businesses requiring broader access may choose multi-user or enterprise licenses for cost-effective access to the report.
13. Are there any additional resources or data provided in the Edible Dessert Toppers report?
While the report offers comprehensive insights, it's advisable to review the specific contents or supplementary materials provided to ascertain if additional resources or data are available.
14. How can I stay updated on further developments or reports in the Edible Dessert Toppers?
To stay informed about further developments, trends, and reports in the Edible Dessert Toppers, consider subscribing to industry newsletters, following relevant companies and organizations, or regularly checking reputable industry news sources and publications.
Methodology
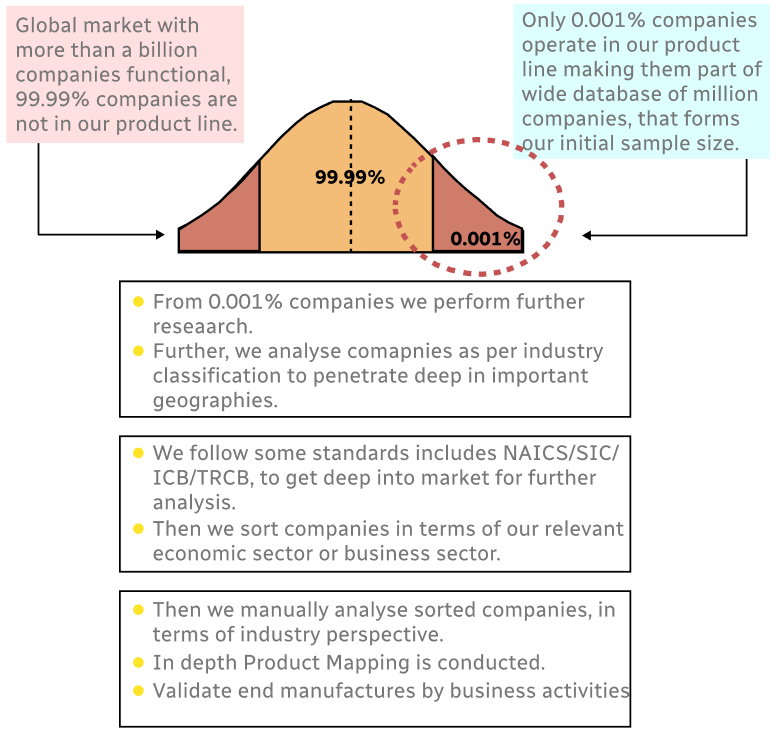
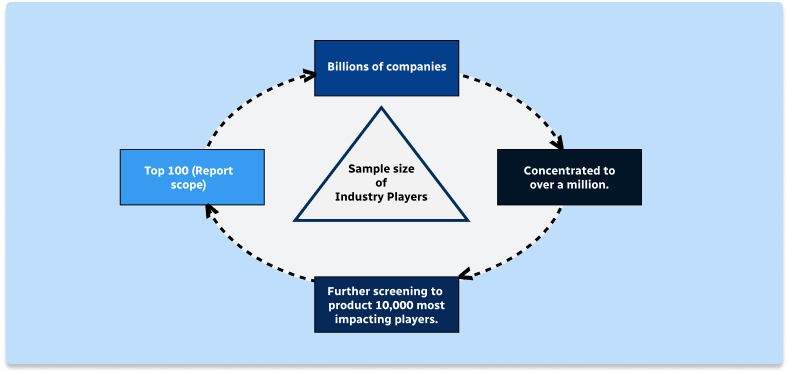
Step 1 - Identification of Relevant Samples Size from Population Database
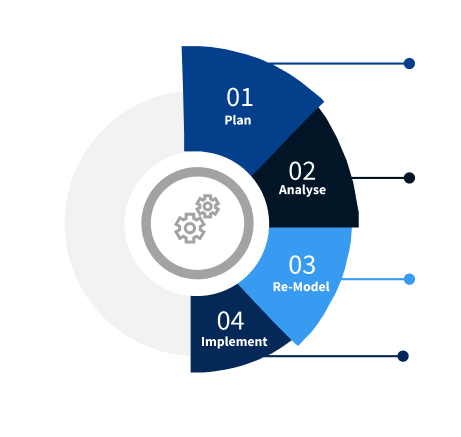
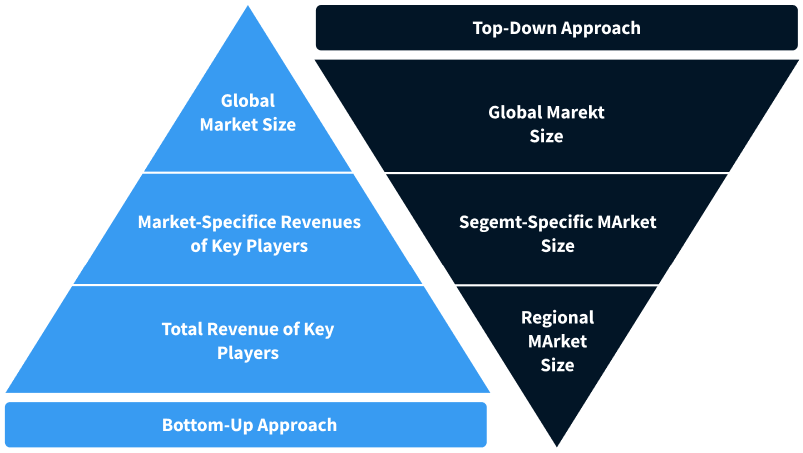
Step 2 - Approaches for Defining Global Market Size (Value, Volume* & Price*)
Note*: In applicable scenarios
Step 3 - Data Sources
Primary Research
- Web Analytics
- Survey Reports
- Research Institute
- Latest Research Reports
- Opinion Leaders
Secondary Research
- Annual Reports
- White Paper
- Latest Press Release
- Industry Association
- Paid Database
- Investor Presentations
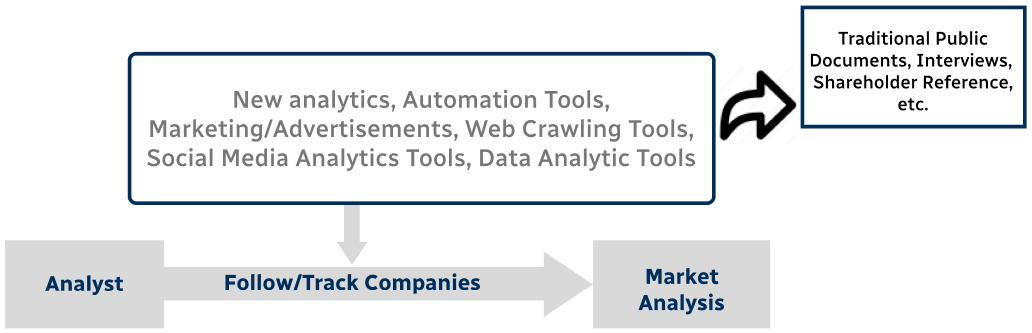
Step 4 - Data Triangulation
Involves using different sources of information in order to increase the validity of a study
These sources are likely to be stakeholders in a program - participants, other researchers, program staff, other community members, and so on.
Then we put all data in single framework & apply various statistical tools to find out the dynamic on the market.
During the analysis stage, feedback from the stakeholder groups would be compared to determine areas of agreement as well as areas of divergence