

Key Insights
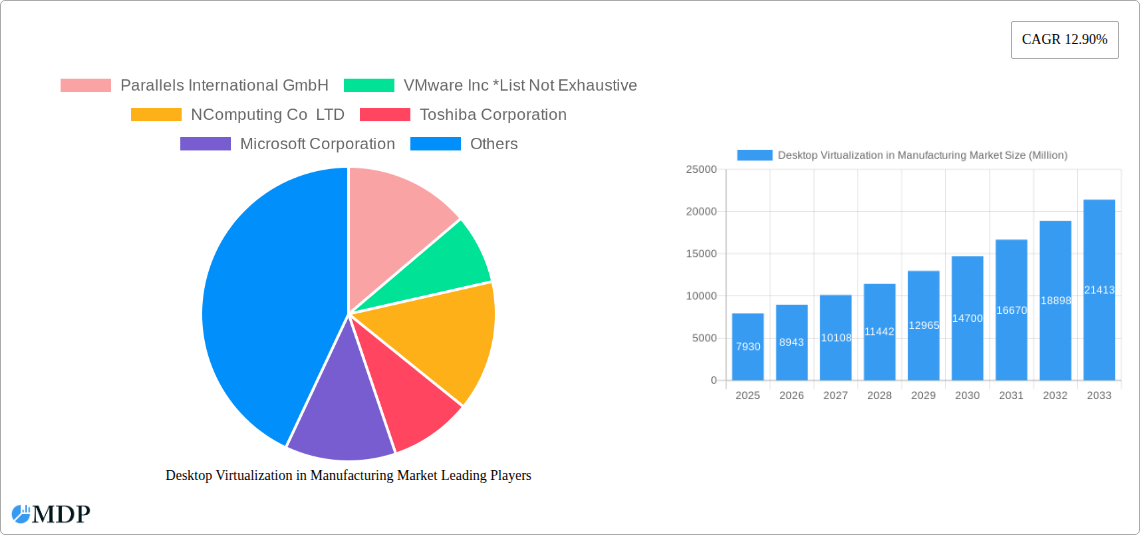
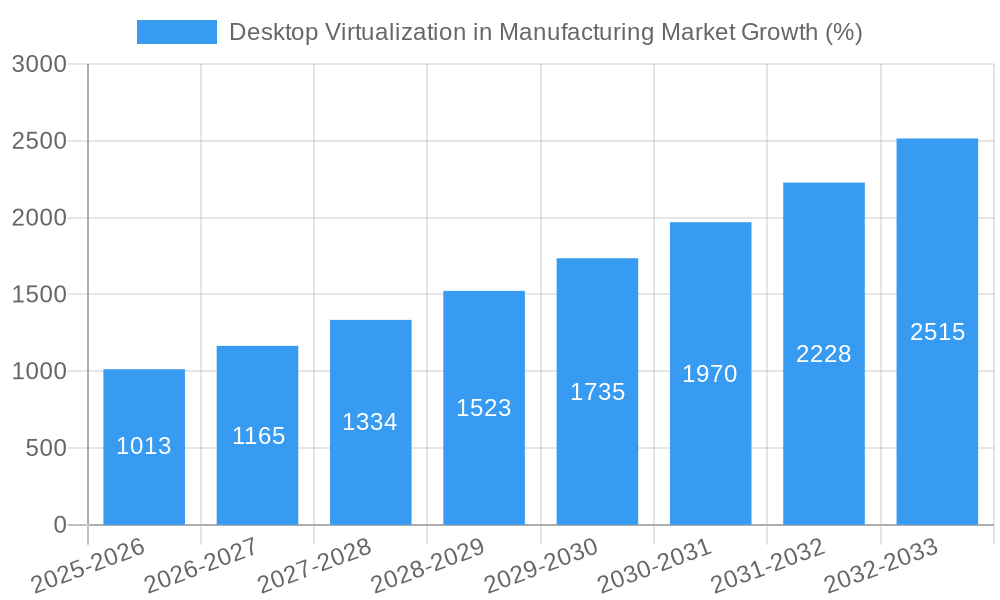
The global Desktop Virtualization in Manufacturing market, valued at $7.93 billion in 2025, is projected to experience robust growth, driven by a Compound Annual Growth Rate (CAGR) of 12.90% from 2025 to 2033. This expansion is fueled by several key factors. The increasing adoption of Industry 4.0 initiatives and the growing need for enhanced operational efficiency and data security within manufacturing environments are major catalysts. Manufacturers are increasingly leveraging desktop virtualization to centralize data management, improve remote access capabilities for geographically dispersed teams, and streamline IT infrastructure management. The transition towards cloud-based solutions, offering scalability and cost-effectiveness, further accelerates market growth. Furthermore, the rising demand for secure access to critical manufacturing applications and data from various devices (desktops, tablets, mobile phones) drives the adoption of diverse desktop delivery platforms like Hosted Virtual Desktops (HVDs) and Hosted Shared Desktops (HSDs). Competition among established players like VMware, Citrix, and Microsoft, alongside emerging technology providers, is fostering innovation and contributing to market expansion.
However, certain challenges hinder market growth. High initial investment costs associated with implementing and maintaining a robust virtualization infrastructure can be a barrier for smaller manufacturers. Concerns regarding data security and the potential for network disruptions also influence adoption decisions. Furthermore, the complexity of integrating virtualization solutions with existing legacy systems in older manufacturing facilities can pose integration challenges. Nevertheless, the long-term benefits of increased productivity, reduced IT operational costs, and improved security are expected to outweigh these limitations, ensuring sustained growth in the Desktop Virtualization in Manufacturing market throughout the forecast period. The market segmentation by deployment mode (on-premises vs. cloud) and desktop delivery platform (HVD, HSD, etc.) reflects the diverse technological choices available and the evolving preferences within the manufacturing industry.
Desktop Virtualization in Manufacturing Market: A Comprehensive Report (2019-2033)
This in-depth report provides a comprehensive analysis of the Desktop Virtualization in Manufacturing Market, offering actionable insights for stakeholders across the manufacturing sector. Covering the period from 2019 to 2033, with a focus on 2025, this report unveils market dynamics, trends, leading players, and future growth opportunities. The market is projected to reach xx Million by 2033, exhibiting a CAGR of xx% during the forecast period (2025-2033).
Desktop Virtualization in Manufacturing Market Market Dynamics & Concentration
The Desktop Virtualization in Manufacturing Market exhibits a moderately concentrated landscape, with key players like VMware Inc., Parallels International GmbH, Citrix Systems Inc., Microsoft Corporation, and IBM Corp holding significant market share. Market concentration is influenced by factors including technological innovation, regulatory compliance, and the increasing adoption of cloud-based solutions. The market share of the top five players is estimated at xx%, indicating room for both expansion and consolidation.
Innovation Drivers: Continuous advancements in virtualization technologies, including enhanced security features, improved performance, and greater scalability, drive market growth. The integration of AI and machine learning further enhances operational efficiency.
Regulatory Frameworks: Compliance requirements related to data security and privacy significantly impact market dynamics, encouraging the adoption of robust virtualization solutions. The increasing emphasis on cybersecurity regulations drives demand for secure desktop virtualization platforms.
Product Substitutes: While traditional on-premise solutions still exist, cloud-based solutions are rapidly gaining traction due to their cost-effectiveness and scalability. The market faces competition from alternative remote access solutions, however, the superior security and management capabilities of desktop virtualization offer a significant advantage.
End-User Trends: Manufacturing companies are increasingly adopting desktop virtualization to enhance operational efficiency, improve data security, and streamline IT management. The demand is particularly high amongst organizations seeking to improve remote worker productivity and enhance workplace flexibility.
M&A Activities: The market has witnessed a moderate level of mergers and acquisitions in recent years, with approximately xx deals recorded between 2019 and 2024. These activities reflect the strategic consolidation efforts by major players aiming to expand their product portfolio and market reach.
Desktop Virtualization in Manufacturing Market Industry Trends & Analysis
The Desktop Virtualization in Manufacturing Market is experiencing robust growth, fueled by the increasing adoption of Industry 4.0 technologies and the growing need for secure remote access to critical manufacturing data. The market's expansion is driven by several key factors, including:
- Technological Disruptions: The rise of cloud computing, 5G networks, and edge computing is transforming the landscape of desktop virtualization. These technologies provide greater flexibility, scalability, and performance for manufacturing operations.
- Consumer Preferences: Businesses are increasingly demanding secure and cost-effective solutions to manage their IT infrastructure. Desktop virtualization offers a compelling value proposition in this regard, by streamlining IT management and reducing operational costs.
- Competitive Dynamics: The market is characterized by intense competition amongst established players and emerging startups. This competition drives innovation and helps keep prices competitive.
Leading Markets & Segments in Desktop Virtualization in Manufacturing Market
By Desktop Delivery Platform:
Hosted Virtual Desktop (HVD): HVD dominates the market due to its enhanced security and ease of management. Key drivers include:
- Increased demand for remote access to applications and data.
- Growing adoption of cloud-based solutions.
- Improved security features compared to other delivery platforms.
Hosted Shared Desktop (HSD): HSD holds a smaller but growing market share, driven by its cost-effectiveness for organizations with high user density. However, concerns around security and performance may limit its widespread adoption.
Other Desktop Delivery Platforms: This segment encompasses various niche solutions catering to specific industry needs.
By Deployment Mode:
Cloud: Cloud-based deployments are rapidly gaining traction, driven by their scalability, flexibility, and cost-effectiveness. This is particularly true for large manufacturing enterprises that demand vast computing resources for complex operations.
On-premises: On-premises deployments still account for a significant market share, particularly amongst organizations with stringent data security requirements or those reluctant to migrate to the cloud. However, this market segment faces decline as cloud adoption increases.
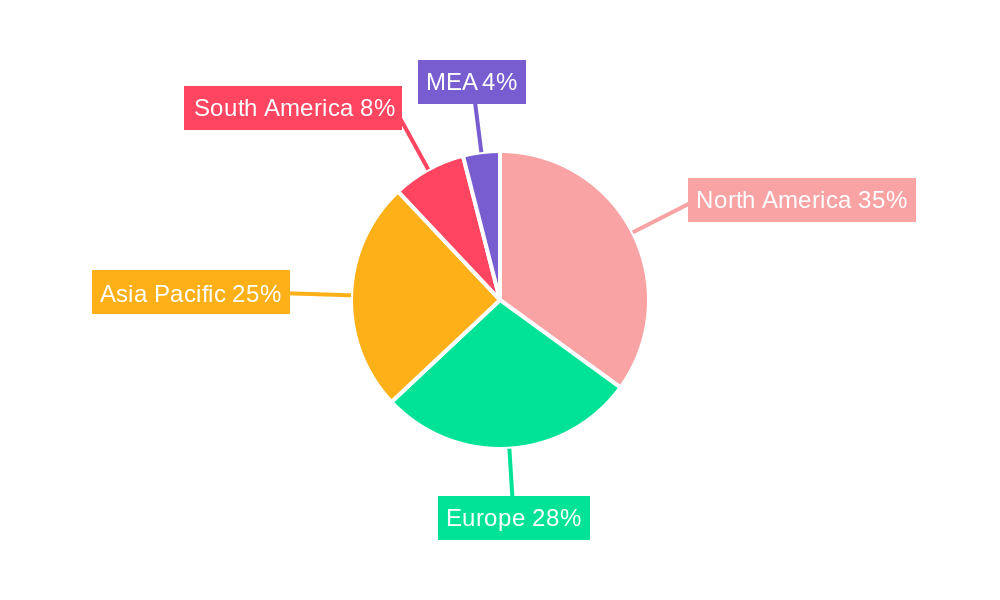
Dominant Region/Country: North America currently holds the largest market share, followed by Europe and Asia-Pacific. However, the Asia-Pacific region is expected to witness the highest growth rate during the forecast period, driven by increasing industrialization and government initiatives promoting digital transformation.
Desktop Virtualization in Manufacturing Market Product Developments
Recent product innovations focus on enhanced security features, improved scalability, and seamless integration with existing manufacturing systems. The integration of AI and machine learning capabilities to optimize resource allocation and improve performance is a significant technological trend. These advancements lead to enhanced productivity, improved operational efficiency, and cost reductions, making them highly marketable in the manufacturing sector.
Key Drivers of Desktop Virtualization in Manufacturing Market Growth
The market's growth is propelled by several key factors:
- Technological Advancements: Innovations in virtualization technologies, cloud computing, and 5G connectivity offer enhanced security, scalability, and performance.
- Economic Factors: Cost optimization through reduced IT infrastructure costs and increased operational efficiency drives adoption.
- Regulatory Compliance: Stringent data security and privacy regulations necessitate robust virtualization solutions.
Challenges in the Desktop Virtualization in Manufacturing Market Market
The market faces challenges such as:
- High Initial Investment Costs: The upfront cost of implementing a virtualization solution can be significant, particularly for smaller businesses.
- Complexity of Implementation: Setting up and managing a virtual desktop infrastructure requires specialized technical expertise.
- Security Concerns: Ensuring the security of virtualized environments is paramount, and any vulnerabilities can have significant financial and reputational implications.
Emerging Opportunities in Desktop Virtualization in Manufacturing Market
The market presents several promising opportunities:
- Expansion into Emerging Markets: Growth potential exists in developing countries undergoing rapid industrialization.
- Strategic Partnerships: Collaborations between virtualization providers and manufacturing equipment vendors can lead to integrated solutions.
- Technological Innovations: The continued development of AI, machine learning, and edge computing technologies will open new possibilities.
Leading Players in the Desktop Virtualization in Manufacturing Market Sector
- Parallels International GmbH
- VMware Inc
- NComputing Co LTD
- Toshiba Corporation
- Microsoft Corporation
- IBM Corp
- Dell Inc
- Huawei Technologies Co Ltd
- Citrix Systems Inc
- Ericom Software
Key Milestones in Desktop Virtualization in Manufacturing Market Industry
- August 2022: VMware Inc. and IBM announced a strengthened partnership to support clients in modernizing mission-critical workloads, accelerating time to value in hybrid cloud environments.
- March 2023: Microsoft Corporation introduced the "22H2" version of Azure Stack HCI Solutions, enhancing network ATC v2, storage replication compression, and Hyper-V live migration.
Strategic Outlook for Desktop Virtualization in Manufacturing Market Market
The future of the Desktop Virtualization in Manufacturing Market is bright, driven by sustained technological advancements, growing demand for secure remote access, and the increasing adoption of cloud-based solutions. Strategic partnerships and expansion into emerging markets present significant growth opportunities for industry players. The continued focus on enhanced security features and seamless integration with existing manufacturing systems will further shape the market's trajectory.
Desktop Virtualization in Manufacturing Market Segmentation
-
1. Desktop Delivery Platform
- 1.1. Hosted Virtual Desktop (HVD)
- 1.2. Hosted Shared Desktop (HSD)
- 1.3. Other Desktop Delivery Platforms
-
2. Deployment Mode
- 2.1. On-premises
- 2.2. Cloud
Desktop Virtualization in Manufacturing Market Segmentation By Geography
- 1. North America
- 2. Europe
- 3. Asia Pacific
- 4. Latin America
- 5. Middle East
Desktop Virtualization in Manufacturing Market REPORT HIGHLIGHTS
| Aspects | Details |
|---|---|
| Study Period | 2019-2033 |
| Base Year | 2024 |
| Estimated Year | 2025 |
| Forecast Period | 2025-2033 |
| Historical Period | 2019-2024 |
| Growth Rate | CAGR of 12.90% from 2019-2033 |
| Segmentation |
|
Table of Contents
- 1. Introduction
- 1.1. Research Scope
- 1.2. Market Segmentation
- 1.3. Research Methodology
- 1.4. Definitions and Assumptions
- 2. Executive Summary
- 2.1. Introduction
- 3. Market Dynamics
- 3.1. Introduction
- 3.2. Market Drivers
- 3.2.1. Growing Adoption of Cloud Computing; Cost Saving in Desktop/PC
- 3.3. Market Restrains
- 3.3.1. Infrastructural Constraints
- 3.4. Market Trends
- 3.4.1. Cloud Deployment Mode to Gain Significant Share
- 4. Market Factor Analysis
- 4.1. Porters Five Forces
- 4.2. Supply/Value Chain
- 4.3. PESTEL analysis
- 4.4. Market Entropy
- 4.5. Patent/Trademark Analysis
- 5. Global Desktop Virtualization in Manufacturing Market Analysis, Insights and Forecast, 2019-2031
- 5.1. Market Analysis, Insights and Forecast - by Desktop Delivery Platform
- 5.1.1. Hosted Virtual Desktop (HVD)
- 5.1.2. Hosted Shared Desktop (HSD)
- 5.1.3. Other Desktop Delivery Platforms
- 5.2. Market Analysis, Insights and Forecast - by Deployment Mode
- 5.2.1. On-premises
- 5.2.2. Cloud
- 5.3. Market Analysis, Insights and Forecast - by Region
- 5.3.1. North America
- 5.3.2. Europe
- 5.3.3. Asia Pacific
- 5.3.4. Latin America
- 5.3.5. Middle East
- 5.1. Market Analysis, Insights and Forecast - by Desktop Delivery Platform
- 6. North America Desktop Virtualization in Manufacturing Market Analysis, Insights and Forecast, 2019-2031
- 6.1. Market Analysis, Insights and Forecast - by Desktop Delivery Platform
- 6.1.1. Hosted Virtual Desktop (HVD)
- 6.1.2. Hosted Shared Desktop (HSD)
- 6.1.3. Other Desktop Delivery Platforms
- 6.2. Market Analysis, Insights and Forecast - by Deployment Mode
- 6.2.1. On-premises
- 6.2.2. Cloud
- 6.1. Market Analysis, Insights and Forecast - by Desktop Delivery Platform
- 7. Europe Desktop Virtualization in Manufacturing Market Analysis, Insights and Forecast, 2019-2031
- 7.1. Market Analysis, Insights and Forecast - by Desktop Delivery Platform
- 7.1.1. Hosted Virtual Desktop (HVD)
- 7.1.2. Hosted Shared Desktop (HSD)
- 7.1.3. Other Desktop Delivery Platforms
- 7.2. Market Analysis, Insights and Forecast - by Deployment Mode
- 7.2.1. On-premises
- 7.2.2. Cloud
- 7.1. Market Analysis, Insights and Forecast - by Desktop Delivery Platform
- 8. Asia Pacific Desktop Virtualization in Manufacturing Market Analysis, Insights and Forecast, 2019-2031
- 8.1. Market Analysis, Insights and Forecast - by Desktop Delivery Platform
- 8.1.1. Hosted Virtual Desktop (HVD)
- 8.1.2. Hosted Shared Desktop (HSD)
- 8.1.3. Other Desktop Delivery Platforms
- 8.2. Market Analysis, Insights and Forecast - by Deployment Mode
- 8.2.1. On-premises
- 8.2.2. Cloud
- 8.1. Market Analysis, Insights and Forecast - by Desktop Delivery Platform
- 9. Latin America Desktop Virtualization in Manufacturing Market Analysis, Insights and Forecast, 2019-2031
- 9.1. Market Analysis, Insights and Forecast - by Desktop Delivery Platform
- 9.1.1. Hosted Virtual Desktop (HVD)
- 9.1.2. Hosted Shared Desktop (HSD)
- 9.1.3. Other Desktop Delivery Platforms
- 9.2. Market Analysis, Insights and Forecast - by Deployment Mode
- 9.2.1. On-premises
- 9.2.2. Cloud
- 9.1. Market Analysis, Insights and Forecast - by Desktop Delivery Platform
- 10. Middle East Desktop Virtualization in Manufacturing Market Analysis, Insights and Forecast, 2019-2031
- 10.1. Market Analysis, Insights and Forecast - by Desktop Delivery Platform
- 10.1.1. Hosted Virtual Desktop (HVD)
- 10.1.2. Hosted Shared Desktop (HSD)
- 10.1.3. Other Desktop Delivery Platforms
- 10.2. Market Analysis, Insights and Forecast - by Deployment Mode
- 10.2.1. On-premises
- 10.2.2. Cloud
- 10.1. Market Analysis, Insights and Forecast - by Desktop Delivery Platform
- 11. North America Desktop Virtualization in Manufacturing Market Analysis, Insights and Forecast, 2019-2031
- 11.1. Market Analysis, Insights and Forecast - By Country/Sub-region
- 11.1.1 United States
- 11.1.2 Canada
- 11.1.3 Mexico
- 12. Europe Desktop Virtualization in Manufacturing Market Analysis, Insights and Forecast, 2019-2031
- 12.1. Market Analysis, Insights and Forecast - By Country/Sub-region
- 12.1.1 Germany
- 12.1.2 United Kingdom
- 12.1.3 France
- 12.1.4 Spain
- 12.1.5 Italy
- 12.1.6 Spain
- 12.1.7 Belgium
- 12.1.8 Netherland
- 12.1.9 Nordics
- 12.1.10 Rest of Europe
- 13. Asia Pacific Desktop Virtualization in Manufacturing Market Analysis, Insights and Forecast, 2019-2031
- 13.1. Market Analysis, Insights and Forecast - By Country/Sub-region
- 13.1.1 China
- 13.1.2 Japan
- 13.1.3 India
- 13.1.4 South Korea
- 13.1.5 Southeast Asia
- 13.1.6 Australia
- 13.1.7 Indonesia
- 13.1.8 Phillipes
- 13.1.9 Singapore
- 13.1.10 Thailandc
- 13.1.11 Rest of Asia Pacific
- 14. South America Desktop Virtualization in Manufacturing Market Analysis, Insights and Forecast, 2019-2031
- 14.1. Market Analysis, Insights and Forecast - By Country/Sub-region
- 14.1.1 Brazil
- 14.1.2 Argentina
- 14.1.3 Peru
- 14.1.4 Chile
- 14.1.5 Colombia
- 14.1.6 Ecuador
- 14.1.7 Venezuela
- 14.1.8 Rest of South America
- 15. North America Desktop Virtualization in Manufacturing Market Analysis, Insights and Forecast, 2019-2031
- 15.1. Market Analysis, Insights and Forecast - By Country/Sub-region
- 15.1.1 United States
- 15.1.2 Canada
- 15.1.3 Mexico
- 16. MEA Desktop Virtualization in Manufacturing Market Analysis, Insights and Forecast, 2019-2031
- 16.1. Market Analysis, Insights and Forecast - By Country/Sub-region
- 16.1.1 United Arab Emirates
- 16.1.2 Saudi Arabia
- 16.1.3 South Africa
- 16.1.4 Rest of Middle East and Africa
- 17. Competitive Analysis
- 17.1. Global Market Share Analysis 2024
- 17.2. Company Profiles
- 17.2.1 Parallels International GmbH
- 17.2.1.1. Overview
- 17.2.1.2. Products
- 17.2.1.3. SWOT Analysis
- 17.2.1.4. Recent Developments
- 17.2.1.5. Financials (Based on Availability)
- 17.2.2 VMware Inc *List Not Exhaustive
- 17.2.2.1. Overview
- 17.2.2.2. Products
- 17.2.2.3. SWOT Analysis
- 17.2.2.4. Recent Developments
- 17.2.2.5. Financials (Based on Availability)
- 17.2.3 NComputing Co LTD
- 17.2.3.1. Overview
- 17.2.3.2. Products
- 17.2.3.3. SWOT Analysis
- 17.2.3.4. Recent Developments
- 17.2.3.5. Financials (Based on Availability)
- 17.2.4 Toshiba Corporation
- 17.2.4.1. Overview
- 17.2.4.2. Products
- 17.2.4.3. SWOT Analysis
- 17.2.4.4. Recent Developments
- 17.2.4.5. Financials (Based on Availability)
- 17.2.5 Microsoft Corporation
- 17.2.5.1. Overview
- 17.2.5.2. Products
- 17.2.5.3. SWOT Analysis
- 17.2.5.4. Recent Developments
- 17.2.5.5. Financials (Based on Availability)
- 17.2.6 IBM Corp
- 17.2.6.1. Overview
- 17.2.6.2. Products
- 17.2.6.3. SWOT Analysis
- 17.2.6.4. Recent Developments
- 17.2.6.5. Financials (Based on Availability)
- 17.2.7 Dell Inc
- 17.2.7.1. Overview
- 17.2.7.2. Products
- 17.2.7.3. SWOT Analysis
- 17.2.7.4. Recent Developments
- 17.2.7.5. Financials (Based on Availability)
- 17.2.8 Huawei Technologies Co Ltd
- 17.2.8.1. Overview
- 17.2.8.2. Products
- 17.2.8.3. SWOT Analysis
- 17.2.8.4. Recent Developments
- 17.2.8.5. Financials (Based on Availability)
- 17.2.9 Citrix Systems Inc
- 17.2.9.1. Overview
- 17.2.9.2. Products
- 17.2.9.3. SWOT Analysis
- 17.2.9.4. Recent Developments
- 17.2.9.5. Financials (Based on Availability)
- 17.2.10 Ericom Software
- 17.2.10.1. Overview
- 17.2.10.2. Products
- 17.2.10.3. SWOT Analysis
- 17.2.10.4. Recent Developments
- 17.2.10.5. Financials (Based on Availability)
- 17.2.1 Parallels International GmbH
List of Figures
- Figure 1: Global Desktop Virtualization in Manufacturing Market Revenue Breakdown (Million, %) by Region 2024 & 2032
- Figure 2: North America Desktop Virtualization in Manufacturing Market Revenue (Million), by Country 2024 & 2032
- Figure 3: North America Desktop Virtualization in Manufacturing Market Revenue Share (%), by Country 2024 & 2032
- Figure 4: Europe Desktop Virtualization in Manufacturing Market Revenue (Million), by Country 2024 & 2032
- Figure 5: Europe Desktop Virtualization in Manufacturing Market Revenue Share (%), by Country 2024 & 2032
- Figure 6: Asia Pacific Desktop Virtualization in Manufacturing Market Revenue (Million), by Country 2024 & 2032
- Figure 7: Asia Pacific Desktop Virtualization in Manufacturing Market Revenue Share (%), by Country 2024 & 2032
- Figure 8: South America Desktop Virtualization in Manufacturing Market Revenue (Million), by Country 2024 & 2032
- Figure 9: South America Desktop Virtualization in Manufacturing Market Revenue Share (%), by Country 2024 & 2032
- Figure 10: North America Desktop Virtualization in Manufacturing Market Revenue (Million), by Country 2024 & 2032
- Figure 11: North America Desktop Virtualization in Manufacturing Market Revenue Share (%), by Country 2024 & 2032
- Figure 12: MEA Desktop Virtualization in Manufacturing Market Revenue (Million), by Country 2024 & 2032
- Figure 13: MEA Desktop Virtualization in Manufacturing Market Revenue Share (%), by Country 2024 & 2032
- Figure 14: North America Desktop Virtualization in Manufacturing Market Revenue (Million), by Desktop Delivery Platform 2024 & 2032
- Figure 15: North America Desktop Virtualization in Manufacturing Market Revenue Share (%), by Desktop Delivery Platform 2024 & 2032
- Figure 16: North America Desktop Virtualization in Manufacturing Market Revenue (Million), by Deployment Mode 2024 & 2032
- Figure 17: North America Desktop Virtualization in Manufacturing Market Revenue Share (%), by Deployment Mode 2024 & 2032
- Figure 18: North America Desktop Virtualization in Manufacturing Market Revenue (Million), by Country 2024 & 2032
- Figure 19: North America Desktop Virtualization in Manufacturing Market Revenue Share (%), by Country 2024 & 2032
- Figure 20: Europe Desktop Virtualization in Manufacturing Market Revenue (Million), by Desktop Delivery Platform 2024 & 2032
- Figure 21: Europe Desktop Virtualization in Manufacturing Market Revenue Share (%), by Desktop Delivery Platform 2024 & 2032
- Figure 22: Europe Desktop Virtualization in Manufacturing Market Revenue (Million), by Deployment Mode 2024 & 2032
- Figure 23: Europe Desktop Virtualization in Manufacturing Market Revenue Share (%), by Deployment Mode 2024 & 2032
- Figure 24: Europe Desktop Virtualization in Manufacturing Market Revenue (Million), by Country 2024 & 2032
- Figure 25: Europe Desktop Virtualization in Manufacturing Market Revenue Share (%), by Country 2024 & 2032
- Figure 26: Asia Pacific Desktop Virtualization in Manufacturing Market Revenue (Million), by Desktop Delivery Platform 2024 & 2032
- Figure 27: Asia Pacific Desktop Virtualization in Manufacturing Market Revenue Share (%), by Desktop Delivery Platform 2024 & 2032
- Figure 28: Asia Pacific Desktop Virtualization in Manufacturing Market Revenue (Million), by Deployment Mode 2024 & 2032
- Figure 29: Asia Pacific Desktop Virtualization in Manufacturing Market Revenue Share (%), by Deployment Mode 2024 & 2032
- Figure 30: Asia Pacific Desktop Virtualization in Manufacturing Market Revenue (Million), by Country 2024 & 2032
- Figure 31: Asia Pacific Desktop Virtualization in Manufacturing Market Revenue Share (%), by Country 2024 & 2032
- Figure 32: Latin America Desktop Virtualization in Manufacturing Market Revenue (Million), by Desktop Delivery Platform 2024 & 2032
- Figure 33: Latin America Desktop Virtualization in Manufacturing Market Revenue Share (%), by Desktop Delivery Platform 2024 & 2032
- Figure 34: Latin America Desktop Virtualization in Manufacturing Market Revenue (Million), by Deployment Mode 2024 & 2032
- Figure 35: Latin America Desktop Virtualization in Manufacturing Market Revenue Share (%), by Deployment Mode 2024 & 2032
- Figure 36: Latin America Desktop Virtualization in Manufacturing Market Revenue (Million), by Country 2024 & 2032
- Figure 37: Latin America Desktop Virtualization in Manufacturing Market Revenue Share (%), by Country 2024 & 2032
- Figure 38: Middle East Desktop Virtualization in Manufacturing Market Revenue (Million), by Desktop Delivery Platform 2024 & 2032
- Figure 39: Middle East Desktop Virtualization in Manufacturing Market Revenue Share (%), by Desktop Delivery Platform 2024 & 2032
- Figure 40: Middle East Desktop Virtualization in Manufacturing Market Revenue (Million), by Deployment Mode 2024 & 2032
- Figure 41: Middle East Desktop Virtualization in Manufacturing Market Revenue Share (%), by Deployment Mode 2024 & 2032
- Figure 42: Middle East Desktop Virtualization in Manufacturing Market Revenue (Million), by Country 2024 & 2032
- Figure 43: Middle East Desktop Virtualization in Manufacturing Market Revenue Share (%), by Country 2024 & 2032
List of Tables
- Table 1: Global Desktop Virtualization in Manufacturing Market Revenue Million Forecast, by Region 2019 & 2032
- Table 2: Global Desktop Virtualization in Manufacturing Market Revenue Million Forecast, by Desktop Delivery Platform 2019 & 2032
- Table 3: Global Desktop Virtualization in Manufacturing Market Revenue Million Forecast, by Deployment Mode 2019 & 2032
- Table 4: Global Desktop Virtualization in Manufacturing Market Revenue Million Forecast, by Region 2019 & 2032
- Table 5: Global Desktop Virtualization in Manufacturing Market Revenue Million Forecast, by Country 2019 & 2032
- Table 6: United States Desktop Virtualization in Manufacturing Market Revenue (Million) Forecast, by Application 2019 & 2032
- Table 7: Canada Desktop Virtualization in Manufacturing Market Revenue (Million) Forecast, by Application 2019 & 2032
- Table 8: Mexico Desktop Virtualization in Manufacturing Market Revenue (Million) Forecast, by Application 2019 & 2032
- Table 9: Global Desktop Virtualization in Manufacturing Market Revenue Million Forecast, by Country 2019 & 2032
- Table 10: Germany Desktop Virtualization in Manufacturing Market Revenue (Million) Forecast, by Application 2019 & 2032
- Table 11: United Kingdom Desktop Virtualization in Manufacturing Market Revenue (Million) Forecast, by Application 2019 & 2032
- Table 12: France Desktop Virtualization in Manufacturing Market Revenue (Million) Forecast, by Application 2019 & 2032
- Table 13: Spain Desktop Virtualization in Manufacturing Market Revenue (Million) Forecast, by Application 2019 & 2032
- Table 14: Italy Desktop Virtualization in Manufacturing Market Revenue (Million) Forecast, by Application 2019 & 2032
- Table 15: Spain Desktop Virtualization in Manufacturing Market Revenue (Million) Forecast, by Application 2019 & 2032
- Table 16: Belgium Desktop Virtualization in Manufacturing Market Revenue (Million) Forecast, by Application 2019 & 2032
- Table 17: Netherland Desktop Virtualization in Manufacturing Market Revenue (Million) Forecast, by Application 2019 & 2032
- Table 18: Nordics Desktop Virtualization in Manufacturing Market Revenue (Million) Forecast, by Application 2019 & 2032
- Table 19: Rest of Europe Desktop Virtualization in Manufacturing Market Revenue (Million) Forecast, by Application 2019 & 2032
- Table 20: Global Desktop Virtualization in Manufacturing Market Revenue Million Forecast, by Country 2019 & 2032
- Table 21: China Desktop Virtualization in Manufacturing Market Revenue (Million) Forecast, by Application 2019 & 2032
- Table 22: Japan Desktop Virtualization in Manufacturing Market Revenue (Million) Forecast, by Application 2019 & 2032
- Table 23: India Desktop Virtualization in Manufacturing Market Revenue (Million) Forecast, by Application 2019 & 2032
- Table 24: South Korea Desktop Virtualization in Manufacturing Market Revenue (Million) Forecast, by Application 2019 & 2032
- Table 25: Southeast Asia Desktop Virtualization in Manufacturing Market Revenue (Million) Forecast, by Application 2019 & 2032
- Table 26: Australia Desktop Virtualization in Manufacturing Market Revenue (Million) Forecast, by Application 2019 & 2032
- Table 27: Indonesia Desktop Virtualization in Manufacturing Market Revenue (Million) Forecast, by Application 2019 & 2032
- Table 28: Phillipes Desktop Virtualization in Manufacturing Market Revenue (Million) Forecast, by Application 2019 & 2032
- Table 29: Singapore Desktop Virtualization in Manufacturing Market Revenue (Million) Forecast, by Application 2019 & 2032
- Table 30: Thailandc Desktop Virtualization in Manufacturing Market Revenue (Million) Forecast, by Application 2019 & 2032
- Table 31: Rest of Asia Pacific Desktop Virtualization in Manufacturing Market Revenue (Million) Forecast, by Application 2019 & 2032
- Table 32: Global Desktop Virtualization in Manufacturing Market Revenue Million Forecast, by Country 2019 & 2032
- Table 33: Brazil Desktop Virtualization in Manufacturing Market Revenue (Million) Forecast, by Application 2019 & 2032
- Table 34: Argentina Desktop Virtualization in Manufacturing Market Revenue (Million) Forecast, by Application 2019 & 2032
- Table 35: Peru Desktop Virtualization in Manufacturing Market Revenue (Million) Forecast, by Application 2019 & 2032
- Table 36: Chile Desktop Virtualization in Manufacturing Market Revenue (Million) Forecast, by Application 2019 & 2032
- Table 37: Colombia Desktop Virtualization in Manufacturing Market Revenue (Million) Forecast, by Application 2019 & 2032
- Table 38: Ecuador Desktop Virtualization in Manufacturing Market Revenue (Million) Forecast, by Application 2019 & 2032
- Table 39: Venezuela Desktop Virtualization in Manufacturing Market Revenue (Million) Forecast, by Application 2019 & 2032
- Table 40: Rest of South America Desktop Virtualization in Manufacturing Market Revenue (Million) Forecast, by Application 2019 & 2032
- Table 41: Global Desktop Virtualization in Manufacturing Market Revenue Million Forecast, by Country 2019 & 2032
- Table 42: United States Desktop Virtualization in Manufacturing Market Revenue (Million) Forecast, by Application 2019 & 2032
- Table 43: Canada Desktop Virtualization in Manufacturing Market Revenue (Million) Forecast, by Application 2019 & 2032
- Table 44: Mexico Desktop Virtualization in Manufacturing Market Revenue (Million) Forecast, by Application 2019 & 2032
- Table 45: Global Desktop Virtualization in Manufacturing Market Revenue Million Forecast, by Country 2019 & 2032
- Table 46: United Arab Emirates Desktop Virtualization in Manufacturing Market Revenue (Million) Forecast, by Application 2019 & 2032
- Table 47: Saudi Arabia Desktop Virtualization in Manufacturing Market Revenue (Million) Forecast, by Application 2019 & 2032
- Table 48: South Africa Desktop Virtualization in Manufacturing Market Revenue (Million) Forecast, by Application 2019 & 2032
- Table 49: Rest of Middle East and Africa Desktop Virtualization in Manufacturing Market Revenue (Million) Forecast, by Application 2019 & 2032
- Table 50: Global Desktop Virtualization in Manufacturing Market Revenue Million Forecast, by Desktop Delivery Platform 2019 & 2032
- Table 51: Global Desktop Virtualization in Manufacturing Market Revenue Million Forecast, by Deployment Mode 2019 & 2032
- Table 52: Global Desktop Virtualization in Manufacturing Market Revenue Million Forecast, by Country 2019 & 2032
- Table 53: Global Desktop Virtualization in Manufacturing Market Revenue Million Forecast, by Desktop Delivery Platform 2019 & 2032
- Table 54: Global Desktop Virtualization in Manufacturing Market Revenue Million Forecast, by Deployment Mode 2019 & 2032
- Table 55: Global Desktop Virtualization in Manufacturing Market Revenue Million Forecast, by Country 2019 & 2032
- Table 56: Global Desktop Virtualization in Manufacturing Market Revenue Million Forecast, by Desktop Delivery Platform 2019 & 2032
- Table 57: Global Desktop Virtualization in Manufacturing Market Revenue Million Forecast, by Deployment Mode 2019 & 2032
- Table 58: Global Desktop Virtualization in Manufacturing Market Revenue Million Forecast, by Country 2019 & 2032
- Table 59: Global Desktop Virtualization in Manufacturing Market Revenue Million Forecast, by Desktop Delivery Platform 2019 & 2032
- Table 60: Global Desktop Virtualization in Manufacturing Market Revenue Million Forecast, by Deployment Mode 2019 & 2032
- Table 61: Global Desktop Virtualization in Manufacturing Market Revenue Million Forecast, by Country 2019 & 2032
- Table 62: Global Desktop Virtualization in Manufacturing Market Revenue Million Forecast, by Desktop Delivery Platform 2019 & 2032
- Table 63: Global Desktop Virtualization in Manufacturing Market Revenue Million Forecast, by Deployment Mode 2019 & 2032
- Table 64: Global Desktop Virtualization in Manufacturing Market Revenue Million Forecast, by Country 2019 & 2032
Frequently Asked Questions
1. What is the projected Compound Annual Growth Rate (CAGR) of the Desktop Virtualization in Manufacturing Market?
The projected CAGR is approximately 12.90%.
2. Which companies are prominent players in the Desktop Virtualization in Manufacturing Market?
Key companies in the market include Parallels International GmbH, VMware Inc *List Not Exhaustive, NComputing Co LTD, Toshiba Corporation, Microsoft Corporation, IBM Corp, Dell Inc, Huawei Technologies Co Ltd, Citrix Systems Inc, Ericom Software.
3. What are the main segments of the Desktop Virtualization in Manufacturing Market?
The market segments include Desktop Delivery Platform, Deployment Mode.
4. Can you provide details about the market size?
The market size is estimated to be USD 7.93 Million as of 2022.
5. What are some drivers contributing to market growth?
Growing Adoption of Cloud Computing; Cost Saving in Desktop/PC.
6. What are the notable trends driving market growth?
Cloud Deployment Mode to Gain Significant Share.
7. Are there any restraints impacting market growth?
Infrastructural Constraints.
8. Can you provide examples of recent developments in the market?
March 2023: Microsoft Corporation introduced a new version of Azure Stack HCI Solutions, which was introduced in March 2019. The most recent version of the operating system for the Azure Stack HCI solution is version "22H2", which focuses on network ATC v2 enhancements, storage replication compression, Hyper-V live migration, and other things. On servers running the 22H2 OS, Azure Stack HCI's supplemental package preview version is also available and can be installed.
9. What pricing options are available for accessing the report?
Pricing options include single-user, multi-user, and enterprise licenses priced at USD 4750, USD 5250, and USD 8750 respectively.
10. Is the market size provided in terms of value or volume?
The market size is provided in terms of value, measured in Million.
11. Are there any specific market keywords associated with the report?
Yes, the market keyword associated with the report is "Desktop Virtualization in Manufacturing Market," which aids in identifying and referencing the specific market segment covered.
12. How do I determine which pricing option suits my needs best?
The pricing options vary based on user requirements and access needs. Individual users may opt for single-user licenses, while businesses requiring broader access may choose multi-user or enterprise licenses for cost-effective access to the report.
13. Are there any additional resources or data provided in the Desktop Virtualization in Manufacturing Market report?
While the report offers comprehensive insights, it's advisable to review the specific contents or supplementary materials provided to ascertain if additional resources or data are available.
14. How can I stay updated on further developments or reports in the Desktop Virtualization in Manufacturing Market?
To stay informed about further developments, trends, and reports in the Desktop Virtualization in Manufacturing Market, consider subscribing to industry newsletters, following relevant companies and organizations, or regularly checking reputable industry news sources and publications.
Methodology
Step 1 - Identification of Relevant Samples Size from Population Database


Step 2 - Approaches for Defining Global Market Size (Value, Volume* & Price*)

Note*: In applicable scenarios
Step 3 - Data Sources
Primary Research
- Web Analytics
- Survey Reports
- Research Institute
- Latest Research Reports
- Opinion Leaders
Secondary Research
- Annual Reports
- White Paper
- Latest Press Release
- Industry Association
- Paid Database
- Investor Presentations

Step 4 - Data Triangulation
Involves using different sources of information in order to increase the validity of a study
These sources are likely to be stakeholders in a program - participants, other researchers, program staff, other community members, and so on.
Then we put all data in single framework & apply various statistical tools to find out the dynamic on the market.
During the analysis stage, feedback from the stakeholder groups would be compared to determine areas of agreement as well as areas of divergence
