

Key Insights
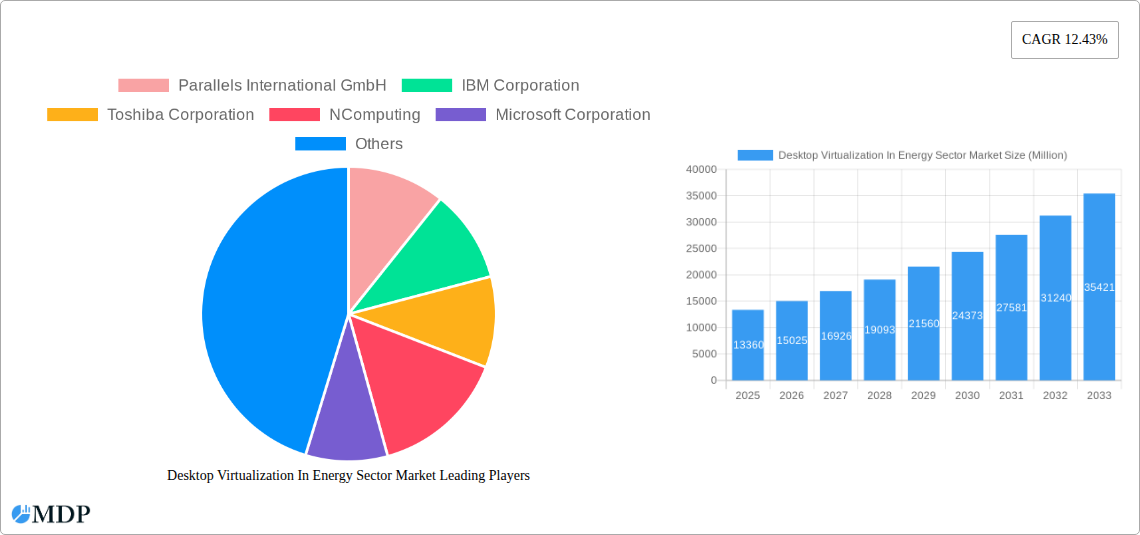
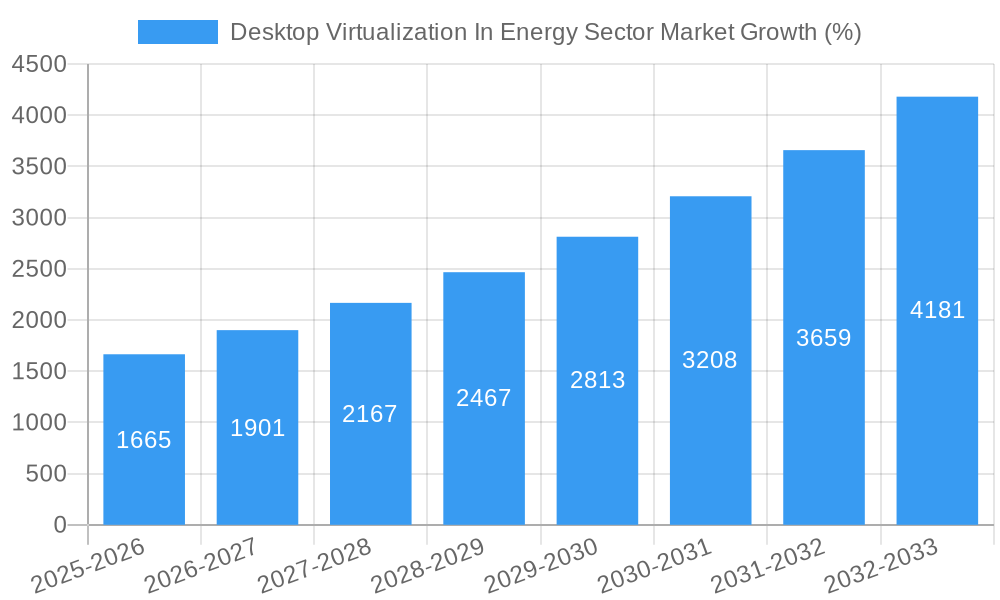
The Desktop Virtualization in the Energy Sector market is experiencing robust growth, projected to reach a market size of $13.36 billion in 2025, expanding at a Compound Annual Growth Rate (CAGR) of 12.43%. This surge is fueled by several key drivers. The increasing need for enhanced security and data protection within energy companies, coupled with the rising adoption of remote work models and the demand for improved operational efficiency, are significantly propelling market expansion. The inherent vulnerabilities of traditional on-premise infrastructure to cyber threats are driving energy firms towards the security and scalability of virtualized desktop environments. Furthermore, the ability to deploy and manage desktops centrally, reducing IT management overhead and costs, is a significant advantage. The transition to cloud-based deployment models is also accelerating growth, offering flexibility, scalability, and cost-effectiveness, particularly beneficial for geographically dispersed energy operations. The market segments, including Hosted Virtual Desktop (HVD), Hosted Shared Desktop (HSD), on-premise, and cloud deployment modes, are all contributing to the overall market expansion, albeit at varying rates.
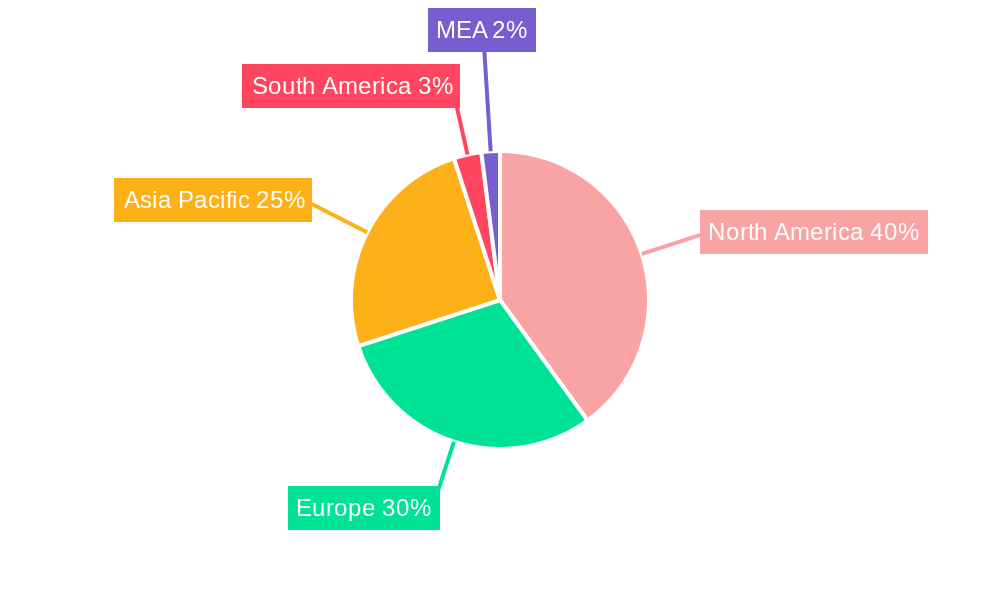
Significant regional variations exist in market adoption. North America, particularly the United States, is expected to hold a substantial market share, driven by early adoption of advanced technologies and the presence of major technology vendors. However, the Asia-Pacific region, especially China and India, is projected to witness the fastest growth due to increasing digitalization efforts and investments in infrastructure within the energy sector. Europe also presents a significant market opportunity, with countries like Germany and the UK leading adoption. The competitive landscape is characterized by a mix of established players like Citrix, VMware, and Microsoft, and specialized providers like Parallels and NComputing. The ongoing innovation in virtualization technologies, focusing on improved performance, security, and integration with existing energy infrastructure, will further shape market dynamics over the forecast period (2025-2033). While challenges such as initial investment costs and the need for robust network infrastructure might pose some restraints, the long-term benefits of enhanced security, efficiency, and scalability are expected to outweigh these concerns, ensuring sustained growth in the market.
Desktop Virtualization in Energy Sector Market: A Comprehensive Report (2019-2033)
This comprehensive report provides a detailed analysis of the Desktop Virtualization in Energy Sector Market, offering invaluable insights for stakeholders, investors, and industry professionals. The study period covers 2019-2033, with a focus on the forecast period (2025-2033), using 2025 as the base and estimated year. The report analyzes market dynamics, leading players, technological advancements, and future growth potential, leveraging extensive data and expert analysis to paint a clear picture of this evolving landscape. Expect detailed breakdowns of market segments, including By Desktop Delivery Platform (Hosted Virtual Desktop (HVD), Hosted Shared Desktop (HSD)) and By Deployment Mode (On-Premise, Cloud). The report projects a market size of xx Million by 2033, with a CAGR of xx% during the forecast period.
Desktop Virtualization In Energy Sector Market Market Dynamics & Concentration
The Desktop Virtualization in Energy Sector Market is experiencing significant growth driven by increasing demand for secure, scalable, and cost-effective solutions. Market concentration is moderate, with key players like Citrix, VMware, and Microsoft holding substantial market share, but several smaller players also contribute significantly. The market share of the top 5 players is estimated at xx%. Innovation in areas such as enhanced security features, improved user experience, and cloud-based solutions fuels market growth. Stringent regulatory frameworks concerning data security and compliance within the energy sector are driving the adoption of robust virtualization solutions. While physical desktop solutions still exist, the market is shifting rapidly towards virtualization due to its cost-effectiveness and remote work capabilities. Mergers and acquisitions (M&A) are common, with approximately xx M&A deals recorded between 2019 and 2024. End-user trends point towards a preference for cloud-based solutions due to their flexibility and scalability.
- Market Concentration: Moderately concentrated, with top 5 players holding xx% market share.
- Innovation Drivers: Enhanced security, improved UX, cloud-based solutions.
- Regulatory Frameworks: Stringent data security and compliance regulations.
- Product Substitutes: Physical desktop solutions (decreasing market share).
- End-User Trends: Preference for cloud-based solutions for flexibility and scalability.
- M&A Activities: Approximately xx M&A deals between 2019 and 2024.
Desktop Virtualization In Energy Sector Market Industry Trends & Analysis
The Desktop Virtualization in Energy Sector Market demonstrates robust growth, propelled by the energy industry's increasing need for efficient, secure, and remotely accessible computing environments. The market is experiencing a significant shift towards cloud-based deployment models, driven by their scalability, cost-effectiveness, and ease of management. The rising adoption of hybrid work models is further fueling this trend. Technological disruptions, such as advancements in AI and machine learning, are enhancing the capabilities of virtualization solutions, improving security, and optimizing resource allocation. Consumer preferences increasingly lean towards user-friendly interfaces and seamless integration with existing IT infrastructure. Competitive dynamics are intense, with established players continually innovating and smaller players vying for market share through specialized solutions and competitive pricing. The market is projected to reach xx Million by 2033, exhibiting a CAGR of xx% during the forecast period, and market penetration is expected to increase from xx% in 2025 to xx% in 2033.
Leading Markets & Segments in Desktop Virtualization In Energy Sector Market
The North American market currently dominates the Desktop Virtualization in Energy Sector Market, driven by strong technological advancements, robust infrastructure, and early adoption of virtualization technologies. Within the segments, the Hosted Virtual Desktop (HVD) platform holds a significant share compared to Hosted Shared Desktop (HSD), and Cloud deployment is rapidly surpassing on-premise deployments due to its flexibility and cost savings.
Key Drivers of North American Dominance:
- Strong technological infrastructure.
- Early adoption of virtualization technologies.
- High investment in IT infrastructure.
- Favorable regulatory environment.
Segment Analysis:
- Hosted Virtual Desktop (HVD): High market share due to enhanced security and performance.
- Hosted Shared Desktop (HSD): Cost-effective solution, gaining traction in specific use cases.
- Cloud Deployment: Rapid growth due to scalability, flexibility, and cost efficiency.
- On-Premise Deployment: Declining market share due to cloud adoption.
The European market is expected to exhibit strong growth in the coming years, driven by government initiatives promoting digitalization within the energy sector. Asia-Pacific is also poised for rapid expansion, spurred by increasing IT spending and growing adoption of cloud computing.
Desktop Virtualization In Energy Sector Market Product Developments
Recent product innovations focus on enhancing security features, improving user experience, and expanding compatibility with diverse operating systems and devices. Key developments include improved application streaming, enhanced remote access capabilities, and integration with AI and machine learning for advanced threat detection and resource optimization. These advancements aim to provide a more seamless and secure user experience, making desktop virtualization an increasingly attractive solution for energy sector companies. This aligns with the market's strong demand for robust and user-friendly virtualization solutions.
Key Drivers of Desktop Virtualization In Energy Sector Market Growth
The growth of the Desktop Virtualization in Energy Sector Market is fueled by several key factors. Firstly, the rising need for enhanced data security and compliance in the energy industry necessitates robust virtualization solutions. Secondly, the increasing adoption of remote work models and the need for flexible access to sensitive data are driving demand for cloud-based desktop virtualization platforms. Thirdly, advancements in virtualization technologies, such as improved performance, scalability, and user experience, are making it a more attractive option. Finally, cost optimization through reduced IT infrastructure expenses and efficient resource allocation is a significant driver.
Challenges in the Desktop Virtualization In Energy Sector Market Market
Several challenges impede the market's growth. High initial investment costs can be a barrier for smaller energy companies. Concerns around data security and compliance, despite advancements, remain a concern. Integration complexities with existing legacy systems can also hamper adoption. Lastly, competition from established players and emerging vendors creates a dynamic and potentially challenging landscape for market participants. The impact of these factors could be a reduction in the projected xx Million market size by an estimated xx Million if not adequately addressed.
Emerging Opportunities in Desktop Virtualization In Energy Sector Market
The long-term growth of the Desktop Virtualization in Energy Sector Market hinges on leveraging technological advancements, such as AI-driven security enhancements and the integration of edge computing. Strategic partnerships between virtualization providers and energy companies can facilitate seamless integration and customized solutions. Expanding into new geographic markets, especially in emerging economies with growing energy sectors, presents significant expansion opportunities. Focusing on user experience and ease of adoption will unlock significant market growth.
Leading Players in the Desktop Virtualization In Energy Sector Market Sector
- Parallels International GmbH
- IBM Corporation
- Toshiba Corporation
- NComputing
- Microsoft Corporation
- Dell Inc
- Huawei Technologies Co Ltd
- Ericom Software Inc
- Citrix Systems Inc
- Vmware Inc
Key Milestones in Desktop Virtualization In Energy Sector Market Industry
- May 2022: Citrix Systems, Inc. announced a collaboration with Microsoft to integrate Citrix's HDX technology with Windows 365, enhancing user experience and streamlining IT management. This significantly improved the competitiveness of Citrix's offerings and accelerated market adoption of cloud-based solutions.
- September 2022: Amazon Web Services Inc. updated Amazon Workspaces, adding support for Ubuntu virtual desktops and Workspaces Core. This expanded the platform's accessibility and versatility, attracting new customers and driving growth.
Strategic Outlook for Desktop Virtualization In Energy Sector Market Market
The Desktop Virtualization in Energy Sector Market is poised for continued growth, driven by technological advancements, increasing adoption of cloud-based solutions, and the expanding need for secure and efficient computing environments within the energy sector. Strategic partnerships, targeted marketing initiatives towards specific segments, and continuous innovation in security and user experience will be crucial for success. Focusing on delivering tailored solutions that address the unique needs of the energy sector will be key to unlocking the substantial growth potential of this market.
Desktop Virtualization In Energy Sector Market Segmentation
-
1. Desktop Delivery Platform
- 1.1. Hosted Virtual Desktop (HVD)
- 1.2. Hosted Shared Desktop (HSD)
-
2. Deployment Mode
- 2.1. On-Premise
- 2.2. Cloud
Desktop Virtualization In Energy Sector Market Segmentation By Geography
- 1. North America
- 2. Europe
- 3. Asia
- 4. Australia and New Zealand
Desktop Virtualization In Energy Sector Market REPORT HIGHLIGHTS
| Aspects | Details |
|---|---|
| Study Period | 2019-2033 |
| Base Year | 2024 |
| Estimated Year | 2025 |
| Forecast Period | 2025-2033 |
| Historical Period | 2019-2024 |
| Growth Rate | CAGR of 12.43% from 2019-2033 |
| Segmentation |
|
Table of Contents
- 1. Introduction
- 1.1. Research Scope
- 1.2. Market Segmentation
- 1.3. Research Methodology
- 1.4. Definitions and Assumptions
- 2. Executive Summary
- 2.1. Introduction
- 3. Market Dynamics
- 3.1. Introduction
- 3.2. Market Drivers
- 3.2.1. Growing Adoption of Cloud and Need for Remote Accessibility is Driving the Market Growth
- 3.3. Market Restrains
- 3.3.1. Infrastructural Constraints is Discouraging the Market Expansion
- 3.4. Market Trends
- 3.4.1. Cloud Deployment Mode Segment is Expected to Hold Significant Market Share
- 4. Market Factor Analysis
- 4.1. Porters Five Forces
- 4.2. Supply/Value Chain
- 4.3. PESTEL analysis
- 4.4. Market Entropy
- 4.5. Patent/Trademark Analysis
- 5. Global Desktop Virtualization In Energy Sector Market Analysis, Insights and Forecast, 2019-2031
- 5.1. Market Analysis, Insights and Forecast - by Desktop Delivery Platform
- 5.1.1. Hosted Virtual Desktop (HVD)
- 5.1.2. Hosted Shared Desktop (HSD)
- 5.2. Market Analysis, Insights and Forecast - by Deployment Mode
- 5.2.1. On-Premise
- 5.2.2. Cloud
- 5.3. Market Analysis, Insights and Forecast - by Region
- 5.3.1. North America
- 5.3.2. Europe
- 5.3.3. Asia
- 5.3.4. Australia and New Zealand
- 5.1. Market Analysis, Insights and Forecast - by Desktop Delivery Platform
- 6. North America Desktop Virtualization In Energy Sector Market Analysis, Insights and Forecast, 2019-2031
- 6.1. Market Analysis, Insights and Forecast - by Desktop Delivery Platform
- 6.1.1. Hosted Virtual Desktop (HVD)
- 6.1.2. Hosted Shared Desktop (HSD)
- 6.2. Market Analysis, Insights and Forecast - by Deployment Mode
- 6.2.1. On-Premise
- 6.2.2. Cloud
- 6.1. Market Analysis, Insights and Forecast - by Desktop Delivery Platform
- 7. Europe Desktop Virtualization In Energy Sector Market Analysis, Insights and Forecast, 2019-2031
- 7.1. Market Analysis, Insights and Forecast - by Desktop Delivery Platform
- 7.1.1. Hosted Virtual Desktop (HVD)
- 7.1.2. Hosted Shared Desktop (HSD)
- 7.2. Market Analysis, Insights and Forecast - by Deployment Mode
- 7.2.1. On-Premise
- 7.2.2. Cloud
- 7.1. Market Analysis, Insights and Forecast - by Desktop Delivery Platform
- 8. Asia Desktop Virtualization In Energy Sector Market Analysis, Insights and Forecast, 2019-2031
- 8.1. Market Analysis, Insights and Forecast - by Desktop Delivery Platform
- 8.1.1. Hosted Virtual Desktop (HVD)
- 8.1.2. Hosted Shared Desktop (HSD)
- 8.2. Market Analysis, Insights and Forecast - by Deployment Mode
- 8.2.1. On-Premise
- 8.2.2. Cloud
- 8.1. Market Analysis, Insights and Forecast - by Desktop Delivery Platform
- 9. Australia and New Zealand Desktop Virtualization In Energy Sector Market Analysis, Insights and Forecast, 2019-2031
- 9.1. Market Analysis, Insights and Forecast - by Desktop Delivery Platform
- 9.1.1. Hosted Virtual Desktop (HVD)
- 9.1.2. Hosted Shared Desktop (HSD)
- 9.2. Market Analysis, Insights and Forecast - by Deployment Mode
- 9.2.1. On-Premise
- 9.2.2. Cloud
- 9.1. Market Analysis, Insights and Forecast - by Desktop Delivery Platform
- 10. North America Desktop Virtualization In Energy Sector Market Analysis, Insights and Forecast, 2019-2031
- 10.1. Market Analysis, Insights and Forecast - By Country/Sub-region
- 10.1.1 United States
- 10.1.2 Canada
- 10.1.3 Mexico
- 11. Europe Desktop Virtualization In Energy Sector Market Analysis, Insights and Forecast, 2019-2031
- 11.1. Market Analysis, Insights and Forecast - By Country/Sub-region
- 11.1.1 Germany
- 11.1.2 United Kingdom
- 11.1.3 France
- 11.1.4 Spain
- 11.1.5 Italy
- 11.1.6 Spain
- 11.1.7 Belgium
- 11.1.8 Netherland
- 11.1.9 Nordics
- 11.1.10 Rest of Europe
- 12. Asia Pacific Desktop Virtualization In Energy Sector Market Analysis, Insights and Forecast, 2019-2031
- 12.1. Market Analysis, Insights and Forecast - By Country/Sub-region
- 12.1.1 China
- 12.1.2 Japan
- 12.1.3 India
- 12.1.4 South Korea
- 12.1.5 Southeast Asia
- 12.1.6 Australia
- 12.1.7 Indonesia
- 12.1.8 Phillipes
- 12.1.9 Singapore
- 12.1.10 Thailandc
- 12.1.11 Rest of Asia Pacific
- 13. South America Desktop Virtualization In Energy Sector Market Analysis, Insights and Forecast, 2019-2031
- 13.1. Market Analysis, Insights and Forecast - By Country/Sub-region
- 13.1.1 Brazil
- 13.1.2 Argentina
- 13.1.3 Peru
- 13.1.4 Chile
- 13.1.5 Colombia
- 13.1.6 Ecuador
- 13.1.7 Venezuela
- 13.1.8 Rest of South America
- 14. North America Desktop Virtualization In Energy Sector Market Analysis, Insights and Forecast, 2019-2031
- 14.1. Market Analysis, Insights and Forecast - By Country/Sub-region
- 14.1.1 United States
- 14.1.2 Canada
- 14.1.3 Mexico
- 15. MEA Desktop Virtualization In Energy Sector Market Analysis, Insights and Forecast, 2019-2031
- 15.1. Market Analysis, Insights and Forecast - By Country/Sub-region
- 15.1.1 United Arab Emirates
- 15.1.2 Saudi Arabia
- 15.1.3 South Africa
- 15.1.4 Rest of Middle East and Africa
- 16. Competitive Analysis
- 16.1. Global Market Share Analysis 2024
- 16.2. Company Profiles
- 16.2.1 Parallels International GmbH
- 16.2.1.1. Overview
- 16.2.1.2. Products
- 16.2.1.3. SWOT Analysis
- 16.2.1.4. Recent Developments
- 16.2.1.5. Financials (Based on Availability)
- 16.2.2 IBM Corporation
- 16.2.2.1. Overview
- 16.2.2.2. Products
- 16.2.2.3. SWOT Analysis
- 16.2.2.4. Recent Developments
- 16.2.2.5. Financials (Based on Availability)
- 16.2.3 Toshiba Corporation
- 16.2.3.1. Overview
- 16.2.3.2. Products
- 16.2.3.3. SWOT Analysis
- 16.2.3.4. Recent Developments
- 16.2.3.5. Financials (Based on Availability)
- 16.2.4 NComputing
- 16.2.4.1. Overview
- 16.2.4.2. Products
- 16.2.4.3. SWOT Analysis
- 16.2.4.4. Recent Developments
- 16.2.4.5. Financials (Based on Availability)
- 16.2.5 Microsoft Corporation
- 16.2.5.1. Overview
- 16.2.5.2. Products
- 16.2.5.3. SWOT Analysis
- 16.2.5.4. Recent Developments
- 16.2.5.5. Financials (Based on Availability)
- 16.2.6 Dell Inc
- 16.2.6.1. Overview
- 16.2.6.2. Products
- 16.2.6.3. SWOT Analysis
- 16.2.6.4. Recent Developments
- 16.2.6.5. Financials (Based on Availability)
- 16.2.7 Huawei Technologies Co Ltd
- 16.2.7.1. Overview
- 16.2.7.2. Products
- 16.2.7.3. SWOT Analysis
- 16.2.7.4. Recent Developments
- 16.2.7.5. Financials (Based on Availability)
- 16.2.8 Ericom Software Inc
- 16.2.8.1. Overview
- 16.2.8.2. Products
- 16.2.8.3. SWOT Analysis
- 16.2.8.4. Recent Developments
- 16.2.8.5. Financials (Based on Availability)
- 16.2.9 Citrix Systems Inc
- 16.2.9.1. Overview
- 16.2.9.2. Products
- 16.2.9.3. SWOT Analysis
- 16.2.9.4. Recent Developments
- 16.2.9.5. Financials (Based on Availability)
- 16.2.10 Vmware Inc
- 16.2.10.1. Overview
- 16.2.10.2. Products
- 16.2.10.3. SWOT Analysis
- 16.2.10.4. Recent Developments
- 16.2.10.5. Financials (Based on Availability)
- 16.2.1 Parallels International GmbH
List of Figures
- Figure 1: Global Desktop Virtualization In Energy Sector Market Revenue Breakdown (Million, %) by Region 2024 & 2032
- Figure 2: North America Desktop Virtualization In Energy Sector Market Revenue (Million), by Country 2024 & 2032
- Figure 3: North America Desktop Virtualization In Energy Sector Market Revenue Share (%), by Country 2024 & 2032
- Figure 4: Europe Desktop Virtualization In Energy Sector Market Revenue (Million), by Country 2024 & 2032
- Figure 5: Europe Desktop Virtualization In Energy Sector Market Revenue Share (%), by Country 2024 & 2032
- Figure 6: Asia Pacific Desktop Virtualization In Energy Sector Market Revenue (Million), by Country 2024 & 2032
- Figure 7: Asia Pacific Desktop Virtualization In Energy Sector Market Revenue Share (%), by Country 2024 & 2032
- Figure 8: South America Desktop Virtualization In Energy Sector Market Revenue (Million), by Country 2024 & 2032
- Figure 9: South America Desktop Virtualization In Energy Sector Market Revenue Share (%), by Country 2024 & 2032
- Figure 10: North America Desktop Virtualization In Energy Sector Market Revenue (Million), by Country 2024 & 2032
- Figure 11: North America Desktop Virtualization In Energy Sector Market Revenue Share (%), by Country 2024 & 2032
- Figure 12: MEA Desktop Virtualization In Energy Sector Market Revenue (Million), by Country 2024 & 2032
- Figure 13: MEA Desktop Virtualization In Energy Sector Market Revenue Share (%), by Country 2024 & 2032
- Figure 14: North America Desktop Virtualization In Energy Sector Market Revenue (Million), by Desktop Delivery Platform 2024 & 2032
- Figure 15: North America Desktop Virtualization In Energy Sector Market Revenue Share (%), by Desktop Delivery Platform 2024 & 2032
- Figure 16: North America Desktop Virtualization In Energy Sector Market Revenue (Million), by Deployment Mode 2024 & 2032
- Figure 17: North America Desktop Virtualization In Energy Sector Market Revenue Share (%), by Deployment Mode 2024 & 2032
- Figure 18: North America Desktop Virtualization In Energy Sector Market Revenue (Million), by Country 2024 & 2032
- Figure 19: North America Desktop Virtualization In Energy Sector Market Revenue Share (%), by Country 2024 & 2032
- Figure 20: Europe Desktop Virtualization In Energy Sector Market Revenue (Million), by Desktop Delivery Platform 2024 & 2032
- Figure 21: Europe Desktop Virtualization In Energy Sector Market Revenue Share (%), by Desktop Delivery Platform 2024 & 2032
- Figure 22: Europe Desktop Virtualization In Energy Sector Market Revenue (Million), by Deployment Mode 2024 & 2032
- Figure 23: Europe Desktop Virtualization In Energy Sector Market Revenue Share (%), by Deployment Mode 2024 & 2032
- Figure 24: Europe Desktop Virtualization In Energy Sector Market Revenue (Million), by Country 2024 & 2032
- Figure 25: Europe Desktop Virtualization In Energy Sector Market Revenue Share (%), by Country 2024 & 2032
- Figure 26: Asia Desktop Virtualization In Energy Sector Market Revenue (Million), by Desktop Delivery Platform 2024 & 2032
- Figure 27: Asia Desktop Virtualization In Energy Sector Market Revenue Share (%), by Desktop Delivery Platform 2024 & 2032
- Figure 28: Asia Desktop Virtualization In Energy Sector Market Revenue (Million), by Deployment Mode 2024 & 2032
- Figure 29: Asia Desktop Virtualization In Energy Sector Market Revenue Share (%), by Deployment Mode 2024 & 2032
- Figure 30: Asia Desktop Virtualization In Energy Sector Market Revenue (Million), by Country 2024 & 2032
- Figure 31: Asia Desktop Virtualization In Energy Sector Market Revenue Share (%), by Country 2024 & 2032
- Figure 32: Australia and New Zealand Desktop Virtualization In Energy Sector Market Revenue (Million), by Desktop Delivery Platform 2024 & 2032
- Figure 33: Australia and New Zealand Desktop Virtualization In Energy Sector Market Revenue Share (%), by Desktop Delivery Platform 2024 & 2032
- Figure 34: Australia and New Zealand Desktop Virtualization In Energy Sector Market Revenue (Million), by Deployment Mode 2024 & 2032
- Figure 35: Australia and New Zealand Desktop Virtualization In Energy Sector Market Revenue Share (%), by Deployment Mode 2024 & 2032
- Figure 36: Australia and New Zealand Desktop Virtualization In Energy Sector Market Revenue (Million), by Country 2024 & 2032
- Figure 37: Australia and New Zealand Desktop Virtualization In Energy Sector Market Revenue Share (%), by Country 2024 & 2032
List of Tables
- Table 1: Global Desktop Virtualization In Energy Sector Market Revenue Million Forecast, by Region 2019 & 2032
- Table 2: Global Desktop Virtualization In Energy Sector Market Revenue Million Forecast, by Desktop Delivery Platform 2019 & 2032
- Table 3: Global Desktop Virtualization In Energy Sector Market Revenue Million Forecast, by Deployment Mode 2019 & 2032
- Table 4: Global Desktop Virtualization In Energy Sector Market Revenue Million Forecast, by Region 2019 & 2032
- Table 5: Global Desktop Virtualization In Energy Sector Market Revenue Million Forecast, by Country 2019 & 2032
- Table 6: United States Desktop Virtualization In Energy Sector Market Revenue (Million) Forecast, by Application 2019 & 2032
- Table 7: Canada Desktop Virtualization In Energy Sector Market Revenue (Million) Forecast, by Application 2019 & 2032
- Table 8: Mexico Desktop Virtualization In Energy Sector Market Revenue (Million) Forecast, by Application 2019 & 2032
- Table 9: Global Desktop Virtualization In Energy Sector Market Revenue Million Forecast, by Country 2019 & 2032
- Table 10: Germany Desktop Virtualization In Energy Sector Market Revenue (Million) Forecast, by Application 2019 & 2032
- Table 11: United Kingdom Desktop Virtualization In Energy Sector Market Revenue (Million) Forecast, by Application 2019 & 2032
- Table 12: France Desktop Virtualization In Energy Sector Market Revenue (Million) Forecast, by Application 2019 & 2032
- Table 13: Spain Desktop Virtualization In Energy Sector Market Revenue (Million) Forecast, by Application 2019 & 2032
- Table 14: Italy Desktop Virtualization In Energy Sector Market Revenue (Million) Forecast, by Application 2019 & 2032
- Table 15: Spain Desktop Virtualization In Energy Sector Market Revenue (Million) Forecast, by Application 2019 & 2032
- Table 16: Belgium Desktop Virtualization In Energy Sector Market Revenue (Million) Forecast, by Application 2019 & 2032
- Table 17: Netherland Desktop Virtualization In Energy Sector Market Revenue (Million) Forecast, by Application 2019 & 2032
- Table 18: Nordics Desktop Virtualization In Energy Sector Market Revenue (Million) Forecast, by Application 2019 & 2032
- Table 19: Rest of Europe Desktop Virtualization In Energy Sector Market Revenue (Million) Forecast, by Application 2019 & 2032
- Table 20: Global Desktop Virtualization In Energy Sector Market Revenue Million Forecast, by Country 2019 & 2032
- Table 21: China Desktop Virtualization In Energy Sector Market Revenue (Million) Forecast, by Application 2019 & 2032
- Table 22: Japan Desktop Virtualization In Energy Sector Market Revenue (Million) Forecast, by Application 2019 & 2032
- Table 23: India Desktop Virtualization In Energy Sector Market Revenue (Million) Forecast, by Application 2019 & 2032
- Table 24: South Korea Desktop Virtualization In Energy Sector Market Revenue (Million) Forecast, by Application 2019 & 2032
- Table 25: Southeast Asia Desktop Virtualization In Energy Sector Market Revenue (Million) Forecast, by Application 2019 & 2032
- Table 26: Australia Desktop Virtualization In Energy Sector Market Revenue (Million) Forecast, by Application 2019 & 2032
- Table 27: Indonesia Desktop Virtualization In Energy Sector Market Revenue (Million) Forecast, by Application 2019 & 2032
- Table 28: Phillipes Desktop Virtualization In Energy Sector Market Revenue (Million) Forecast, by Application 2019 & 2032
- Table 29: Singapore Desktop Virtualization In Energy Sector Market Revenue (Million) Forecast, by Application 2019 & 2032
- Table 30: Thailandc Desktop Virtualization In Energy Sector Market Revenue (Million) Forecast, by Application 2019 & 2032
- Table 31: Rest of Asia Pacific Desktop Virtualization In Energy Sector Market Revenue (Million) Forecast, by Application 2019 & 2032
- Table 32: Global Desktop Virtualization In Energy Sector Market Revenue Million Forecast, by Country 2019 & 2032
- Table 33: Brazil Desktop Virtualization In Energy Sector Market Revenue (Million) Forecast, by Application 2019 & 2032
- Table 34: Argentina Desktop Virtualization In Energy Sector Market Revenue (Million) Forecast, by Application 2019 & 2032
- Table 35: Peru Desktop Virtualization In Energy Sector Market Revenue (Million) Forecast, by Application 2019 & 2032
- Table 36: Chile Desktop Virtualization In Energy Sector Market Revenue (Million) Forecast, by Application 2019 & 2032
- Table 37: Colombia Desktop Virtualization In Energy Sector Market Revenue (Million) Forecast, by Application 2019 & 2032
- Table 38: Ecuador Desktop Virtualization In Energy Sector Market Revenue (Million) Forecast, by Application 2019 & 2032
- Table 39: Venezuela Desktop Virtualization In Energy Sector Market Revenue (Million) Forecast, by Application 2019 & 2032
- Table 40: Rest of South America Desktop Virtualization In Energy Sector Market Revenue (Million) Forecast, by Application 2019 & 2032
- Table 41: Global Desktop Virtualization In Energy Sector Market Revenue Million Forecast, by Country 2019 & 2032
- Table 42: United States Desktop Virtualization In Energy Sector Market Revenue (Million) Forecast, by Application 2019 & 2032
- Table 43: Canada Desktop Virtualization In Energy Sector Market Revenue (Million) Forecast, by Application 2019 & 2032
- Table 44: Mexico Desktop Virtualization In Energy Sector Market Revenue (Million) Forecast, by Application 2019 & 2032
- Table 45: Global Desktop Virtualization In Energy Sector Market Revenue Million Forecast, by Country 2019 & 2032
- Table 46: United Arab Emirates Desktop Virtualization In Energy Sector Market Revenue (Million) Forecast, by Application 2019 & 2032
- Table 47: Saudi Arabia Desktop Virtualization In Energy Sector Market Revenue (Million) Forecast, by Application 2019 & 2032
- Table 48: South Africa Desktop Virtualization In Energy Sector Market Revenue (Million) Forecast, by Application 2019 & 2032
- Table 49: Rest of Middle East and Africa Desktop Virtualization In Energy Sector Market Revenue (Million) Forecast, by Application 2019 & 2032
- Table 50: Global Desktop Virtualization In Energy Sector Market Revenue Million Forecast, by Desktop Delivery Platform 2019 & 2032
- Table 51: Global Desktop Virtualization In Energy Sector Market Revenue Million Forecast, by Deployment Mode 2019 & 2032
- Table 52: Global Desktop Virtualization In Energy Sector Market Revenue Million Forecast, by Country 2019 & 2032
- Table 53: Global Desktop Virtualization In Energy Sector Market Revenue Million Forecast, by Desktop Delivery Platform 2019 & 2032
- Table 54: Global Desktop Virtualization In Energy Sector Market Revenue Million Forecast, by Deployment Mode 2019 & 2032
- Table 55: Global Desktop Virtualization In Energy Sector Market Revenue Million Forecast, by Country 2019 & 2032
- Table 56: Global Desktop Virtualization In Energy Sector Market Revenue Million Forecast, by Desktop Delivery Platform 2019 & 2032
- Table 57: Global Desktop Virtualization In Energy Sector Market Revenue Million Forecast, by Deployment Mode 2019 & 2032
- Table 58: Global Desktop Virtualization In Energy Sector Market Revenue Million Forecast, by Country 2019 & 2032
- Table 59: Global Desktop Virtualization In Energy Sector Market Revenue Million Forecast, by Desktop Delivery Platform 2019 & 2032
- Table 60: Global Desktop Virtualization In Energy Sector Market Revenue Million Forecast, by Deployment Mode 2019 & 2032
- Table 61: Global Desktop Virtualization In Energy Sector Market Revenue Million Forecast, by Country 2019 & 2032
Frequently Asked Questions
1. What is the projected Compound Annual Growth Rate (CAGR) of the Desktop Virtualization In Energy Sector Market?
The projected CAGR is approximately 12.43%.
2. Which companies are prominent players in the Desktop Virtualization In Energy Sector Market?
Key companies in the market include Parallels International GmbH, IBM Corporation, Toshiba Corporation, NComputing, Microsoft Corporation, Dell Inc, Huawei Technologies Co Ltd, Ericom Software Inc, Citrix Systems Inc, Vmware Inc .
3. What are the main segments of the Desktop Virtualization In Energy Sector Market?
The market segments include Desktop Delivery Platform, Deployment Mode.
4. Can you provide details about the market size?
The market size is estimated to be USD 13.36 Million as of 2022.
5. What are some drivers contributing to market growth?
Growing Adoption of Cloud and Need for Remote Accessibility is Driving the Market Growth.
6. What are the notable trends driving market growth?
Cloud Deployment Mode Segment is Expected to Hold Significant Market Share.
7. Are there any restraints impacting market growth?
Infrastructural Constraints is Discouraging the Market Expansion.
8. Can you provide examples of recent developments in the market?
September 2022: Amazon Web Services Inc. updated Amazon Workspaces, a desktop virtualization suite, with new features that enable customers to use Workspaces Core along with an upgrade that would make it feasible to host virtual desktops powered by the Ubuntu operating system on its cloud platform.
9. What pricing options are available for accessing the report?
Pricing options include single-user, multi-user, and enterprise licenses priced at USD 4750, USD 5250, and USD 8750 respectively.
10. Is the market size provided in terms of value or volume?
The market size is provided in terms of value, measured in Million.
11. Are there any specific market keywords associated with the report?
Yes, the market keyword associated with the report is "Desktop Virtualization In Energy Sector Market," which aids in identifying and referencing the specific market segment covered.
12. How do I determine which pricing option suits my needs best?
The pricing options vary based on user requirements and access needs. Individual users may opt for single-user licenses, while businesses requiring broader access may choose multi-user or enterprise licenses for cost-effective access to the report.
13. Are there any additional resources or data provided in the Desktop Virtualization In Energy Sector Market report?
While the report offers comprehensive insights, it's advisable to review the specific contents or supplementary materials provided to ascertain if additional resources or data are available.
14. How can I stay updated on further developments or reports in the Desktop Virtualization In Energy Sector Market?
To stay informed about further developments, trends, and reports in the Desktop Virtualization In Energy Sector Market, consider subscribing to industry newsletters, following relevant companies and organizations, or regularly checking reputable industry news sources and publications.
Methodology
Step 1 - Identification of Relevant Samples Size from Population Database


Step 2 - Approaches for Defining Global Market Size (Value, Volume* & Price*)

Note*: In applicable scenarios
Step 3 - Data Sources
Primary Research
- Web Analytics
- Survey Reports
- Research Institute
- Latest Research Reports
- Opinion Leaders
Secondary Research
- Annual Reports
- White Paper
- Latest Press Release
- Industry Association
- Paid Database
- Investor Presentations

Step 4 - Data Triangulation
Involves using different sources of information in order to increase the validity of a study
These sources are likely to be stakeholders in a program - participants, other researchers, program staff, other community members, and so on.
Then we put all data in single framework & apply various statistical tools to find out the dynamic on the market.
During the analysis stage, feedback from the stakeholder groups would be compared to determine areas of agreement as well as areas of divergence
