

Key Insights
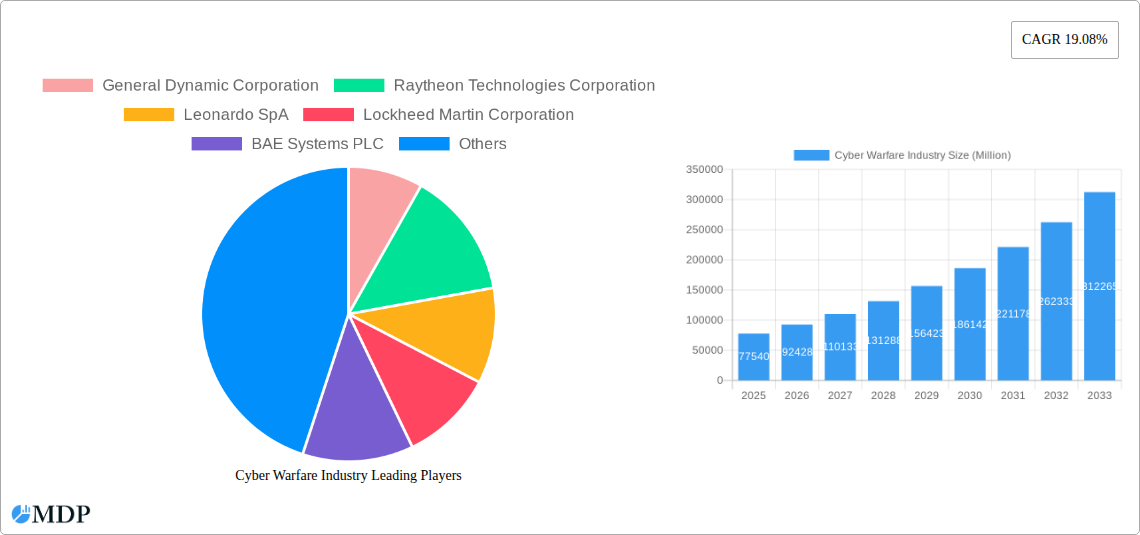
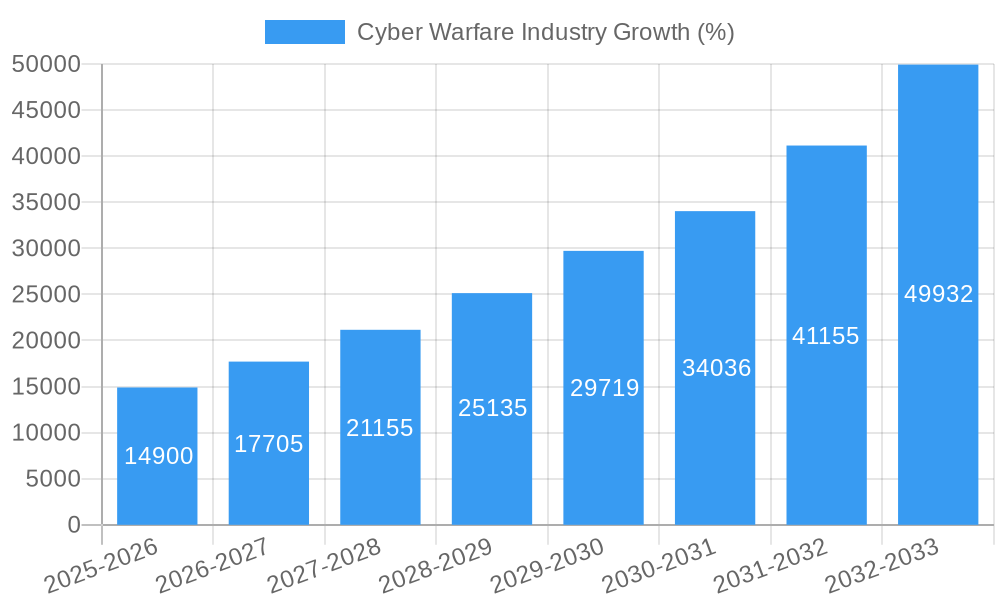
The global cyber warfare market, valued at $77.54 billion in 2025, is projected to experience robust growth, exhibiting a Compound Annual Growth Rate (CAGR) of 19.08% from 2025 to 2033. This expansion is fueled by several key drivers. The increasing sophistication of cyberattacks targeting critical infrastructure, governments, and businesses necessitates significant investments in defensive and offensive cyber capabilities. Government initiatives promoting cybersecurity awareness and bolstering national defense strategies further contribute to market growth. The rise of artificial intelligence (AI) and machine learning (ML) in cyber warfare is revolutionizing threat detection, analysis, and response, creating a significant demand for advanced technologies and skilled professionals. Furthermore, the increasing interconnectedness of global systems and the proliferation of internet-connected devices expand the attack surface, creating a continuous need for robust cybersecurity solutions. Competition among nation-states and non-state actors in the cyber domain also stimulates market expansion, driving innovation and investment in advanced cyber warfare technologies.
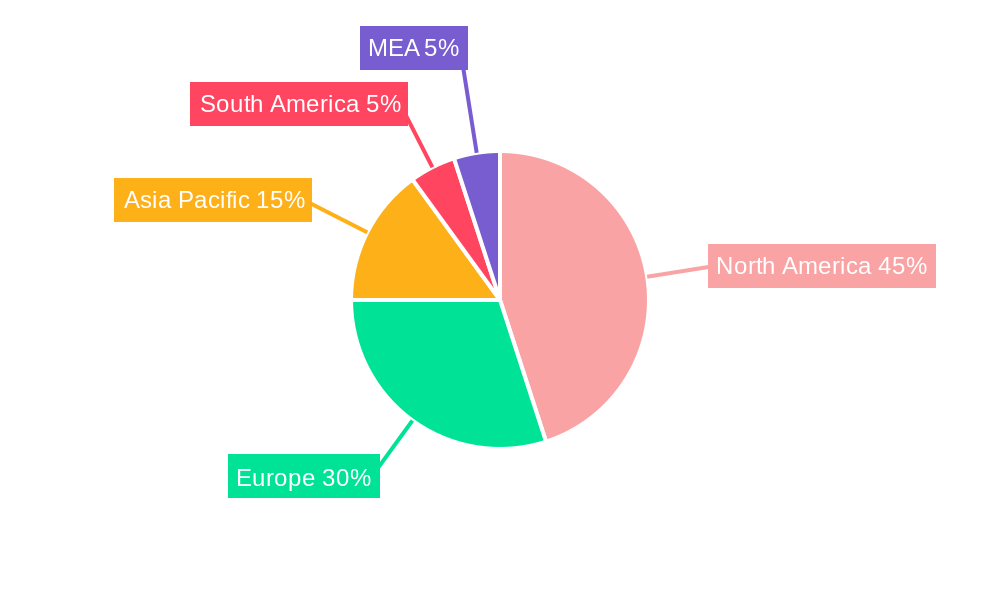
Market segmentation reveals a diverse landscape. The defense and aerospace sectors are major contributors due to their inherent need for robust cybersecurity to protect sensitive data and critical systems. The BFSI (Banking, Financial Services, and Insurance) sector, given the sensitive nature of financial data, represents another significant market segment. Similarly, corporate entities, governments, and power and utilities companies face increasing cyber threats, leading to substantial investments in cyber warfare solutions. Geographic analysis reveals North America and Europe as currently dominant regions, but the Asia-Pacific region, driven by rapid technological advancement and economic growth in countries like China and India, is poised for significant expansion in the coming years. Leading companies like General Dynamics, Raytheon Technologies, Lockheed Martin, and BAE Systems are at the forefront of this market, constantly innovating and competing to provide advanced cyber warfare solutions. The competitive landscape is characterized by continuous innovation, mergers and acquisitions, and strategic partnerships, reflecting the dynamic and ever-evolving nature of the cyber warfare domain.
Cyber Warfare Industry Market Report: 2019-2033
This comprehensive report provides an in-depth analysis of the global Cyber Warfare Industry, projecting a market valuation exceeding xx Million by 2033. The report covers the period 2019-2033, with a base year of 2025 and a forecast period of 2025-2033. It offers crucial insights for industry stakeholders, investors, and strategic decision-makers navigating this rapidly evolving landscape. Benefit from detailed market segmentation, competitive analysis, and future growth projections to gain a competitive edge.
Cyber Warfare Industry Market Dynamics & Concentration
The Cyber Warfare Industry is characterized by a moderately concentrated market, with key players holding significant market share. The market is driven by continuous innovation in cybersecurity technologies, evolving geopolitical dynamics, and increasing government spending on defense and national security. Regulatory frameworks, such as data privacy regulations (GDPR, CCPA), significantly influence market operations. While traditional cybersecurity solutions remain prevalent, the emergence of AI-powered threat detection and response systems is disrupting the market. Mergers and acquisitions (M&A) are frequent, reflecting industry consolidation and the pursuit of technological synergies.
- Market Concentration: The top 5 players account for approximately xx% of the global market share in 2025 (estimated).
- M&A Activity: A total of xx M&A deals were recorded between 2019 and 2024, indicating a high level of consolidation.
- Innovation Drivers: Artificial intelligence (AI), machine learning (ML), and quantum computing are driving innovation in threat detection and response.
- Regulatory Frameworks: Stringent data privacy regulations and cybersecurity standards influence product development and market access.
- End-User Trends: Increasing adoption of cloud computing and IoT devices is driving demand for advanced cybersecurity solutions.
Cyber Warfare Industry Industry Trends & Analysis
The Cyber Warfare Industry exhibits robust growth, driven by escalating cyber threats, increasing digitalization across various sectors, and rising government investments in cybersecurity infrastructure. Technological disruptions, including the proliferation of sophisticated cyberattacks and the emergence of new attack vectors, necessitate continuous innovation and adaptation. Consumer preferences are shifting towards integrated, AI-powered security solutions that offer comprehensive threat protection. Competitive dynamics are intense, with companies vying for market share through technological advancements, strategic partnerships, and M&A activities. The market is expected to register a CAGR of xx% during the forecast period (2025-2033), with significant market penetration across diverse industries.
Leading Markets & Segments in Cyber Warfare Industry
The North American region currently dominates the Cyber Warfare Industry, driven by robust government spending on defense and cybersecurity, and a thriving private sector. The defense segment represents the largest end-user industry, owing to the critical need for securing military infrastructure and sensitive data.
- North America Dominance: Key drivers include substantial government investments, a strong technological base, and a large pool of cybersecurity professionals.
- Defense Segment Leadership: High spending on military infrastructure and national security makes it the largest end-user segment.
- Government Segment Growth: Increasing awareness of cyber threats and the need for robust security measures are driving growth in government spending.
- BFSI Sector: The financial industry is a prime target for cyberattacks, leading to increased spending on cybersecurity.
- Other End-user Industries: Growing adoption of digital technologies across various sectors increases demand for cyber security solutions.
Cyber Warfare Industry Product Developments
Recent product innovations focus on AI-powered threat detection, advanced endpoint protection, and cloud-based security solutions. These products offer improved threat detection capabilities, faster response times, and enhanced security posture management. The competitive advantage lies in the ability to provide comprehensive, integrated security solutions that effectively address the evolving cyber threat landscape. The market is seeing a shift toward proactive security measures, with a focus on threat intelligence and predictive analytics.
Key Drivers of Cyber Warfare Industry Growth
The Cyber Warfare Industry's growth is propelled by several factors, including:
- Technological Advancements: AI, ML, and blockchain are enhancing threat detection, response, and prevention capabilities.
- Increased Cyber Threats: The rising frequency and sophistication of cyberattacks fuel demand for robust cybersecurity solutions.
- Government Regulations: Data privacy regulations and cybersecurity mandates drive investment in security solutions.
- Economic Growth: As economies develop, digitalization increases, raising cybersecurity concerns.
Challenges in the Cyber Warfare Industry Market
The industry faces several challenges:
- Regulatory Hurdles: Navigating complex and evolving data privacy regulations can be challenging for companies.
- Supply Chain Vulnerabilities: Supply chain disruptions can impact the availability of critical cybersecurity components.
- Competitive Pressures: The highly competitive market requires constant innovation to stay ahead of competitors.
- Talent Shortages: A shortage of skilled cybersecurity professionals limits the industry's growth.
Emerging Opportunities in Cyber Warfare Industry
Long-term growth is spurred by:
- Technological Breakthroughs: Quantum computing and advanced AI algorithms promise enhanced security capabilities.
- Strategic Partnerships: Collaborations between technology companies and government agencies are accelerating innovation.
- Market Expansion: Emerging markets present significant growth opportunities for cybersecurity providers.
Leading Players in the Cyber Warfare Industry Sector
- General Dynamics Corporation
- Raytheon Technologies Corporation
- Leonardo SpA
- Lockheed Martin Corporation
- BAE Systems PLC
- Airbus S
- DXC Technology Company
- Booz Allen Hamilton Inc
- The Boeing Company
- Mandiant Inc (fireeye Inc)
Key Milestones in Cyber Warfare Industry Industry
- April 2023: Cyber security startup Safe Security raised USD 50 Million in its Series B funding round, highlighting investor confidence in the sector's growth.
- August 2023: The Department of Homeland Security announced USD 374.9 Million in grant funding for the State and Local Cybersecurity Grant Program (SLCGP), demonstrating government commitment to bolstering national cybersecurity.
Strategic Outlook for Cyber Warfare Industry Market
The Cyber Warfare Industry is poised for significant growth, driven by increasing cyber threats and rising government and private sector investment. Strategic partnerships, technological innovation, and expansion into new markets will be key success factors. Companies that can effectively address the evolving threat landscape and deliver innovative, integrated security solutions will be best positioned for long-term success.
Cyber Warfare Industry Segmentation
-
1. End-user Industry
- 1.1. Defense
- 1.2. Aerospace
- 1.3. BFSI
- 1.4. Corporate
- 1.5. Power and Utilities
- 1.6. Government
- 1.7. Other End-user Industries
Cyber Warfare Industry Segmentation By Geography
- 1. North America
- 2. Europe
- 3. Asia
- 4. Australia and New Zealand
- 5. Latin America
- 6. Middle East and Africa
Cyber Warfare Industry REPORT HIGHLIGHTS
| Aspects | Details |
|---|---|
| Study Period | 2019-2033 |
| Base Year | 2024 |
| Estimated Year | 2025 |
| Forecast Period | 2025-2033 |
| Historical Period | 2019-2024 |
| Growth Rate | CAGR of 19.08% from 2019-2033 |
| Segmentation |
|
Table of Contents
- 1. Introduction
- 1.1. Research Scope
- 1.2. Market Segmentation
- 1.3. Research Methodology
- 1.4. Definitions and Assumptions
- 2. Executive Summary
- 2.1. Introduction
- 3. Market Dynamics
- 3.1. Introduction
- 3.2. Market Drivers
- 3.2.1. Increasing Concerns Regarding National Security; Increase in Defense Spending
- 3.3. Market Restrains
- 3.3.1. Poor Understanding of Industrial Control Systems; Lack of Interoperability Between Products
- 3.4. Market Trends
- 3.4.1. Defense Sector to be the Largest End User
- 4. Market Factor Analysis
- 4.1. Porters Five Forces
- 4.2. Supply/Value Chain
- 4.3. PESTEL analysis
- 4.4. Market Entropy
- 4.5. Patent/Trademark Analysis
- 5. Global Cyber Warfare Industry Analysis, Insights and Forecast, 2019-2031
- 5.1. Market Analysis, Insights and Forecast - by End-user Industry
- 5.1.1. Defense
- 5.1.2. Aerospace
- 5.1.3. BFSI
- 5.1.4. Corporate
- 5.1.5. Power and Utilities
- 5.1.6. Government
- 5.1.7. Other End-user Industries
- 5.2. Market Analysis, Insights and Forecast - by Region
- 5.2.1. North America
- 5.2.2. Europe
- 5.2.3. Asia
- 5.2.4. Australia and New Zealand
- 5.2.5. Latin America
- 5.2.6. Middle East and Africa
- 5.1. Market Analysis, Insights and Forecast - by End-user Industry
- 6. North America Cyber Warfare Industry Analysis, Insights and Forecast, 2019-2031
- 6.1. Market Analysis, Insights and Forecast - by End-user Industry
- 6.1.1. Defense
- 6.1.2. Aerospace
- 6.1.3. BFSI
- 6.1.4. Corporate
- 6.1.5. Power and Utilities
- 6.1.6. Government
- 6.1.7. Other End-user Industries
- 6.1. Market Analysis, Insights and Forecast - by End-user Industry
- 7. Europe Cyber Warfare Industry Analysis, Insights and Forecast, 2019-2031
- 7.1. Market Analysis, Insights and Forecast - by End-user Industry
- 7.1.1. Defense
- 7.1.2. Aerospace
- 7.1.3. BFSI
- 7.1.4. Corporate
- 7.1.5. Power and Utilities
- 7.1.6. Government
- 7.1.7. Other End-user Industries
- 7.1. Market Analysis, Insights and Forecast - by End-user Industry
- 8. Asia Cyber Warfare Industry Analysis, Insights and Forecast, 2019-2031
- 8.1. Market Analysis, Insights and Forecast - by End-user Industry
- 8.1.1. Defense
- 8.1.2. Aerospace
- 8.1.3. BFSI
- 8.1.4. Corporate
- 8.1.5. Power and Utilities
- 8.1.6. Government
- 8.1.7. Other End-user Industries
- 8.1. Market Analysis, Insights and Forecast - by End-user Industry
- 9. Australia and New Zealand Cyber Warfare Industry Analysis, Insights and Forecast, 2019-2031
- 9.1. Market Analysis, Insights and Forecast - by End-user Industry
- 9.1.1. Defense
- 9.1.2. Aerospace
- 9.1.3. BFSI
- 9.1.4. Corporate
- 9.1.5. Power and Utilities
- 9.1.6. Government
- 9.1.7. Other End-user Industries
- 9.1. Market Analysis, Insights and Forecast - by End-user Industry
- 10. Latin America Cyber Warfare Industry Analysis, Insights and Forecast, 2019-2031
- 10.1. Market Analysis, Insights and Forecast - by End-user Industry
- 10.1.1. Defense
- 10.1.2. Aerospace
- 10.1.3. BFSI
- 10.1.4. Corporate
- 10.1.5. Power and Utilities
- 10.1.6. Government
- 10.1.7. Other End-user Industries
- 10.1. Market Analysis, Insights and Forecast - by End-user Industry
- 11. Middle East and Africa Cyber Warfare Industry Analysis, Insights and Forecast, 2019-2031
- 11.1. Market Analysis, Insights and Forecast - by End-user Industry
- 11.1.1. Defense
- 11.1.2. Aerospace
- 11.1.3. BFSI
- 11.1.4. Corporate
- 11.1.5. Power and Utilities
- 11.1.6. Government
- 11.1.7. Other End-user Industries
- 11.1. Market Analysis, Insights and Forecast - by End-user Industry
- 12. North America Cyber Warfare Industry Analysis, Insights and Forecast, 2019-2031
- 12.1. Market Analysis, Insights and Forecast - By Country/Sub-region
- 12.1.1 United States
- 12.1.2 Canada
- 12.1.3 Mexico
- 13. Europe Cyber Warfare Industry Analysis, Insights and Forecast, 2019-2031
- 13.1. Market Analysis, Insights and Forecast - By Country/Sub-region
- 13.1.1 Germany
- 13.1.2 United Kingdom
- 13.1.3 France
- 13.1.4 Spain
- 13.1.5 Italy
- 13.1.6 Spain
- 13.1.7 Belgium
- 13.1.8 Netherland
- 13.1.9 Nordics
- 13.1.10 Rest of Europe
- 14. Asia Pacific Cyber Warfare Industry Analysis, Insights and Forecast, 2019-2031
- 14.1. Market Analysis, Insights and Forecast - By Country/Sub-region
- 14.1.1 China
- 14.1.2 Japan
- 14.1.3 India
- 14.1.4 South Korea
- 14.1.5 Southeast Asia
- 14.1.6 Australia
- 14.1.7 Indonesia
- 14.1.8 Phillipes
- 14.1.9 Singapore
- 14.1.10 Thailandc
- 14.1.11 Rest of Asia Pacific
- 15. South America Cyber Warfare Industry Analysis, Insights and Forecast, 2019-2031
- 15.1. Market Analysis, Insights and Forecast - By Country/Sub-region
- 15.1.1 Brazil
- 15.1.2 Argentina
- 15.1.3 Peru
- 15.1.4 Chile
- 15.1.5 Colombia
- 15.1.6 Ecuador
- 15.1.7 Venezuela
- 15.1.8 Rest of South America
- 16. North America Cyber Warfare Industry Analysis, Insights and Forecast, 2019-2031
- 16.1. Market Analysis, Insights and Forecast - By Country/Sub-region
- 16.1.1 United States
- 16.1.2 Canada
- 16.1.3 Mexico
- 17. MEA Cyber Warfare Industry Analysis, Insights and Forecast, 2019-2031
- 17.1. Market Analysis, Insights and Forecast - By Country/Sub-region
- 17.1.1 United Arab Emirates
- 17.1.2 Saudi Arabia
- 17.1.3 South Africa
- 17.1.4 Rest of Middle East and Africa
- 18. Competitive Analysis
- 18.1. Global Market Share Analysis 2024
- 18.2. Company Profiles
- 18.2.1 General Dynamic Corporation
- 18.2.1.1. Overview
- 18.2.1.2. Products
- 18.2.1.3. SWOT Analysis
- 18.2.1.4. Recent Developments
- 18.2.1.5. Financials (Based on Availability)
- 18.2.2 Raytheon Technologies Corporation
- 18.2.2.1. Overview
- 18.2.2.2. Products
- 18.2.2.3. SWOT Analysis
- 18.2.2.4. Recent Developments
- 18.2.2.5. Financials (Based on Availability)
- 18.2.3 Leonardo SpA
- 18.2.3.1. Overview
- 18.2.3.2. Products
- 18.2.3.3. SWOT Analysis
- 18.2.3.4. Recent Developments
- 18.2.3.5. Financials (Based on Availability)
- 18.2.4 Lockheed Martin Corporation
- 18.2.4.1. Overview
- 18.2.4.2. Products
- 18.2.4.3. SWOT Analysis
- 18.2.4.4. Recent Developments
- 18.2.4.5. Financials (Based on Availability)
- 18.2.5 BAE Systems PLC
- 18.2.5.1. Overview
- 18.2.5.2. Products
- 18.2.5.3. SWOT Analysis
- 18.2.5.4. Recent Developments
- 18.2.5.5. Financials (Based on Availability)
- 18.2.6 Airbus S
- 18.2.6.1. Overview
- 18.2.6.2. Products
- 18.2.6.3. SWOT Analysis
- 18.2.6.4. Recent Developments
- 18.2.6.5. Financials (Based on Availability)
- 18.2.7 DXC Technology Company
- 18.2.7.1. Overview
- 18.2.7.2. Products
- 18.2.7.3. SWOT Analysis
- 18.2.7.4. Recent Developments
- 18.2.7.5. Financials (Based on Availability)
- 18.2.8 Booz Allen Hamilton Inc
- 18.2.8.1. Overview
- 18.2.8.2. Products
- 18.2.8.3. SWOT Analysis
- 18.2.8.4. Recent Developments
- 18.2.8.5. Financials (Based on Availability)
- 18.2.9 The Boeing Company
- 18.2.9.1. Overview
- 18.2.9.2. Products
- 18.2.9.3. SWOT Analysis
- 18.2.9.4. Recent Developments
- 18.2.9.5. Financials (Based on Availability)
- 18.2.10 Mandiant Inc (fireeye Inc )
- 18.2.10.1. Overview
- 18.2.10.2. Products
- 18.2.10.3. SWOT Analysis
- 18.2.10.4. Recent Developments
- 18.2.10.5. Financials (Based on Availability)
- 18.2.1 General Dynamic Corporation
List of Figures
- Figure 1: Global Cyber Warfare Industry Revenue Breakdown (Million, %) by Region 2024 & 2032
- Figure 2: Global Cyber Warfare Industry Volume Breakdown (K Unit, %) by Region 2024 & 2032
- Figure 3: North America Cyber Warfare Industry Revenue (Million), by Country 2024 & 2032
- Figure 4: North America Cyber Warfare Industry Volume (K Unit), by Country 2024 & 2032
- Figure 5: North America Cyber Warfare Industry Revenue Share (%), by Country 2024 & 2032
- Figure 6: North America Cyber Warfare Industry Volume Share (%), by Country 2024 & 2032
- Figure 7: Europe Cyber Warfare Industry Revenue (Million), by Country 2024 & 2032
- Figure 8: Europe Cyber Warfare Industry Volume (K Unit), by Country 2024 & 2032
- Figure 9: Europe Cyber Warfare Industry Revenue Share (%), by Country 2024 & 2032
- Figure 10: Europe Cyber Warfare Industry Volume Share (%), by Country 2024 & 2032
- Figure 11: Asia Pacific Cyber Warfare Industry Revenue (Million), by Country 2024 & 2032
- Figure 12: Asia Pacific Cyber Warfare Industry Volume (K Unit), by Country 2024 & 2032
- Figure 13: Asia Pacific Cyber Warfare Industry Revenue Share (%), by Country 2024 & 2032
- Figure 14: Asia Pacific Cyber Warfare Industry Volume Share (%), by Country 2024 & 2032
- Figure 15: South America Cyber Warfare Industry Revenue (Million), by Country 2024 & 2032
- Figure 16: South America Cyber Warfare Industry Volume (K Unit), by Country 2024 & 2032
- Figure 17: South America Cyber Warfare Industry Revenue Share (%), by Country 2024 & 2032
- Figure 18: South America Cyber Warfare Industry Volume Share (%), by Country 2024 & 2032
- Figure 19: North America Cyber Warfare Industry Revenue (Million), by Country 2024 & 2032
- Figure 20: North America Cyber Warfare Industry Volume (K Unit), by Country 2024 & 2032
- Figure 21: North America Cyber Warfare Industry Revenue Share (%), by Country 2024 & 2032
- Figure 22: North America Cyber Warfare Industry Volume Share (%), by Country 2024 & 2032
- Figure 23: MEA Cyber Warfare Industry Revenue (Million), by Country 2024 & 2032
- Figure 24: MEA Cyber Warfare Industry Volume (K Unit), by Country 2024 & 2032
- Figure 25: MEA Cyber Warfare Industry Revenue Share (%), by Country 2024 & 2032
- Figure 26: MEA Cyber Warfare Industry Volume Share (%), by Country 2024 & 2032
- Figure 27: North America Cyber Warfare Industry Revenue (Million), by End-user Industry 2024 & 2032
- Figure 28: North America Cyber Warfare Industry Volume (K Unit), by End-user Industry 2024 & 2032
- Figure 29: North America Cyber Warfare Industry Revenue Share (%), by End-user Industry 2024 & 2032
- Figure 30: North America Cyber Warfare Industry Volume Share (%), by End-user Industry 2024 & 2032
- Figure 31: North America Cyber Warfare Industry Revenue (Million), by Country 2024 & 2032
- Figure 32: North America Cyber Warfare Industry Volume (K Unit), by Country 2024 & 2032
- Figure 33: North America Cyber Warfare Industry Revenue Share (%), by Country 2024 & 2032
- Figure 34: North America Cyber Warfare Industry Volume Share (%), by Country 2024 & 2032
- Figure 35: Europe Cyber Warfare Industry Revenue (Million), by End-user Industry 2024 & 2032
- Figure 36: Europe Cyber Warfare Industry Volume (K Unit), by End-user Industry 2024 & 2032
- Figure 37: Europe Cyber Warfare Industry Revenue Share (%), by End-user Industry 2024 & 2032
- Figure 38: Europe Cyber Warfare Industry Volume Share (%), by End-user Industry 2024 & 2032
- Figure 39: Europe Cyber Warfare Industry Revenue (Million), by Country 2024 & 2032
- Figure 40: Europe Cyber Warfare Industry Volume (K Unit), by Country 2024 & 2032
- Figure 41: Europe Cyber Warfare Industry Revenue Share (%), by Country 2024 & 2032
- Figure 42: Europe Cyber Warfare Industry Volume Share (%), by Country 2024 & 2032
- Figure 43: Asia Cyber Warfare Industry Revenue (Million), by End-user Industry 2024 & 2032
- Figure 44: Asia Cyber Warfare Industry Volume (K Unit), by End-user Industry 2024 & 2032
- Figure 45: Asia Cyber Warfare Industry Revenue Share (%), by End-user Industry 2024 & 2032
- Figure 46: Asia Cyber Warfare Industry Volume Share (%), by End-user Industry 2024 & 2032
- Figure 47: Asia Cyber Warfare Industry Revenue (Million), by Country 2024 & 2032
- Figure 48: Asia Cyber Warfare Industry Volume (K Unit), by Country 2024 & 2032
- Figure 49: Asia Cyber Warfare Industry Revenue Share (%), by Country 2024 & 2032
- Figure 50: Asia Cyber Warfare Industry Volume Share (%), by Country 2024 & 2032
- Figure 51: Australia and New Zealand Cyber Warfare Industry Revenue (Million), by End-user Industry 2024 & 2032
- Figure 52: Australia and New Zealand Cyber Warfare Industry Volume (K Unit), by End-user Industry 2024 & 2032
- Figure 53: Australia and New Zealand Cyber Warfare Industry Revenue Share (%), by End-user Industry 2024 & 2032
- Figure 54: Australia and New Zealand Cyber Warfare Industry Volume Share (%), by End-user Industry 2024 & 2032
- Figure 55: Australia and New Zealand Cyber Warfare Industry Revenue (Million), by Country 2024 & 2032
- Figure 56: Australia and New Zealand Cyber Warfare Industry Volume (K Unit), by Country 2024 & 2032
- Figure 57: Australia and New Zealand Cyber Warfare Industry Revenue Share (%), by Country 2024 & 2032
- Figure 58: Australia and New Zealand Cyber Warfare Industry Volume Share (%), by Country 2024 & 2032
- Figure 59: Latin America Cyber Warfare Industry Revenue (Million), by End-user Industry 2024 & 2032
- Figure 60: Latin America Cyber Warfare Industry Volume (K Unit), by End-user Industry 2024 & 2032
- Figure 61: Latin America Cyber Warfare Industry Revenue Share (%), by End-user Industry 2024 & 2032
- Figure 62: Latin America Cyber Warfare Industry Volume Share (%), by End-user Industry 2024 & 2032
- Figure 63: Latin America Cyber Warfare Industry Revenue (Million), by Country 2024 & 2032
- Figure 64: Latin America Cyber Warfare Industry Volume (K Unit), by Country 2024 & 2032
- Figure 65: Latin America Cyber Warfare Industry Revenue Share (%), by Country 2024 & 2032
- Figure 66: Latin America Cyber Warfare Industry Volume Share (%), by Country 2024 & 2032
- Figure 67: Middle East and Africa Cyber Warfare Industry Revenue (Million), by End-user Industry 2024 & 2032
- Figure 68: Middle East and Africa Cyber Warfare Industry Volume (K Unit), by End-user Industry 2024 & 2032
- Figure 69: Middle East and Africa Cyber Warfare Industry Revenue Share (%), by End-user Industry 2024 & 2032
- Figure 70: Middle East and Africa Cyber Warfare Industry Volume Share (%), by End-user Industry 2024 & 2032
- Figure 71: Middle East and Africa Cyber Warfare Industry Revenue (Million), by Country 2024 & 2032
- Figure 72: Middle East and Africa Cyber Warfare Industry Volume (K Unit), by Country 2024 & 2032
- Figure 73: Middle East and Africa Cyber Warfare Industry Revenue Share (%), by Country 2024 & 2032
- Figure 74: Middle East and Africa Cyber Warfare Industry Volume Share (%), by Country 2024 & 2032
List of Tables
- Table 1: Global Cyber Warfare Industry Revenue Million Forecast, by Region 2019 & 2032
- Table 2: Global Cyber Warfare Industry Volume K Unit Forecast, by Region 2019 & 2032
- Table 3: Global Cyber Warfare Industry Revenue Million Forecast, by End-user Industry 2019 & 2032
- Table 4: Global Cyber Warfare Industry Volume K Unit Forecast, by End-user Industry 2019 & 2032
- Table 5: Global Cyber Warfare Industry Revenue Million Forecast, by Region 2019 & 2032
- Table 6: Global Cyber Warfare Industry Volume K Unit Forecast, by Region 2019 & 2032
- Table 7: Global Cyber Warfare Industry Revenue Million Forecast, by Country 2019 & 2032
- Table 8: Global Cyber Warfare Industry Volume K Unit Forecast, by Country 2019 & 2032
- Table 9: United States Cyber Warfare Industry Revenue (Million) Forecast, by Application 2019 & 2032
- Table 10: United States Cyber Warfare Industry Volume (K Unit) Forecast, by Application 2019 & 2032
- Table 11: Canada Cyber Warfare Industry Revenue (Million) Forecast, by Application 2019 & 2032
- Table 12: Canada Cyber Warfare Industry Volume (K Unit) Forecast, by Application 2019 & 2032
- Table 13: Mexico Cyber Warfare Industry Revenue (Million) Forecast, by Application 2019 & 2032
- Table 14: Mexico Cyber Warfare Industry Volume (K Unit) Forecast, by Application 2019 & 2032
- Table 15: Global Cyber Warfare Industry Revenue Million Forecast, by Country 2019 & 2032
- Table 16: Global Cyber Warfare Industry Volume K Unit Forecast, by Country 2019 & 2032
- Table 17: Germany Cyber Warfare Industry Revenue (Million) Forecast, by Application 2019 & 2032
- Table 18: Germany Cyber Warfare Industry Volume (K Unit) Forecast, by Application 2019 & 2032
- Table 19: United Kingdom Cyber Warfare Industry Revenue (Million) Forecast, by Application 2019 & 2032
- Table 20: United Kingdom Cyber Warfare Industry Volume (K Unit) Forecast, by Application 2019 & 2032
- Table 21: France Cyber Warfare Industry Revenue (Million) Forecast, by Application 2019 & 2032
- Table 22: France Cyber Warfare Industry Volume (K Unit) Forecast, by Application 2019 & 2032
- Table 23: Spain Cyber Warfare Industry Revenue (Million) Forecast, by Application 2019 & 2032
- Table 24: Spain Cyber Warfare Industry Volume (K Unit) Forecast, by Application 2019 & 2032
- Table 25: Italy Cyber Warfare Industry Revenue (Million) Forecast, by Application 2019 & 2032
- Table 26: Italy Cyber Warfare Industry Volume (K Unit) Forecast, by Application 2019 & 2032
- Table 27: Spain Cyber Warfare Industry Revenue (Million) Forecast, by Application 2019 & 2032
- Table 28: Spain Cyber Warfare Industry Volume (K Unit) Forecast, by Application 2019 & 2032
- Table 29: Belgium Cyber Warfare Industry Revenue (Million) Forecast, by Application 2019 & 2032
- Table 30: Belgium Cyber Warfare Industry Volume (K Unit) Forecast, by Application 2019 & 2032
- Table 31: Netherland Cyber Warfare Industry Revenue (Million) Forecast, by Application 2019 & 2032
- Table 32: Netherland Cyber Warfare Industry Volume (K Unit) Forecast, by Application 2019 & 2032
- Table 33: Nordics Cyber Warfare Industry Revenue (Million) Forecast, by Application 2019 & 2032
- Table 34: Nordics Cyber Warfare Industry Volume (K Unit) Forecast, by Application 2019 & 2032
- Table 35: Rest of Europe Cyber Warfare Industry Revenue (Million) Forecast, by Application 2019 & 2032
- Table 36: Rest of Europe Cyber Warfare Industry Volume (K Unit) Forecast, by Application 2019 & 2032
- Table 37: Global Cyber Warfare Industry Revenue Million Forecast, by Country 2019 & 2032
- Table 38: Global Cyber Warfare Industry Volume K Unit Forecast, by Country 2019 & 2032
- Table 39: China Cyber Warfare Industry Revenue (Million) Forecast, by Application 2019 & 2032
- Table 40: China Cyber Warfare Industry Volume (K Unit) Forecast, by Application 2019 & 2032
- Table 41: Japan Cyber Warfare Industry Revenue (Million) Forecast, by Application 2019 & 2032
- Table 42: Japan Cyber Warfare Industry Volume (K Unit) Forecast, by Application 2019 & 2032
- Table 43: India Cyber Warfare Industry Revenue (Million) Forecast, by Application 2019 & 2032
- Table 44: India Cyber Warfare Industry Volume (K Unit) Forecast, by Application 2019 & 2032
- Table 45: South Korea Cyber Warfare Industry Revenue (Million) Forecast, by Application 2019 & 2032
- Table 46: South Korea Cyber Warfare Industry Volume (K Unit) Forecast, by Application 2019 & 2032
- Table 47: Southeast Asia Cyber Warfare Industry Revenue (Million) Forecast, by Application 2019 & 2032
- Table 48: Southeast Asia Cyber Warfare Industry Volume (K Unit) Forecast, by Application 2019 & 2032
- Table 49: Australia Cyber Warfare Industry Revenue (Million) Forecast, by Application 2019 & 2032
- Table 50: Australia Cyber Warfare Industry Volume (K Unit) Forecast, by Application 2019 & 2032
- Table 51: Indonesia Cyber Warfare Industry Revenue (Million) Forecast, by Application 2019 & 2032
- Table 52: Indonesia Cyber Warfare Industry Volume (K Unit) Forecast, by Application 2019 & 2032
- Table 53: Phillipes Cyber Warfare Industry Revenue (Million) Forecast, by Application 2019 & 2032
- Table 54: Phillipes Cyber Warfare Industry Volume (K Unit) Forecast, by Application 2019 & 2032
- Table 55: Singapore Cyber Warfare Industry Revenue (Million) Forecast, by Application 2019 & 2032
- Table 56: Singapore Cyber Warfare Industry Volume (K Unit) Forecast, by Application 2019 & 2032
- Table 57: Thailandc Cyber Warfare Industry Revenue (Million) Forecast, by Application 2019 & 2032
- Table 58: Thailandc Cyber Warfare Industry Volume (K Unit) Forecast, by Application 2019 & 2032
- Table 59: Rest of Asia Pacific Cyber Warfare Industry Revenue (Million) Forecast, by Application 2019 & 2032
- Table 60: Rest of Asia Pacific Cyber Warfare Industry Volume (K Unit) Forecast, by Application 2019 & 2032
- Table 61: Global Cyber Warfare Industry Revenue Million Forecast, by Country 2019 & 2032
- Table 62: Global Cyber Warfare Industry Volume K Unit Forecast, by Country 2019 & 2032
- Table 63: Brazil Cyber Warfare Industry Revenue (Million) Forecast, by Application 2019 & 2032
- Table 64: Brazil Cyber Warfare Industry Volume (K Unit) Forecast, by Application 2019 & 2032
- Table 65: Argentina Cyber Warfare Industry Revenue (Million) Forecast, by Application 2019 & 2032
- Table 66: Argentina Cyber Warfare Industry Volume (K Unit) Forecast, by Application 2019 & 2032
- Table 67: Peru Cyber Warfare Industry Revenue (Million) Forecast, by Application 2019 & 2032
- Table 68: Peru Cyber Warfare Industry Volume (K Unit) Forecast, by Application 2019 & 2032
- Table 69: Chile Cyber Warfare Industry Revenue (Million) Forecast, by Application 2019 & 2032
- Table 70: Chile Cyber Warfare Industry Volume (K Unit) Forecast, by Application 2019 & 2032
- Table 71: Colombia Cyber Warfare Industry Revenue (Million) Forecast, by Application 2019 & 2032
- Table 72: Colombia Cyber Warfare Industry Volume (K Unit) Forecast, by Application 2019 & 2032
- Table 73: Ecuador Cyber Warfare Industry Revenue (Million) Forecast, by Application 2019 & 2032
- Table 74: Ecuador Cyber Warfare Industry Volume (K Unit) Forecast, by Application 2019 & 2032
- Table 75: Venezuela Cyber Warfare Industry Revenue (Million) Forecast, by Application 2019 & 2032
- Table 76: Venezuela Cyber Warfare Industry Volume (K Unit) Forecast, by Application 2019 & 2032
- Table 77: Rest of South America Cyber Warfare Industry Revenue (Million) Forecast, by Application 2019 & 2032
- Table 78: Rest of South America Cyber Warfare Industry Volume (K Unit) Forecast, by Application 2019 & 2032
- Table 79: Global Cyber Warfare Industry Revenue Million Forecast, by Country 2019 & 2032
- Table 80: Global Cyber Warfare Industry Volume K Unit Forecast, by Country 2019 & 2032
- Table 81: United States Cyber Warfare Industry Revenue (Million) Forecast, by Application 2019 & 2032
- Table 82: United States Cyber Warfare Industry Volume (K Unit) Forecast, by Application 2019 & 2032
- Table 83: Canada Cyber Warfare Industry Revenue (Million) Forecast, by Application 2019 & 2032
- Table 84: Canada Cyber Warfare Industry Volume (K Unit) Forecast, by Application 2019 & 2032
- Table 85: Mexico Cyber Warfare Industry Revenue (Million) Forecast, by Application 2019 & 2032
- Table 86: Mexico Cyber Warfare Industry Volume (K Unit) Forecast, by Application 2019 & 2032
- Table 87: Global Cyber Warfare Industry Revenue Million Forecast, by Country 2019 & 2032
- Table 88: Global Cyber Warfare Industry Volume K Unit Forecast, by Country 2019 & 2032
- Table 89: United Arab Emirates Cyber Warfare Industry Revenue (Million) Forecast, by Application 2019 & 2032
- Table 90: United Arab Emirates Cyber Warfare Industry Volume (K Unit) Forecast, by Application 2019 & 2032
- Table 91: Saudi Arabia Cyber Warfare Industry Revenue (Million) Forecast, by Application 2019 & 2032
- Table 92: Saudi Arabia Cyber Warfare Industry Volume (K Unit) Forecast, by Application 2019 & 2032
- Table 93: South Africa Cyber Warfare Industry Revenue (Million) Forecast, by Application 2019 & 2032
- Table 94: South Africa Cyber Warfare Industry Volume (K Unit) Forecast, by Application 2019 & 2032
- Table 95: Rest of Middle East and Africa Cyber Warfare Industry Revenue (Million) Forecast, by Application 2019 & 2032
- Table 96: Rest of Middle East and Africa Cyber Warfare Industry Volume (K Unit) Forecast, by Application 2019 & 2032
- Table 97: Global Cyber Warfare Industry Revenue Million Forecast, by End-user Industry 2019 & 2032
- Table 98: Global Cyber Warfare Industry Volume K Unit Forecast, by End-user Industry 2019 & 2032
- Table 99: Global Cyber Warfare Industry Revenue Million Forecast, by Country 2019 & 2032
- Table 100: Global Cyber Warfare Industry Volume K Unit Forecast, by Country 2019 & 2032
- Table 101: Global Cyber Warfare Industry Revenue Million Forecast, by End-user Industry 2019 & 2032
- Table 102: Global Cyber Warfare Industry Volume K Unit Forecast, by End-user Industry 2019 & 2032
- Table 103: Global Cyber Warfare Industry Revenue Million Forecast, by Country 2019 & 2032
- Table 104: Global Cyber Warfare Industry Volume K Unit Forecast, by Country 2019 & 2032
- Table 105: Global Cyber Warfare Industry Revenue Million Forecast, by End-user Industry 2019 & 2032
- Table 106: Global Cyber Warfare Industry Volume K Unit Forecast, by End-user Industry 2019 & 2032
- Table 107: Global Cyber Warfare Industry Revenue Million Forecast, by Country 2019 & 2032
- Table 108: Global Cyber Warfare Industry Volume K Unit Forecast, by Country 2019 & 2032
- Table 109: Global Cyber Warfare Industry Revenue Million Forecast, by End-user Industry 2019 & 2032
- Table 110: Global Cyber Warfare Industry Volume K Unit Forecast, by End-user Industry 2019 & 2032
- Table 111: Global Cyber Warfare Industry Revenue Million Forecast, by Country 2019 & 2032
- Table 112: Global Cyber Warfare Industry Volume K Unit Forecast, by Country 2019 & 2032
- Table 113: Global Cyber Warfare Industry Revenue Million Forecast, by End-user Industry 2019 & 2032
- Table 114: Global Cyber Warfare Industry Volume K Unit Forecast, by End-user Industry 2019 & 2032
- Table 115: Global Cyber Warfare Industry Revenue Million Forecast, by Country 2019 & 2032
- Table 116: Global Cyber Warfare Industry Volume K Unit Forecast, by Country 2019 & 2032
- Table 117: Global Cyber Warfare Industry Revenue Million Forecast, by End-user Industry 2019 & 2032
- Table 118: Global Cyber Warfare Industry Volume K Unit Forecast, by End-user Industry 2019 & 2032
- Table 119: Global Cyber Warfare Industry Revenue Million Forecast, by Country 2019 & 2032
- Table 120: Global Cyber Warfare Industry Volume K Unit Forecast, by Country 2019 & 2032
Frequently Asked Questions
1. What is the projected Compound Annual Growth Rate (CAGR) of the Cyber Warfare Industry?
The projected CAGR is approximately 19.08%.
2. Which companies are prominent players in the Cyber Warfare Industry?
Key companies in the market include General Dynamic Corporation, Raytheon Technologies Corporation, Leonardo SpA, Lockheed Martin Corporation, BAE Systems PLC, Airbus S, DXC Technology Company, Booz Allen Hamilton Inc, The Boeing Company, Mandiant Inc (fireeye Inc ).
3. What are the main segments of the Cyber Warfare Industry?
The market segments include End-user Industry.
4. Can you provide details about the market size?
The market size is estimated to be USD 77.54 Million as of 2022.
5. What are some drivers contributing to market growth?
Increasing Concerns Regarding National Security; Increase in Defense Spending.
6. What are the notable trends driving market growth?
Defense Sector to be the Largest End User.
7. Are there any restraints impacting market growth?
Poor Understanding of Industrial Control Systems; Lack of Interoperability Between Products.
8. Can you provide examples of recent developments in the market?
April 2023 - Cyber security startup Safe Security raised USD 50 Million in its Series B funding round led by Sorenson Capital. The startup announced it continues to focus on innovating ahead of the market and lead with its real-time, data-driven platform for managing and mitigating cyber risk.
9. What pricing options are available for accessing the report?
Pricing options include single-user, multi-user, and enterprise licenses priced at USD 4750, USD 5250, and USD 8750 respectively.
10. Is the market size provided in terms of value or volume?
The market size is provided in terms of value, measured in Million and volume, measured in K Unit.
11. Are there any specific market keywords associated with the report?
Yes, the market keyword associated with the report is "Cyber Warfare Industry," which aids in identifying and referencing the specific market segment covered.
12. How do I determine which pricing option suits my needs best?
The pricing options vary based on user requirements and access needs. Individual users may opt for single-user licenses, while businesses requiring broader access may choose multi-user or enterprise licenses for cost-effective access to the report.
13. Are there any additional resources or data provided in the Cyber Warfare Industry report?
While the report offers comprehensive insights, it's advisable to review the specific contents or supplementary materials provided to ascertain if additional resources or data are available.
14. How can I stay updated on further developments or reports in the Cyber Warfare Industry?
To stay informed about further developments, trends, and reports in the Cyber Warfare Industry, consider subscribing to industry newsletters, following relevant companies and organizations, or regularly checking reputable industry news sources and publications.
Methodology
Step 1 - Identification of Relevant Samples Size from Population Database


Step 2 - Approaches for Defining Global Market Size (Value, Volume* & Price*)

Note*: In applicable scenarios
Step 3 - Data Sources
Primary Research
- Web Analytics
- Survey Reports
- Research Institute
- Latest Research Reports
- Opinion Leaders
Secondary Research
- Annual Reports
- White Paper
- Latest Press Release
- Industry Association
- Paid Database
- Investor Presentations

Step 4 - Data Triangulation
Involves using different sources of information in order to increase the validity of a study
These sources are likely to be stakeholders in a program - participants, other researchers, program staff, other community members, and so on.
Then we put all data in single framework & apply various statistical tools to find out the dynamic on the market.
During the analysis stage, feedback from the stakeholder groups would be compared to determine areas of agreement as well as areas of divergence
