

Key Insights
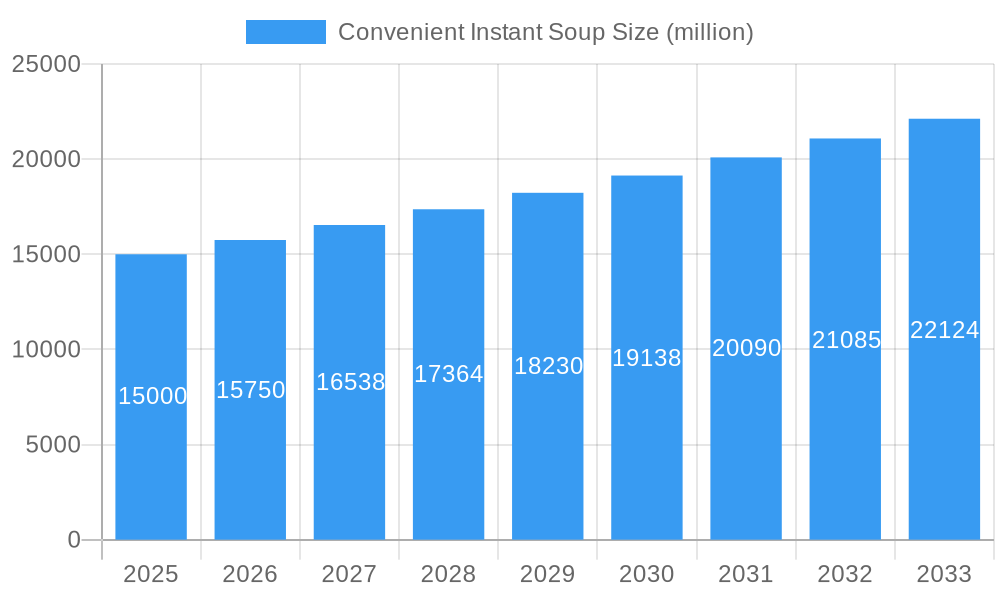
The convenient instant soup market is poised for significant expansion, driven by consumer demand for expedient, cost-effective, and readily available meal solutions. Escalating demand for convenience foods, fueled by evolving lifestyles, is a primary growth catalyst. The sector is seeing a notable pivot towards healthier and more varied offerings, with manufacturers prioritizing natural ingredients, reduced sodium, and novel flavor profiles. The proliferation of plant-based and gluten-free alternatives is broadening consumer reach and market inclusivity. Intense competition from global leaders such as Nestlé, Unilever, and Campbell Soup, alongside agile regional brands, underscores the importance of strategic alliances, continuous product innovation, and impactful marketing for market penetration. The market size is projected to reach $50.58 billion in 2025, with a compound annual growth rate (CAGR) of 6.83% from 2025 to 2033. This growth is further bolstered by the increasing adoption of online grocery platforms and meal delivery services, enhancing accessibility to a wide spectrum of instant soup selections.
Convenient Instant Soup Market Size (In Billion)
Despite a robust growth outlook, the market faces inherent challenges. Volatility in raw material costs, particularly agricultural inputs, can affect profit margins. Evolving consumer preferences and emerging dietary trends necessitate ongoing product development and market adaptation. Additionally, consumer perceptions regarding the nutritional value of certain instant soup products present a potential constraint. However, the industry's proactive development of healthier alternatives is effectively addressing these concerns. Market segmentation highlights diverse consumer needs, spanning from traditional broth-based options to premium gourmet varieties. Regional taste preferences also contribute to market complexity. North America and Europe currently lead market share, with the Asia-Pacific region projected for substantial growth, driven by increasing disposable incomes and urbanization.
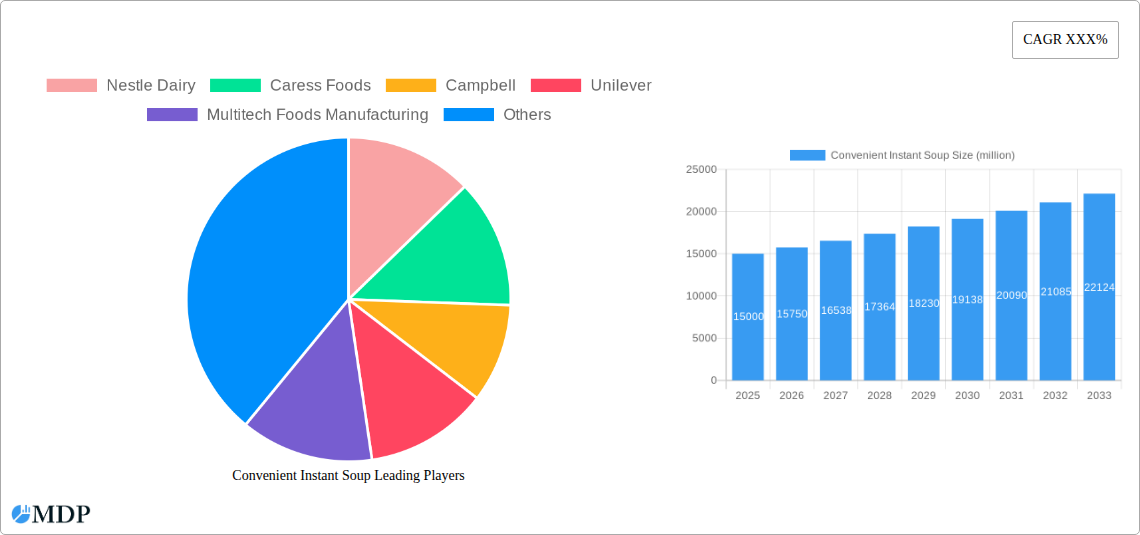
Convenient Instant Soup Company Market Share
Convenient Instant Soup Market Report: 2019-2033
Unlocking Billions in Growth: A Comprehensive Analysis of the Convenient Instant Soup Market
This comprehensive report provides an in-depth analysis of the global convenient instant soup market, offering invaluable insights for industry stakeholders, investors, and strategic decision-makers. We delve into market dynamics, industry trends, leading players, and future opportunities, covering the period from 2019 to 2033. The report leverages rigorous data analysis and expert insights to deliver actionable intelligence for informed decision-making. With a base year of 2025 and a forecast period spanning 2025-2033, this report is your essential guide to navigating the evolving landscape of the convenient instant soup market. We project a market exceeding $XX billion by 2033.
Convenient Instant Soup Market Dynamics & Concentration
The convenient instant soup market, valued at $XX billion in 2024, is characterized by a moderately concentrated landscape with several major players holding significant market share. Nestle Dairy, Campbell, and Unilever are among the prominent players, exhibiting a combined market share of approximately xx%. However, the market also presents opportunities for smaller, specialized players focused on niche segments like organic or gourmet instant soups.
Market Dynamics:
- Innovation Drivers: The demand for healthier, more convenient, and flavorful options fuels innovation. This includes the development of organic soups, gluten-free options, and single-serving packs tailored to specific dietary needs.
- Regulatory Frameworks: Food safety regulations and labeling requirements significantly influence product development and market access. Compliance with these regulations is crucial for all market participants.
- Product Substitutes: Ready-to-eat meals, pre-packaged salads, and other quick-meal options pose competitive challenges. Differentiation through unique flavors, ingredients, and health benefits is vital.
- End-User Trends: Busy lifestyles and growing demand for convenience are driving market growth. The increasing popularity of online grocery shopping further enhances accessibility.
- M&A Activities: The industry has witnessed xx M&A deals in the past five years, driven by a strategic expansion into new markets and product portfolios. This consolidation trend will likely continue.
Convenient Instant Soup Industry Trends & Analysis
The convenient instant soup market exhibits a robust CAGR of xx% during the forecast period (2025-2033), propelled by several key factors. Technological advancements have led to the introduction of innovative packaging formats and improved preservation methods, extending shelf life and enhancing convenience. Changing consumer preferences, with a growing focus on health and wellness, are also driving demand for healthier and more nutritious instant soup options. The market penetration of convenient instant soup is estimated at xx% in 2025, with significant growth potential in emerging markets. Competitive dynamics are characterized by intense competition among established players and the emergence of new entrants offering innovative product variations. The market is also witnessing a shift towards premiumization, with consumers increasingly willing to pay more for high-quality ingredients and unique flavors.
Leading Markets & Segments in Convenient Instant Soup
The Asia-Pacific region is currently the dominant market for convenient instant soup, accounting for approximately xx% of the global market share in 2024. This dominance can be attributed to several factors:
Key Drivers:
- Rapidly growing urban population and increasing disposable incomes.
- Well-established distribution networks and widespread availability.
- Strong preference for convenient and affordable food options.
Dominance Analysis: The large and rapidly growing population, coupled with a high preference for convenient food options, makes the Asia-Pacific region a key driver of global convenient instant soup demand. This region is projected to continue its dominance in the years to come due to sustained economic growth, urbanization, and evolving consumer preferences.
Convenient Instant Soup Product Developments
Recent innovations in the instant soup market include the introduction of single-serve cups with unique flavor combinations and healthier ingredients, such as organic vegetables and lean proteins. Companies are also incorporating technological advancements in packaging to improve shelf life and maintain product quality. This emphasis on healthier options and convenient packaging is crucial to meeting evolving consumer preferences and gaining a competitive advantage in a crowded market.
Key Drivers of Convenient Instant Soup Growth
Several key factors are driving the growth of the convenient instant soup market:
- Technological advancements: Improved packaging and preservation technologies are extending shelf life and enhancing convenience.
- Economic factors: Rising disposable incomes, especially in developing economies, are fueling demand for convenient food options.
- Regulatory changes: Supportive government policies promoting food processing and distribution are creating a more favorable environment for market growth.
Challenges in the Convenient Instant Soup Market
The convenient instant soup market faces several challenges:
- Intense competition: The market is highly competitive, with numerous established players and new entrants vying for market share.
- Supply chain disruptions: Global supply chain vulnerabilities can impact the availability of raw materials and affect production costs.
- Changing consumer preferences: Consumers are increasingly demanding healthier and more nutritious options, posing a challenge for manufacturers who rely on processed ingredients.
Emerging Opportunities in Convenient Instant Soup
The convenient instant soup market presents several exciting opportunities for growth. The development of functional soups enriched with vitamins and minerals caters to the growing health-conscious population. Strategic partnerships and collaborations can lead to innovation in product development and market expansion. Furthermore, exploring new distribution channels, such as online platforms and direct-to-consumer sales, presents a significant opportunity for reaching a broader customer base.
Leading Players in the Convenient Instant Soup Sector
- Nestle Dairy
- Caress Foods
- Campbell
- Unilever
- Multitech Foods Manufacturing
- Prakash Masala
- B&G Foods
- Baxters Food Group Limited
- Haifusheng
- Associated British Foods
- Shandong Subo Food
- Anderson House Foods
- General Mills
- Hain Celestial Group
- House Foods Group
- The Kraft Heinz Company
- Kroger
- Nissin Foods
Key Milestones in Convenient Instant Soup Industry
- 2020: Increased focus on sustainable packaging by several leading brands.
- 2021: Launch of several new organic and plant-based instant soup options.
- 2022: A significant M&A deal involving two major players, reshaping the market landscape.
- 2023: Growing adoption of e-commerce channels for instant soup sales.
Strategic Outlook for Convenient Instant Soup Market
The convenient instant soup market is poised for continued growth, driven by sustained demand for convenience, health-conscious options, and innovative product offerings. Companies focused on product diversification, strategic partnerships, and effective marketing strategies are well-positioned to capitalize on the market's considerable potential. Expanding into new markets and investing in research and development to meet evolving consumer preferences are crucial for long-term success.
Convenient Instant Soup Segmentation
-
1. Application
- 1.1. Online Sales
- 1.2. Offline Sales
-
2. Type
- 2.1. Bagged
- 2.2. Barreled
- 2.3. Others
Convenient Instant Soup Segmentation By Geography
-
1. North America
- 1.1. United States
- 1.2. Canada
- 1.3. Mexico
-
2. South America
- 2.1. Brazil
- 2.2. Argentina
- 2.3. Rest of South America
-
3. Europe
- 3.1. United Kingdom
- 3.2. Germany
- 3.3. France
- 3.4. Italy
- 3.5. Spain
- 3.6. Russia
- 3.7. Benelux
- 3.8. Nordics
- 3.9. Rest of Europe
-
4. Middle East & Africa
- 4.1. Turkey
- 4.2. Israel
- 4.3. GCC
- 4.4. North Africa
- 4.5. South Africa
- 4.6. Rest of Middle East & Africa
-
5. Asia Pacific
- 5.1. China
- 5.2. India
- 5.3. Japan
- 5.4. South Korea
- 5.5. ASEAN
- 5.6. Oceania
- 5.7. Rest of Asia Pacific

Convenient Instant Soup Regional Market Share
Geographic Coverage of Convenient Instant Soup
Convenient Instant Soup REPORT HIGHLIGHTS
| Aspects | Details |
|---|---|
| Study Period | 2020-2034 |
| Base Year | 2025 |
| Estimated Year | 2026 |
| Forecast Period | 2026-2034 |
| Historical Period | 2020-2025 |
| Growth Rate | CAGR of 6.83% from 2020-2034 |
| Segmentation |
|
Table of Contents
- 1. Introduction
- 1.1. Research Scope
- 1.2. Market Segmentation
- 1.3. Research Objective
- 1.4. Definitions and Assumptions
- 2. Executive Summary
- 2.1. Market Snapshot
- 3. Market Dynamics
- 3.1. Market Drivers
- 3.2. Market Restrains
- 3.3. Market Trends
- 3.4. Market Opportunities
- 4. Market Factor Analysis
- 4.1. Porters Five Forces
- 4.1.1. Bargaining Power of Suppliers
- 4.1.2. Bargaining Power of Buyers
- 4.1.3. Threat of New Entrants
- 4.1.4. Threat of Substitutes
- 4.1.5. Competitive Rivalry
- 4.2. PESTEL analysis
- 4.3. BCG Analysis
- 4.3.1. Stars (High Growth, High Market Share)
- 4.3.2. Cash Cows (Low Growth, High Market Share)
- 4.3.3. Question Mark (High Growth, Low Market Share)
- 4.3.4. Dogs (Low Growth, Low Market Share)
- 4.4. Ansoff Matrix Analysis
- 4.5. Supply Chain Analysis
- 4.6. Regulatory Landscape
- 4.7. Current Market Potential and Opportunity Assessment (TAM–SAM–SOM Framework)
- 4.8. MDP Analyst Note
- 4.1. Porters Five Forces
- 5. Market Analysis, Insights and Forecast 2021-2033
- 5.1. Market Analysis, Insights and Forecast - by Application
- 5.1.1. Online Sales
- 5.1.2. Offline Sales
- 5.2. Market Analysis, Insights and Forecast - by Type
- 5.2.1. Bagged
- 5.2.2. Barreled
- 5.2.3. Others
- 5.3. Market Analysis, Insights and Forecast - by Region
- 5.3.1. North America
- 5.3.2. South America
- 5.3.3. Europe
- 5.3.4. Middle East & Africa
- 5.3.5. Asia Pacific
- 5.1. Market Analysis, Insights and Forecast - by Application
- 6. Global Convenient Instant Soup Analysis, Insights and Forecast, 2021-2033
- 6.1. Market Analysis, Insights and Forecast - by Application
- 6.1.1. Online Sales
- 6.1.2. Offline Sales
- 6.2. Market Analysis, Insights and Forecast - by Type
- 6.2.1. Bagged
- 6.2.2. Barreled
- 6.2.3. Others
- 6.1. Market Analysis, Insights and Forecast - by Application
- 7. North America Convenient Instant Soup Analysis, Insights and Forecast, 2020-2032
- 7.1. Market Analysis, Insights and Forecast - by Application
- 7.1.1. Online Sales
- 7.1.2. Offline Sales
- 7.2. Market Analysis, Insights and Forecast - by Type
- 7.2.1. Bagged
- 7.2.2. Barreled
- 7.2.3. Others
- 7.1. Market Analysis, Insights and Forecast - by Application
- 8. South America Convenient Instant Soup Analysis, Insights and Forecast, 2020-2032
- 8.1. Market Analysis, Insights and Forecast - by Application
- 8.1.1. Online Sales
- 8.1.2. Offline Sales
- 8.2. Market Analysis, Insights and Forecast - by Type
- 8.2.1. Bagged
- 8.2.2. Barreled
- 8.2.3. Others
- 8.1. Market Analysis, Insights and Forecast - by Application
- 9. Europe Convenient Instant Soup Analysis, Insights and Forecast, 2020-2032
- 9.1. Market Analysis, Insights and Forecast - by Application
- 9.1.1. Online Sales
- 9.1.2. Offline Sales
- 9.2. Market Analysis, Insights and Forecast - by Type
- 9.2.1. Bagged
- 9.2.2. Barreled
- 9.2.3. Others
- 9.1. Market Analysis, Insights and Forecast - by Application
- 10. Middle East & Africa Convenient Instant Soup Analysis, Insights and Forecast, 2020-2032
- 10.1. Market Analysis, Insights and Forecast - by Application
- 10.1.1. Online Sales
- 10.1.2. Offline Sales
- 10.2. Market Analysis, Insights and Forecast - by Type
- 10.2.1. Bagged
- 10.2.2. Barreled
- 10.2.3. Others
- 10.1. Market Analysis, Insights and Forecast - by Application
- 11. Asia Pacific Convenient Instant Soup Analysis, Insights and Forecast, 2020-2032
- 11.1. Market Analysis, Insights and Forecast - by Application
- 11.1.1. Online Sales
- 11.1.2. Offline Sales
- 11.2. Market Analysis, Insights and Forecast - by Type
- 11.2.1. Bagged
- 11.2.2. Barreled
- 11.2.3. Others
- 11.1. Market Analysis, Insights and Forecast - by Application
- 12. Competitive Analysis
- 12.1. Company Profiles
- 12.1.1 Nestle Dairy
- 12.1.1.1. Company Overview
- 12.1.1.2. Products
- 12.1.1.3. Company Financials
- 12.1.1.4. SWOT Analysis
- 12.1.2 Caress Foods
- 12.1.2.1. Company Overview
- 12.1.2.2. Products
- 12.1.2.3. Company Financials
- 12.1.2.4. SWOT Analysis
- 12.1.3 Campbell
- 12.1.3.1. Company Overview
- 12.1.3.2. Products
- 12.1.3.3. Company Financials
- 12.1.3.4. SWOT Analysis
- 12.1.4 Unilever
- 12.1.4.1. Company Overview
- 12.1.4.2. Products
- 12.1.4.3. Company Financials
- 12.1.4.4. SWOT Analysis
- 12.1.5 Multitech Foods Manufacturing
- 12.1.5.1. Company Overview
- 12.1.5.2. Products
- 12.1.5.3. Company Financials
- 12.1.5.4. SWOT Analysis
- 12.1.6 Prakash Masala
- 12.1.6.1. Company Overview
- 12.1.6.2. Products
- 12.1.6.3. Company Financials
- 12.1.6.4. SWOT Analysis
- 12.1.7 B&G Foods
- 12.1.7.1. Company Overview
- 12.1.7.2. Products
- 12.1.7.3. Company Financials
- 12.1.7.4. SWOT Analysis
- 12.1.8 Baxters Food Group Limited
- 12.1.8.1. Company Overview
- 12.1.8.2. Products
- 12.1.8.3. Company Financials
- 12.1.8.4. SWOT Analysis
- 12.1.9 Haifusheng
- 12.1.9.1. Company Overview
- 12.1.9.2. Products
- 12.1.9.3. Company Financials
- 12.1.9.4. SWOT Analysis
- 12.1.10 Associated British Foods
- 12.1.10.1. Company Overview
- 12.1.10.2. Products
- 12.1.10.3. Company Financials
- 12.1.10.4. SWOT Analysis
- 12.1.11 Shandong Subo Food
- 12.1.11.1. Company Overview
- 12.1.11.2. Products
- 12.1.11.3. Company Financials
- 12.1.11.4. SWOT Analysis
- 12.1.12 Anderson House Foods
- 12.1.12.1. Company Overview
- 12.1.12.2. Products
- 12.1.12.3. Company Financials
- 12.1.12.4. SWOT Analysis
- 12.1.13 General Mills
- 12.1.13.1. Company Overview
- 12.1.13.2. Products
- 12.1.13.3. Company Financials
- 12.1.13.4. SWOT Analysis
- 12.1.14 Hain Celestial Group
- 12.1.14.1. Company Overview
- 12.1.14.2. Products
- 12.1.14.3. Company Financials
- 12.1.14.4. SWOT Analysis
- 12.1.15 House Foods Group
- 12.1.15.1. Company Overview
- 12.1.15.2. Products
- 12.1.15.3. Company Financials
- 12.1.15.4. SWOT Analysis
- 12.1.16 The Kraft Heinz Company
- 12.1.16.1. Company Overview
- 12.1.16.2. Products
- 12.1.16.3. Company Financials
- 12.1.16.4. SWOT Analysis
- 12.1.17 Kroger
- 12.1.17.1. Company Overview
- 12.1.17.2. Products
- 12.1.17.3. Company Financials
- 12.1.17.4. SWOT Analysis
- 12.1.18 Nissin Foods
- 12.1.18.1. Company Overview
- 12.1.18.2. Products
- 12.1.18.3. Company Financials
- 12.1.18.4. SWOT Analysis
- 12.1.1 Nestle Dairy
- 12.2. Market Entropy
- 12.2.1 Company's Key Areas Served
- 12.2.2 Recent Developments
- 12.3. Company Market Share Analysis 2025
- 12.3.1 Top 5 Companies Market Share Analysis
- 12.3.2 Top 3 Companies Market Share Analysis
- 12.4. List of Potential Customers
- 13. Research Methodology
List of Figures
- Figure 1: Global Convenient Instant Soup Revenue Breakdown (billion, %) by Region 2025 & 2033
- Figure 2: Global Convenient Instant Soup Volume Breakdown (K, %) by Region 2025 & 2033
- Figure 3: North America Convenient Instant Soup Revenue (billion), by Application 2025 & 2033
- Figure 4: North America Convenient Instant Soup Volume (K), by Application 2025 & 2033
- Figure 5: North America Convenient Instant Soup Revenue Share (%), by Application 2025 & 2033
- Figure 6: North America Convenient Instant Soup Volume Share (%), by Application 2025 & 2033
- Figure 7: North America Convenient Instant Soup Revenue (billion), by Type 2025 & 2033
- Figure 8: North America Convenient Instant Soup Volume (K), by Type 2025 & 2033
- Figure 9: North America Convenient Instant Soup Revenue Share (%), by Type 2025 & 2033
- Figure 10: North America Convenient Instant Soup Volume Share (%), by Type 2025 & 2033
- Figure 11: North America Convenient Instant Soup Revenue (billion), by Country 2025 & 2033
- Figure 12: North America Convenient Instant Soup Volume (K), by Country 2025 & 2033
- Figure 13: North America Convenient Instant Soup Revenue Share (%), by Country 2025 & 2033
- Figure 14: North America Convenient Instant Soup Volume Share (%), by Country 2025 & 2033
- Figure 15: South America Convenient Instant Soup Revenue (billion), by Application 2025 & 2033
- Figure 16: South America Convenient Instant Soup Volume (K), by Application 2025 & 2033
- Figure 17: South America Convenient Instant Soup Revenue Share (%), by Application 2025 & 2033
- Figure 18: South America Convenient Instant Soup Volume Share (%), by Application 2025 & 2033
- Figure 19: South America Convenient Instant Soup Revenue (billion), by Type 2025 & 2033
- Figure 20: South America Convenient Instant Soup Volume (K), by Type 2025 & 2033
- Figure 21: South America Convenient Instant Soup Revenue Share (%), by Type 2025 & 2033
- Figure 22: South America Convenient Instant Soup Volume Share (%), by Type 2025 & 2033
- Figure 23: South America Convenient Instant Soup Revenue (billion), by Country 2025 & 2033
- Figure 24: South America Convenient Instant Soup Volume (K), by Country 2025 & 2033
- Figure 25: South America Convenient Instant Soup Revenue Share (%), by Country 2025 & 2033
- Figure 26: South America Convenient Instant Soup Volume Share (%), by Country 2025 & 2033
- Figure 27: Europe Convenient Instant Soup Revenue (billion), by Application 2025 & 2033
- Figure 28: Europe Convenient Instant Soup Volume (K), by Application 2025 & 2033
- Figure 29: Europe Convenient Instant Soup Revenue Share (%), by Application 2025 & 2033
- Figure 30: Europe Convenient Instant Soup Volume Share (%), by Application 2025 & 2033
- Figure 31: Europe Convenient Instant Soup Revenue (billion), by Type 2025 & 2033
- Figure 32: Europe Convenient Instant Soup Volume (K), by Type 2025 & 2033
- Figure 33: Europe Convenient Instant Soup Revenue Share (%), by Type 2025 & 2033
- Figure 34: Europe Convenient Instant Soup Volume Share (%), by Type 2025 & 2033
- Figure 35: Europe Convenient Instant Soup Revenue (billion), by Country 2025 & 2033
- Figure 36: Europe Convenient Instant Soup Volume (K), by Country 2025 & 2033
- Figure 37: Europe Convenient Instant Soup Revenue Share (%), by Country 2025 & 2033
- Figure 38: Europe Convenient Instant Soup Volume Share (%), by Country 2025 & 2033
- Figure 39: Middle East & Africa Convenient Instant Soup Revenue (billion), by Application 2025 & 2033
- Figure 40: Middle East & Africa Convenient Instant Soup Volume (K), by Application 2025 & 2033
- Figure 41: Middle East & Africa Convenient Instant Soup Revenue Share (%), by Application 2025 & 2033
- Figure 42: Middle East & Africa Convenient Instant Soup Volume Share (%), by Application 2025 & 2033
- Figure 43: Middle East & Africa Convenient Instant Soup Revenue (billion), by Type 2025 & 2033
- Figure 44: Middle East & Africa Convenient Instant Soup Volume (K), by Type 2025 & 2033
- Figure 45: Middle East & Africa Convenient Instant Soup Revenue Share (%), by Type 2025 & 2033
- Figure 46: Middle East & Africa Convenient Instant Soup Volume Share (%), by Type 2025 & 2033
- Figure 47: Middle East & Africa Convenient Instant Soup Revenue (billion), by Country 2025 & 2033
- Figure 48: Middle East & Africa Convenient Instant Soup Volume (K), by Country 2025 & 2033
- Figure 49: Middle East & Africa Convenient Instant Soup Revenue Share (%), by Country 2025 & 2033
- Figure 50: Middle East & Africa Convenient Instant Soup Volume Share (%), by Country 2025 & 2033
- Figure 51: Asia Pacific Convenient Instant Soup Revenue (billion), by Application 2025 & 2033
- Figure 52: Asia Pacific Convenient Instant Soup Volume (K), by Application 2025 & 2033
- Figure 53: Asia Pacific Convenient Instant Soup Revenue Share (%), by Application 2025 & 2033
- Figure 54: Asia Pacific Convenient Instant Soup Volume Share (%), by Application 2025 & 2033
- Figure 55: Asia Pacific Convenient Instant Soup Revenue (billion), by Type 2025 & 2033
- Figure 56: Asia Pacific Convenient Instant Soup Volume (K), by Type 2025 & 2033
- Figure 57: Asia Pacific Convenient Instant Soup Revenue Share (%), by Type 2025 & 2033
- Figure 58: Asia Pacific Convenient Instant Soup Volume Share (%), by Type 2025 & 2033
- Figure 59: Asia Pacific Convenient Instant Soup Revenue (billion), by Country 2025 & 2033
- Figure 60: Asia Pacific Convenient Instant Soup Volume (K), by Country 2025 & 2033
- Figure 61: Asia Pacific Convenient Instant Soup Revenue Share (%), by Country 2025 & 2033
- Figure 62: Asia Pacific Convenient Instant Soup Volume Share (%), by Country 2025 & 2033
List of Tables
- Table 1: Global Convenient Instant Soup Revenue billion Forecast, by Application 2020 & 2033
- Table 2: Global Convenient Instant Soup Volume K Forecast, by Application 2020 & 2033
- Table 3: Global Convenient Instant Soup Revenue billion Forecast, by Type 2020 & 2033
- Table 4: Global Convenient Instant Soup Volume K Forecast, by Type 2020 & 2033
- Table 5: Global Convenient Instant Soup Revenue billion Forecast, by Region 2020 & 2033
- Table 6: Global Convenient Instant Soup Volume K Forecast, by Region 2020 & 2033
- Table 7: Global Convenient Instant Soup Revenue billion Forecast, by Application 2020 & 2033
- Table 8: Global Convenient Instant Soup Volume K Forecast, by Application 2020 & 2033
- Table 9: Global Convenient Instant Soup Revenue billion Forecast, by Type 2020 & 2033
- Table 10: Global Convenient Instant Soup Volume K Forecast, by Type 2020 & 2033
- Table 11: Global Convenient Instant Soup Revenue billion Forecast, by Country 2020 & 2033
- Table 12: Global Convenient Instant Soup Volume K Forecast, by Country 2020 & 2033
- Table 13: United States Convenient Instant Soup Revenue (billion) Forecast, by Application 2020 & 2033
- Table 14: United States Convenient Instant Soup Volume (K) Forecast, by Application 2020 & 2033
- Table 15: Canada Convenient Instant Soup Revenue (billion) Forecast, by Application 2020 & 2033
- Table 16: Canada Convenient Instant Soup Volume (K) Forecast, by Application 2020 & 2033
- Table 17: Mexico Convenient Instant Soup Revenue (billion) Forecast, by Application 2020 & 2033
- Table 18: Mexico Convenient Instant Soup Volume (K) Forecast, by Application 2020 & 2033
- Table 19: Global Convenient Instant Soup Revenue billion Forecast, by Application 2020 & 2033
- Table 20: Global Convenient Instant Soup Volume K Forecast, by Application 2020 & 2033
- Table 21: Global Convenient Instant Soup Revenue billion Forecast, by Type 2020 & 2033
- Table 22: Global Convenient Instant Soup Volume K Forecast, by Type 2020 & 2033
- Table 23: Global Convenient Instant Soup Revenue billion Forecast, by Country 2020 & 2033
- Table 24: Global Convenient Instant Soup Volume K Forecast, by Country 2020 & 2033
- Table 25: Brazil Convenient Instant Soup Revenue (billion) Forecast, by Application 2020 & 2033
- Table 26: Brazil Convenient Instant Soup Volume (K) Forecast, by Application 2020 & 2033
- Table 27: Argentina Convenient Instant Soup Revenue (billion) Forecast, by Application 2020 & 2033
- Table 28: Argentina Convenient Instant Soup Volume (K) Forecast, by Application 2020 & 2033
- Table 29: Rest of South America Convenient Instant Soup Revenue (billion) Forecast, by Application 2020 & 2033
- Table 30: Rest of South America Convenient Instant Soup Volume (K) Forecast, by Application 2020 & 2033
- Table 31: Global Convenient Instant Soup Revenue billion Forecast, by Application 2020 & 2033
- Table 32: Global Convenient Instant Soup Volume K Forecast, by Application 2020 & 2033
- Table 33: Global Convenient Instant Soup Revenue billion Forecast, by Type 2020 & 2033
- Table 34: Global Convenient Instant Soup Volume K Forecast, by Type 2020 & 2033
- Table 35: Global Convenient Instant Soup Revenue billion Forecast, by Country 2020 & 2033
- Table 36: Global Convenient Instant Soup Volume K Forecast, by Country 2020 & 2033
- Table 37: United Kingdom Convenient Instant Soup Revenue (billion) Forecast, by Application 2020 & 2033
- Table 38: United Kingdom Convenient Instant Soup Volume (K) Forecast, by Application 2020 & 2033
- Table 39: Germany Convenient Instant Soup Revenue (billion) Forecast, by Application 2020 & 2033
- Table 40: Germany Convenient Instant Soup Volume (K) Forecast, by Application 2020 & 2033
- Table 41: France Convenient Instant Soup Revenue (billion) Forecast, by Application 2020 & 2033
- Table 42: France Convenient Instant Soup Volume (K) Forecast, by Application 2020 & 2033
- Table 43: Italy Convenient Instant Soup Revenue (billion) Forecast, by Application 2020 & 2033
- Table 44: Italy Convenient Instant Soup Volume (K) Forecast, by Application 2020 & 2033
- Table 45: Spain Convenient Instant Soup Revenue (billion) Forecast, by Application 2020 & 2033
- Table 46: Spain Convenient Instant Soup Volume (K) Forecast, by Application 2020 & 2033
- Table 47: Russia Convenient Instant Soup Revenue (billion) Forecast, by Application 2020 & 2033
- Table 48: Russia Convenient Instant Soup Volume (K) Forecast, by Application 2020 & 2033
- Table 49: Benelux Convenient Instant Soup Revenue (billion) Forecast, by Application 2020 & 2033
- Table 50: Benelux Convenient Instant Soup Volume (K) Forecast, by Application 2020 & 2033
- Table 51: Nordics Convenient Instant Soup Revenue (billion) Forecast, by Application 2020 & 2033
- Table 52: Nordics Convenient Instant Soup Volume (K) Forecast, by Application 2020 & 2033
- Table 53: Rest of Europe Convenient Instant Soup Revenue (billion) Forecast, by Application 2020 & 2033
- Table 54: Rest of Europe Convenient Instant Soup Volume (K) Forecast, by Application 2020 & 2033
- Table 55: Global Convenient Instant Soup Revenue billion Forecast, by Application 2020 & 2033
- Table 56: Global Convenient Instant Soup Volume K Forecast, by Application 2020 & 2033
- Table 57: Global Convenient Instant Soup Revenue billion Forecast, by Type 2020 & 2033
- Table 58: Global Convenient Instant Soup Volume K Forecast, by Type 2020 & 2033
- Table 59: Global Convenient Instant Soup Revenue billion Forecast, by Country 2020 & 2033
- Table 60: Global Convenient Instant Soup Volume K Forecast, by Country 2020 & 2033
- Table 61: Turkey Convenient Instant Soup Revenue (billion) Forecast, by Application 2020 & 2033
- Table 62: Turkey Convenient Instant Soup Volume (K) Forecast, by Application 2020 & 2033
- Table 63: Israel Convenient Instant Soup Revenue (billion) Forecast, by Application 2020 & 2033
- Table 64: Israel Convenient Instant Soup Volume (K) Forecast, by Application 2020 & 2033
- Table 65: GCC Convenient Instant Soup Revenue (billion) Forecast, by Application 2020 & 2033
- Table 66: GCC Convenient Instant Soup Volume (K) Forecast, by Application 2020 & 2033
- Table 67: North Africa Convenient Instant Soup Revenue (billion) Forecast, by Application 2020 & 2033
- Table 68: North Africa Convenient Instant Soup Volume (K) Forecast, by Application 2020 & 2033
- Table 69: South Africa Convenient Instant Soup Revenue (billion) Forecast, by Application 2020 & 2033
- Table 70: South Africa Convenient Instant Soup Volume (K) Forecast, by Application 2020 & 2033
- Table 71: Rest of Middle East & Africa Convenient Instant Soup Revenue (billion) Forecast, by Application 2020 & 2033
- Table 72: Rest of Middle East & Africa Convenient Instant Soup Volume (K) Forecast, by Application 2020 & 2033
- Table 73: Global Convenient Instant Soup Revenue billion Forecast, by Application 2020 & 2033
- Table 74: Global Convenient Instant Soup Volume K Forecast, by Application 2020 & 2033
- Table 75: Global Convenient Instant Soup Revenue billion Forecast, by Type 2020 & 2033
- Table 76: Global Convenient Instant Soup Volume K Forecast, by Type 2020 & 2033
- Table 77: Global Convenient Instant Soup Revenue billion Forecast, by Country 2020 & 2033
- Table 78: Global Convenient Instant Soup Volume K Forecast, by Country 2020 & 2033
- Table 79: China Convenient Instant Soup Revenue (billion) Forecast, by Application 2020 & 2033
- Table 80: China Convenient Instant Soup Volume (K) Forecast, by Application 2020 & 2033
- Table 81: India Convenient Instant Soup Revenue (billion) Forecast, by Application 2020 & 2033
- Table 82: India Convenient Instant Soup Volume (K) Forecast, by Application 2020 & 2033
- Table 83: Japan Convenient Instant Soup Revenue (billion) Forecast, by Application 2020 & 2033
- Table 84: Japan Convenient Instant Soup Volume (K) Forecast, by Application 2020 & 2033
- Table 85: South Korea Convenient Instant Soup Revenue (billion) Forecast, by Application 2020 & 2033
- Table 86: South Korea Convenient Instant Soup Volume (K) Forecast, by Application 2020 & 2033
- Table 87: ASEAN Convenient Instant Soup Revenue (billion) Forecast, by Application 2020 & 2033
- Table 88: ASEAN Convenient Instant Soup Volume (K) Forecast, by Application 2020 & 2033
- Table 89: Oceania Convenient Instant Soup Revenue (billion) Forecast, by Application 2020 & 2033
- Table 90: Oceania Convenient Instant Soup Volume (K) Forecast, by Application 2020 & 2033
- Table 91: Rest of Asia Pacific Convenient Instant Soup Revenue (billion) Forecast, by Application 2020 & 2033
- Table 92: Rest of Asia Pacific Convenient Instant Soup Volume (K) Forecast, by Application 2020 & 2033
Frequently Asked Questions
1. What is the projected Compound Annual Growth Rate (CAGR) of the Convenient Instant Soup?
The projected CAGR is approximately 6.83%.
2. Which companies are prominent players in the Convenient Instant Soup?
Key companies in the market include Nestle Dairy, Caress Foods, Campbell, Unilever, Multitech Foods Manufacturing, Prakash Masala, B&G Foods, Baxters Food Group Limited, Haifusheng, Associated British Foods, Shandong Subo Food, Anderson House Foods, General Mills, Hain Celestial Group, House Foods Group, The Kraft Heinz Company, Kroger, Nissin Foods.
3. What are the main segments of the Convenient Instant Soup?
The market segments include Application, Type.
4. Can you provide details about the market size?
The market size is estimated to be USD 50.58 billion as of 2022.
5. What are some drivers contributing to market growth?
N/A
6. What are the notable trends driving market growth?
N/A
7. Are there any restraints impacting market growth?
N/A
8. Can you provide examples of recent developments in the market?
N/A
9. What pricing options are available for accessing the report?
Pricing options include single-user, multi-user, and enterprise licenses priced at USD 3950.00, USD 5925.00, and USD 7900.00 respectively.
10. Is the market size provided in terms of value or volume?
The market size is provided in terms of value, measured in billion and volume, measured in K.
11. Are there any specific market keywords associated with the report?
Yes, the market keyword associated with the report is "Convenient Instant Soup," which aids in identifying and referencing the specific market segment covered.
12. How do I determine which pricing option suits my needs best?
The pricing options vary based on user requirements and access needs. Individual users may opt for single-user licenses, while businesses requiring broader access may choose multi-user or enterprise licenses for cost-effective access to the report.
13. Are there any additional resources or data provided in the Convenient Instant Soup report?
While the report offers comprehensive insights, it's advisable to review the specific contents or supplementary materials provided to ascertain if additional resources or data are available.
14. How can I stay updated on further developments or reports in the Convenient Instant Soup?
To stay informed about further developments, trends, and reports in the Convenient Instant Soup, consider subscribing to industry newsletters, following relevant companies and organizations, or regularly checking reputable industry news sources and publications.
Methodology
Step 1 - Identification of Relevant Samples Size from Population Database


Step 2 - Approaches for Defining Global Market Size (Value, Volume* & Price*)

Note*: In applicable scenarios
Step 3 - Data Sources
Primary Research
- Web Analytics
- Survey Reports
- Research Institute
- Latest Research Reports
- Opinion Leaders
Secondary Research
- Annual Reports
- White Paper
- Latest Press Release
- Industry Association
- Paid Database
- Investor Presentations

Step 4 - Data Triangulation
Involves using different sources of information in order to increase the validity of a study
These sources are likely to be stakeholders in a program - participants, other researchers, program staff, other community members, and so on.
Then we put all data in single framework & apply various statistical tools to find out the dynamic on the market.
During the analysis stage, feedback from the stakeholder groups would be compared to determine areas of agreement as well as areas of divergence