

Key Insights
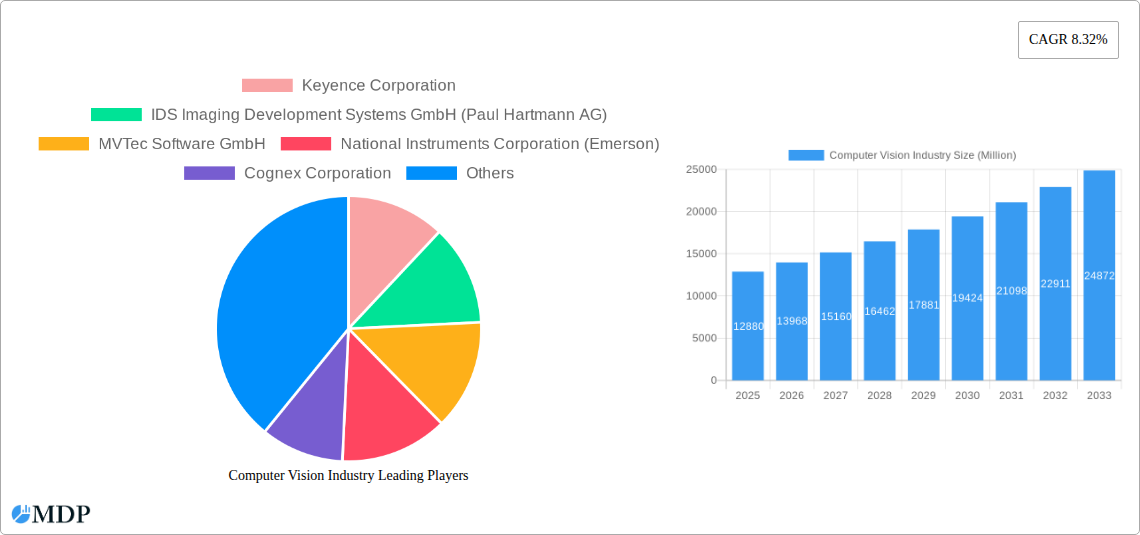
The computer vision market, valued at $12.88 billion in 2025, is projected to experience robust growth, driven by increasing adoption across diverse sectors. The compound annual growth rate (CAGR) of 8.32% from 2025 to 2033 indicates a significant expansion, fueled by several key factors. Advancements in artificial intelligence (AI) and machine learning (ML) algorithms are continuously enhancing the accuracy and speed of image processing and analysis, leading to wider applications. The rising demand for automation in industries like manufacturing, logistics, and healthcare is a major catalyst, as computer vision systems optimize processes, improve efficiency, and reduce human error. Furthermore, the decreasing cost of hardware components, particularly sensors and processing units, makes computer vision technology more accessible to a broader range of businesses. The market is segmented by component (hardware and software), product type (PC-based and smart camera-based), and end-user industry (food and beverage, healthcare, logistics, automotive, electronics, etc.), reflecting the diverse applications of this technology. The competitive landscape includes established players like Keyence, Cognex, and others, who are continuously innovating and expanding their product portfolios to cater to the growing market demand.
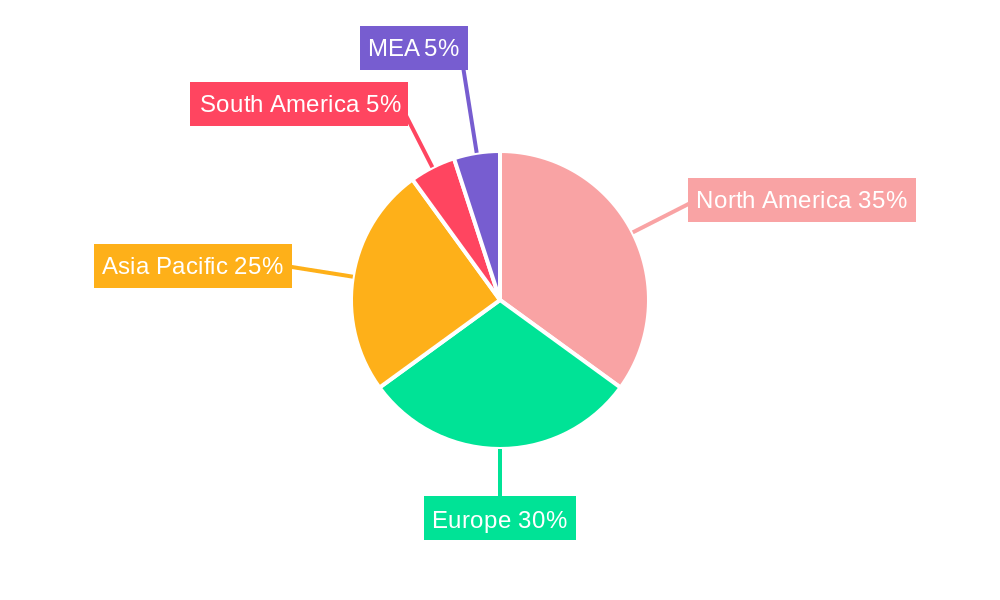
The geographical distribution of the market shows a strong presence in North America and Europe, driven by early adoption and advanced technological infrastructure. However, the Asia-Pacific region is expected to witness significant growth in the coming years, fueled by rapid industrialization and increasing investments in technological advancements. Specific growth drivers within regions will vary depending on factors like government regulations, technological infrastructure, and industry-specific demands. Challenges include data privacy concerns, the need for robust cybersecurity measures, and the requirement for skilled professionals to develop, implement, and maintain these systems. Overcoming these challenges will be crucial for sustained market growth and broader adoption of computer vision technologies across various sectors and geographical locations.
Computer Vision Industry Market Report: 2019-2033
This comprehensive report provides a detailed analysis of the Computer Vision industry, projecting a market value of $XX Million by 2033. It covers market dynamics, leading players, technological advancements, and future growth opportunities, offering invaluable insights for industry stakeholders, investors, and strategic decision-makers. The report analyzes the period from 2019-2024 (Historical Period), with 2025 as the Base and Estimated Year, and forecasts the market from 2025-2033 (Forecast Period).
Computer Vision Industry Market Dynamics & Concentration
The Computer Vision industry is experiencing robust growth, driven by increasing adoption across diverse end-user industries. Market concentration is moderate, with several key players vying for market share. The global market size reached $XX Million in 2024 and is projected to reach $XX Million by 2033. Key factors influencing market dynamics include:
- Market Concentration: The market exhibits moderate concentration, with the top 10 players holding an estimated xx% market share in 2024. This suggests ample opportunities for both established players and emerging entrants.
- Innovation Drivers: Continuous advancements in AI, deep learning, and sensor technology are fueling innovation and expanding applications for computer vision. The development of more efficient and cost-effective hardware and software solutions is driving market growth.
- Regulatory Frameworks: Government regulations regarding data privacy and security are impacting the adoption of computer vision technologies. However, supportive policies promoting technological advancements are fostering growth.
- Product Substitutes: While no direct substitutes exist, alternative technologies like traditional image processing techniques compete to some extent. However, computer vision's superior accuracy and automation capabilities provide a significant advantage.
- End-User Trends: Growing demand for automation and enhanced efficiency across various sectors, including automotive, healthcare, and logistics, is a major driver. The increasing adoption of Industry 4.0 principles is further bolstering market growth.
- M&A Activities: The industry has witnessed xx major M&A deals in the past five years, indicating significant consolidation and strategic expansion among key players. This trend reflects companies' efforts to bolster their product portfolios and expand their market presence.
Computer Vision Industry Industry Trends & Analysis
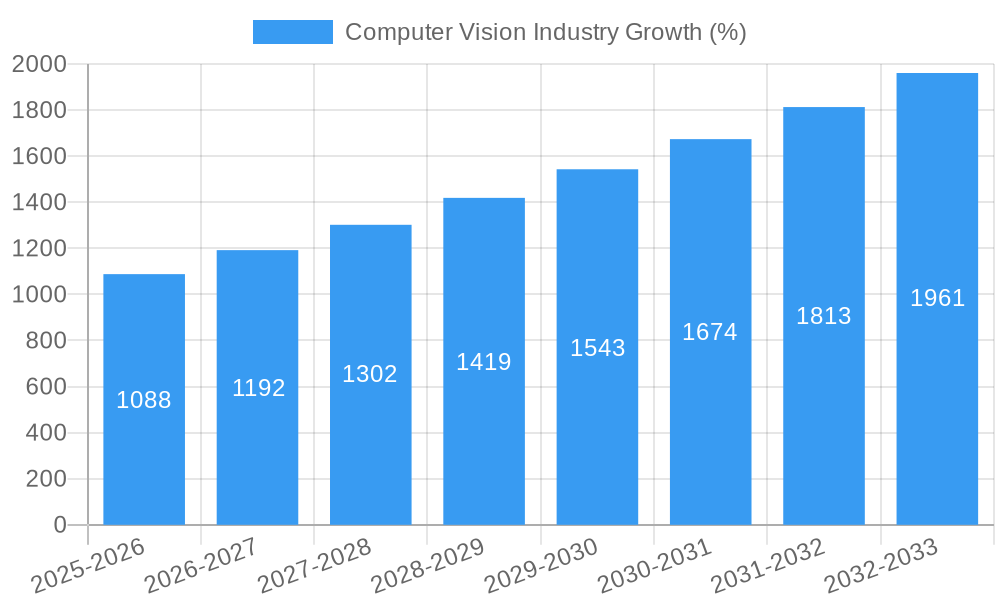
The Computer Vision industry is characterized by a Compound Annual Growth Rate (CAGR) of xx% during the forecast period (2025-2033). This growth is fueled by several key factors:
Technological advancements are continuously enhancing the capabilities of computer vision systems, enabling applications in new and diverse fields. The increasing affordability of hardware and software is making computer vision technology accessible to a wider range of businesses. This includes the rise of cloud-based solutions and the reduction in processing costs. The adoption of computer vision is accelerating across various industries due to the compelling advantages it offers in terms of increased efficiency, improved safety, and enhanced product quality. Consumer preferences for smarter, automated solutions are also boosting market penetration, especially in the context of increasing labor costs and the need for improved operational flexibility. The competitive landscape is dynamic, with established players and emerging startups driving innovation.
Leading Markets & Segments in Computer Vision Industry
The Automotive industry represents a dominant segment, driving significant demand for computer vision technologies in areas such as advanced driver-assistance systems (ADAS) and autonomous vehicles. Other major segments include:
By Component: Hardware holds a larger market share than software, due to the need for robust and reliable sensors and processing units. This trend is expected to sustain throughout the forecast period.
By Product: Smart camera-based systems are gaining traction due to their ease of integration and affordability. PC-based systems continue to hold a significant market share, particularly in applications requiring high computational power.
By End-user Industry:
- Automotive: The increasing demand for autonomous driving and ADAS features is the dominant growth driver.
- Healthcare and Pharmaceutical: Computer vision is used for medical imaging analysis, drug discovery, and robotic surgery.
- Logistics and Retail: Applications include automated warehouse management, inventory control, and customer analytics.
- Electronics and Semiconductors: Used in quality control and automated inspection processes.
- Food and Beverage: Used for quality control, product inspection, and process optimization.
Key drivers for these segments include robust economic policies supporting technological advancements, and investments in infrastructure to facilitate efficient data transmission and processing. The strong growth potential of these sectors in developed and developing economies is also propelling industry expansion.
Computer Vision Industry Product Developments
Recent product innovations focus on miniaturization, enhanced processing speed, and improved accuracy. The development of low-power, energy-efficient solutions, advanced AI algorithms, and seamless integration with existing automation systems are key technological trends shaping the market. These advancements are leading to increased market adoption across various applications, from manufacturing automation to healthcare diagnostics. The ability to provide real-time insights and automation capabilities is a key competitive advantage for products within this space.
Key Drivers of Computer Vision Industry Growth
Several key factors are driving the growth of the computer vision industry:
- Technological Advancements: Improvements in AI, deep learning, and sensor technology are continuously expanding capabilities and applications.
- Increased Automation: The demand for automation across all industries is fueling adoption for various applications from quality control to autonomous driving.
- Favorable Government Policies: Initiatives supporting technological innovation and automation are creating favorable market conditions.
Challenges in the Computer Vision Industry Market
The industry faces challenges such as:
- High Initial Investment Costs: The implementation of computer vision systems often requires substantial upfront investment.
- Data Privacy Concerns: Growing concerns about data security and privacy are influencing adoption and regulations.
- Competition: The market is highly competitive, with established players and new entrants vying for market share.
Emerging Opportunities in Computer Vision Industry
The long-term growth of the computer vision industry is poised to accelerate due to several opportunities:
- Expansion into new applications: The technology has the potential to revolutionize various sectors, from agriculture and environmental monitoring to security and surveillance.
- Strategic partnerships: Collaborations between technology providers and end-users will facilitate rapid technology integration and deployment.
- Advancements in AI and machine learning: Continued progress in AI and machine learning algorithms will provide greater accuracy and efficiency in computer vision applications.
Leading Players in the Computer Vision Industry Sector
- Keyence Corporation
- IDS Imaging Development Systems GmbH (Paul Hartmann AG)
- MVTec Software GmbH
- National Instruments Corporation (Emerson)
- Cognex Corporation
- Teledyne DALSA (Teledyne Technologies Company)
- Isra Vision AG (Atlas Copco Group)
- Omron Corporation
- Toshiba Corporation
- Sony Group Corporation
Key Milestones in Computer Vision Industry Industry
- October 2023: Keyence Corporation launched its new VS series smart camera vision systems, featuring sophisticated lens control technology. This enhances the adaptability and usability of smart cameras, driving market growth.
- November 2023: Basler AG and MVTec Software GmbH partnered with Siemens to integrate machine vision solutions directly into customers’ machines and systems. This collaboration significantly lowers the barrier to entry for machine vision, expanding market accessibility.
Strategic Outlook for Computer Vision Industry Market
The future of the computer vision industry is bright, with immense growth potential fueled by technological advancements, increasing demand for automation, and expanding applications across diverse sectors. Strategic opportunities exist in focusing on developing cost-effective, user-friendly solutions, targeting emerging markets, and fostering strategic partnerships to accelerate market penetration. The industry is poised for continued expansion and consolidation as technological advancements and market demand converge.
Computer Vision Industry Segmentation
-
1. Component
-
1.1. Hardware
- 1.1.1. Vision Systems
- 1.1.2. Cameras
- 1.1.3. Optics and Illumination Systems
- 1.1.4. Frame Grabbers
- 1.1.5. Other Types of Hardware
- 1.2. Software
-
1.1. Hardware
-
2. Product
- 2.1. PC-based
- 2.2. Smart Camera-based
-
3. End-user Industry
- 3.1. Food and Beverage
- 3.2. Healthcare and Pharmaceutical
- 3.3. Logistics and Retail
- 3.4. Automotive
- 3.5. Electronics and Semiconductors
- 3.6. Other End-user Industries
Computer Vision Industry Segmentation By Geography
-
1. North America
- 1.1. United States
- 1.2. Canada
-
2. Europe
- 2.1. Germany
- 2.2. United Kingdom
- 2.3. France
- 2.4. Italy
- 2.5. Spain
-
3. Asia
- 3.1. China
- 3.2. Japan
- 3.3. South Korea
- 3.4. India
- 4. Australia and New Zealand
Computer Vision Industry REPORT HIGHLIGHTS
| Aspects | Details |
|---|---|
| Study Period | 2019-2033 |
| Base Year | 2024 |
| Estimated Year | 2025 |
| Forecast Period | 2025-2033 |
| Historical Period | 2019-2024 |
| Growth Rate | CAGR of 8.32% from 2019-2033 |
| Segmentation |
|
Table of Contents
- 1. Introduction
- 1.1. Research Scope
- 1.2. Market Segmentation
- 1.3. Research Methodology
- 1.4. Definitions and Assumptions
- 2. Executive Summary
- 2.1. Introduction
- 3. Market Dynamics
- 3.1. Introduction
- 3.2. Market Drivers
- 3.2.1. Rising Need for Quality Inspections; Increasing Demand for Vision-guided Robotic Systems
- 3.3. Market Restrains
- 3.3.1. Scarcity of Flexible Machine Vision Solutions
- 3.4. Market Trends
- 3.4.1. Cameras to be the Largest Hardware Segment
- 4. Market Factor Analysis
- 4.1. Porters Five Forces
- 4.2. Supply/Value Chain
- 4.3. PESTEL analysis
- 4.4. Market Entropy
- 4.5. Patent/Trademark Analysis
- 5. Global Computer Vision Industry Analysis, Insights and Forecast, 2019-2031
- 5.1. Market Analysis, Insights and Forecast - by Component
- 5.1.1. Hardware
- 5.1.1.1. Vision Systems
- 5.1.1.2. Cameras
- 5.1.1.3. Optics and Illumination Systems
- 5.1.1.4. Frame Grabbers
- 5.1.1.5. Other Types of Hardware
- 5.1.2. Software
- 5.1.1. Hardware
- 5.2. Market Analysis, Insights and Forecast - by Product
- 5.2.1. PC-based
- 5.2.2. Smart Camera-based
- 5.3. Market Analysis, Insights and Forecast - by End-user Industry
- 5.3.1. Food and Beverage
- 5.3.2. Healthcare and Pharmaceutical
- 5.3.3. Logistics and Retail
- 5.3.4. Automotive
- 5.3.5. Electronics and Semiconductors
- 5.3.6. Other End-user Industries
- 5.4. Market Analysis, Insights and Forecast - by Region
- 5.4.1. North America
- 5.4.2. Europe
- 5.4.3. Asia
- 5.4.4. Australia and New Zealand
- 5.1. Market Analysis, Insights and Forecast - by Component
- 6. North America Computer Vision Industry Analysis, Insights and Forecast, 2019-2031
- 6.1. Market Analysis, Insights and Forecast - by Component
- 6.1.1. Hardware
- 6.1.1.1. Vision Systems
- 6.1.1.2. Cameras
- 6.1.1.3. Optics and Illumination Systems
- 6.1.1.4. Frame Grabbers
- 6.1.1.5. Other Types of Hardware
- 6.1.2. Software
- 6.1.1. Hardware
- 6.2. Market Analysis, Insights and Forecast - by Product
- 6.2.1. PC-based
- 6.2.2. Smart Camera-based
- 6.3. Market Analysis, Insights and Forecast - by End-user Industry
- 6.3.1. Food and Beverage
- 6.3.2. Healthcare and Pharmaceutical
- 6.3.3. Logistics and Retail
- 6.3.4. Automotive
- 6.3.5. Electronics and Semiconductors
- 6.3.6. Other End-user Industries
- 6.1. Market Analysis, Insights and Forecast - by Component
- 7. Europe Computer Vision Industry Analysis, Insights and Forecast, 2019-2031
- 7.1. Market Analysis, Insights and Forecast - by Component
- 7.1.1. Hardware
- 7.1.1.1. Vision Systems
- 7.1.1.2. Cameras
- 7.1.1.3. Optics and Illumination Systems
- 7.1.1.4. Frame Grabbers
- 7.1.1.5. Other Types of Hardware
- 7.1.2. Software
- 7.1.1. Hardware
- 7.2. Market Analysis, Insights and Forecast - by Product
- 7.2.1. PC-based
- 7.2.2. Smart Camera-based
- 7.3. Market Analysis, Insights and Forecast - by End-user Industry
- 7.3.1. Food and Beverage
- 7.3.2. Healthcare and Pharmaceutical
- 7.3.3. Logistics and Retail
- 7.3.4. Automotive
- 7.3.5. Electronics and Semiconductors
- 7.3.6. Other End-user Industries
- 7.1. Market Analysis, Insights and Forecast - by Component
- 8. Asia Computer Vision Industry Analysis, Insights and Forecast, 2019-2031
- 8.1. Market Analysis, Insights and Forecast - by Component
- 8.1.1. Hardware
- 8.1.1.1. Vision Systems
- 8.1.1.2. Cameras
- 8.1.1.3. Optics and Illumination Systems
- 8.1.1.4. Frame Grabbers
- 8.1.1.5. Other Types of Hardware
- 8.1.2. Software
- 8.1.1. Hardware
- 8.2. Market Analysis, Insights and Forecast - by Product
- 8.2.1. PC-based
- 8.2.2. Smart Camera-based
- 8.3. Market Analysis, Insights and Forecast - by End-user Industry
- 8.3.1. Food and Beverage
- 8.3.2. Healthcare and Pharmaceutical
- 8.3.3. Logistics and Retail
- 8.3.4. Automotive
- 8.3.5. Electronics and Semiconductors
- 8.3.6. Other End-user Industries
- 8.1. Market Analysis, Insights and Forecast - by Component
- 9. Australia and New Zealand Computer Vision Industry Analysis, Insights and Forecast, 2019-2031
- 9.1. Market Analysis, Insights and Forecast - by Component
- 9.1.1. Hardware
- 9.1.1.1. Vision Systems
- 9.1.1.2. Cameras
- 9.1.1.3. Optics and Illumination Systems
- 9.1.1.4. Frame Grabbers
- 9.1.1.5. Other Types of Hardware
- 9.1.2. Software
- 9.1.1. Hardware
- 9.2. Market Analysis, Insights and Forecast - by Product
- 9.2.1. PC-based
- 9.2.2. Smart Camera-based
- 9.3. Market Analysis, Insights and Forecast - by End-user Industry
- 9.3.1. Food and Beverage
- 9.3.2. Healthcare and Pharmaceutical
- 9.3.3. Logistics and Retail
- 9.3.4. Automotive
- 9.3.5. Electronics and Semiconductors
- 9.3.6. Other End-user Industries
- 9.1. Market Analysis, Insights and Forecast - by Component
- 10. North America Computer Vision Industry Analysis, Insights and Forecast, 2019-2031
- 10.1. Market Analysis, Insights and Forecast - By Country/Sub-region
- 10.1.1 United States
- 10.1.2 Canada
- 10.1.3 Mexico
- 11. Europe Computer Vision Industry Analysis, Insights and Forecast, 2019-2031
- 11.1. Market Analysis, Insights and Forecast - By Country/Sub-region
- 11.1.1 Germany
- 11.1.2 United Kingdom
- 11.1.3 France
- 11.1.4 Spain
- 11.1.5 Italy
- 11.1.6 Spain
- 11.1.7 Belgium
- 11.1.8 Netherland
- 11.1.9 Nordics
- 11.1.10 Rest of Europe
- 12. Asia Pacific Computer Vision Industry Analysis, Insights and Forecast, 2019-2031
- 12.1. Market Analysis, Insights and Forecast - By Country/Sub-region
- 12.1.1 China
- 12.1.2 Japan
- 12.1.3 India
- 12.1.4 South Korea
- 12.1.5 Southeast Asia
- 12.1.6 Australia
- 12.1.7 Indonesia
- 12.1.8 Phillipes
- 12.1.9 Singapore
- 12.1.10 Thailandc
- 12.1.11 Rest of Asia Pacific
- 13. South America Computer Vision Industry Analysis, Insights and Forecast, 2019-2031
- 13.1. Market Analysis, Insights and Forecast - By Country/Sub-region
- 13.1.1 Brazil
- 13.1.2 Argentina
- 13.1.3 Peru
- 13.1.4 Chile
- 13.1.5 Colombia
- 13.1.6 Ecuador
- 13.1.7 Venezuela
- 13.1.8 Rest of South America
- 14. North America Computer Vision Industry Analysis, Insights and Forecast, 2019-2031
- 14.1. Market Analysis, Insights and Forecast - By Country/Sub-region
- 14.1.1 United States
- 14.1.2 Canada
- 14.1.3 Mexico
- 15. MEA Computer Vision Industry Analysis, Insights and Forecast, 2019-2031
- 15.1. Market Analysis, Insights and Forecast - By Country/Sub-region
- 15.1.1 United Arab Emirates
- 15.1.2 Saudi Arabia
- 15.1.3 South Africa
- 15.1.4 Rest of Middle East and Africa
- 16. Competitive Analysis
- 16.1. Global Market Share Analysis 2024
- 16.2. Company Profiles
- 16.2.1 Keyence Corporation
- 16.2.1.1. Overview
- 16.2.1.2. Products
- 16.2.1.3. SWOT Analysis
- 16.2.1.4. Recent Developments
- 16.2.1.5. Financials (Based on Availability)
- 16.2.2 IDS Imaging Development Systems GmbH (Paul Hartmann AG)
- 16.2.2.1. Overview
- 16.2.2.2. Products
- 16.2.2.3. SWOT Analysis
- 16.2.2.4. Recent Developments
- 16.2.2.5. Financials (Based on Availability)
- 16.2.3 MVTec Software GmbH
- 16.2.3.1. Overview
- 16.2.3.2. Products
- 16.2.3.3. SWOT Analysis
- 16.2.3.4. Recent Developments
- 16.2.3.5. Financials (Based on Availability)
- 16.2.4 National Instruments Corporation (Emerson)
- 16.2.4.1. Overview
- 16.2.4.2. Products
- 16.2.4.3. SWOT Analysis
- 16.2.4.4. Recent Developments
- 16.2.4.5. Financials (Based on Availability)
- 16.2.5 Cognex Corporation
- 16.2.5.1. Overview
- 16.2.5.2. Products
- 16.2.5.3. SWOT Analysis
- 16.2.5.4. Recent Developments
- 16.2.5.5. Financials (Based on Availability)
- 16.2.6 Teledyne DALSA (Teledyne Technologies Company)
- 16.2.6.1. Overview
- 16.2.6.2. Products
- 16.2.6.3. SWOT Analysis
- 16.2.6.4. Recent Developments
- 16.2.6.5. Financials (Based on Availability)
- 16.2.7 Isra Vision AG (Atlas Copco Group)
- 16.2.7.1. Overview
- 16.2.7.2. Products
- 16.2.7.3. SWOT Analysis
- 16.2.7.4. Recent Developments
- 16.2.7.5. Financials (Based on Availability)
- 16.2.8 Omron Corporation
- 16.2.8.1. Overview
- 16.2.8.2. Products
- 16.2.8.3. SWOT Analysis
- 16.2.8.4. Recent Developments
- 16.2.8.5. Financials (Based on Availability)
- 16.2.9 Toshiba Corporation
- 16.2.9.1. Overview
- 16.2.9.2. Products
- 16.2.9.3. SWOT Analysis
- 16.2.9.4. Recent Developments
- 16.2.9.5. Financials (Based on Availability)
- 16.2.10 Sony Group Corporation
- 16.2.10.1. Overview
- 16.2.10.2. Products
- 16.2.10.3. SWOT Analysis
- 16.2.10.4. Recent Developments
- 16.2.10.5. Financials (Based on Availability)
- 16.2.1 Keyence Corporation
List of Figures
- Figure 1: Global Computer Vision Industry Revenue Breakdown (Million, %) by Region 2024 & 2032
- Figure 2: North America Computer Vision Industry Revenue (Million), by Country 2024 & 2032
- Figure 3: North America Computer Vision Industry Revenue Share (%), by Country 2024 & 2032
- Figure 4: Europe Computer Vision Industry Revenue (Million), by Country 2024 & 2032
- Figure 5: Europe Computer Vision Industry Revenue Share (%), by Country 2024 & 2032
- Figure 6: Asia Pacific Computer Vision Industry Revenue (Million), by Country 2024 & 2032
- Figure 7: Asia Pacific Computer Vision Industry Revenue Share (%), by Country 2024 & 2032
- Figure 8: South America Computer Vision Industry Revenue (Million), by Country 2024 & 2032
- Figure 9: South America Computer Vision Industry Revenue Share (%), by Country 2024 & 2032
- Figure 10: North America Computer Vision Industry Revenue (Million), by Country 2024 & 2032
- Figure 11: North America Computer Vision Industry Revenue Share (%), by Country 2024 & 2032
- Figure 12: MEA Computer Vision Industry Revenue (Million), by Country 2024 & 2032
- Figure 13: MEA Computer Vision Industry Revenue Share (%), by Country 2024 & 2032
- Figure 14: North America Computer Vision Industry Revenue (Million), by Component 2024 & 2032
- Figure 15: North America Computer Vision Industry Revenue Share (%), by Component 2024 & 2032
- Figure 16: North America Computer Vision Industry Revenue (Million), by Product 2024 & 2032
- Figure 17: North America Computer Vision Industry Revenue Share (%), by Product 2024 & 2032
- Figure 18: North America Computer Vision Industry Revenue (Million), by End-user Industry 2024 & 2032
- Figure 19: North America Computer Vision Industry Revenue Share (%), by End-user Industry 2024 & 2032
- Figure 20: North America Computer Vision Industry Revenue (Million), by Country 2024 & 2032
- Figure 21: North America Computer Vision Industry Revenue Share (%), by Country 2024 & 2032
- Figure 22: Europe Computer Vision Industry Revenue (Million), by Component 2024 & 2032
- Figure 23: Europe Computer Vision Industry Revenue Share (%), by Component 2024 & 2032
- Figure 24: Europe Computer Vision Industry Revenue (Million), by Product 2024 & 2032
- Figure 25: Europe Computer Vision Industry Revenue Share (%), by Product 2024 & 2032
- Figure 26: Europe Computer Vision Industry Revenue (Million), by End-user Industry 2024 & 2032
- Figure 27: Europe Computer Vision Industry Revenue Share (%), by End-user Industry 2024 & 2032
- Figure 28: Europe Computer Vision Industry Revenue (Million), by Country 2024 & 2032
- Figure 29: Europe Computer Vision Industry Revenue Share (%), by Country 2024 & 2032
- Figure 30: Asia Computer Vision Industry Revenue (Million), by Component 2024 & 2032
- Figure 31: Asia Computer Vision Industry Revenue Share (%), by Component 2024 & 2032
- Figure 32: Asia Computer Vision Industry Revenue (Million), by Product 2024 & 2032
- Figure 33: Asia Computer Vision Industry Revenue Share (%), by Product 2024 & 2032
- Figure 34: Asia Computer Vision Industry Revenue (Million), by End-user Industry 2024 & 2032
- Figure 35: Asia Computer Vision Industry Revenue Share (%), by End-user Industry 2024 & 2032
- Figure 36: Asia Computer Vision Industry Revenue (Million), by Country 2024 & 2032
- Figure 37: Asia Computer Vision Industry Revenue Share (%), by Country 2024 & 2032
- Figure 38: Australia and New Zealand Computer Vision Industry Revenue (Million), by Component 2024 & 2032
- Figure 39: Australia and New Zealand Computer Vision Industry Revenue Share (%), by Component 2024 & 2032
- Figure 40: Australia and New Zealand Computer Vision Industry Revenue (Million), by Product 2024 & 2032
- Figure 41: Australia and New Zealand Computer Vision Industry Revenue Share (%), by Product 2024 & 2032
- Figure 42: Australia and New Zealand Computer Vision Industry Revenue (Million), by End-user Industry 2024 & 2032
- Figure 43: Australia and New Zealand Computer Vision Industry Revenue Share (%), by End-user Industry 2024 & 2032
- Figure 44: Australia and New Zealand Computer Vision Industry Revenue (Million), by Country 2024 & 2032
- Figure 45: Australia and New Zealand Computer Vision Industry Revenue Share (%), by Country 2024 & 2032
List of Tables
- Table 1: Global Computer Vision Industry Revenue Million Forecast, by Region 2019 & 2032
- Table 2: Global Computer Vision Industry Revenue Million Forecast, by Component 2019 & 2032
- Table 3: Global Computer Vision Industry Revenue Million Forecast, by Product 2019 & 2032
- Table 4: Global Computer Vision Industry Revenue Million Forecast, by End-user Industry 2019 & 2032
- Table 5: Global Computer Vision Industry Revenue Million Forecast, by Region 2019 & 2032
- Table 6: Global Computer Vision Industry Revenue Million Forecast, by Country 2019 & 2032
- Table 7: United States Computer Vision Industry Revenue (Million) Forecast, by Application 2019 & 2032
- Table 8: Canada Computer Vision Industry Revenue (Million) Forecast, by Application 2019 & 2032
- Table 9: Mexico Computer Vision Industry Revenue (Million) Forecast, by Application 2019 & 2032
- Table 10: Global Computer Vision Industry Revenue Million Forecast, by Country 2019 & 2032
- Table 11: Germany Computer Vision Industry Revenue (Million) Forecast, by Application 2019 & 2032
- Table 12: United Kingdom Computer Vision Industry Revenue (Million) Forecast, by Application 2019 & 2032
- Table 13: France Computer Vision Industry Revenue (Million) Forecast, by Application 2019 & 2032
- Table 14: Spain Computer Vision Industry Revenue (Million) Forecast, by Application 2019 & 2032
- Table 15: Italy Computer Vision Industry Revenue (Million) Forecast, by Application 2019 & 2032
- Table 16: Spain Computer Vision Industry Revenue (Million) Forecast, by Application 2019 & 2032
- Table 17: Belgium Computer Vision Industry Revenue (Million) Forecast, by Application 2019 & 2032
- Table 18: Netherland Computer Vision Industry Revenue (Million) Forecast, by Application 2019 & 2032
- Table 19: Nordics Computer Vision Industry Revenue (Million) Forecast, by Application 2019 & 2032
- Table 20: Rest of Europe Computer Vision Industry Revenue (Million) Forecast, by Application 2019 & 2032
- Table 21: Global Computer Vision Industry Revenue Million Forecast, by Country 2019 & 2032
- Table 22: China Computer Vision Industry Revenue (Million) Forecast, by Application 2019 & 2032
- Table 23: Japan Computer Vision Industry Revenue (Million) Forecast, by Application 2019 & 2032
- Table 24: India Computer Vision Industry Revenue (Million) Forecast, by Application 2019 & 2032
- Table 25: South Korea Computer Vision Industry Revenue (Million) Forecast, by Application 2019 & 2032
- Table 26: Southeast Asia Computer Vision Industry Revenue (Million) Forecast, by Application 2019 & 2032
- Table 27: Australia Computer Vision Industry Revenue (Million) Forecast, by Application 2019 & 2032
- Table 28: Indonesia Computer Vision Industry Revenue (Million) Forecast, by Application 2019 & 2032
- Table 29: Phillipes Computer Vision Industry Revenue (Million) Forecast, by Application 2019 & 2032
- Table 30: Singapore Computer Vision Industry Revenue (Million) Forecast, by Application 2019 & 2032
- Table 31: Thailandc Computer Vision Industry Revenue (Million) Forecast, by Application 2019 & 2032
- Table 32: Rest of Asia Pacific Computer Vision Industry Revenue (Million) Forecast, by Application 2019 & 2032
- Table 33: Global Computer Vision Industry Revenue Million Forecast, by Country 2019 & 2032
- Table 34: Brazil Computer Vision Industry Revenue (Million) Forecast, by Application 2019 & 2032
- Table 35: Argentina Computer Vision Industry Revenue (Million) Forecast, by Application 2019 & 2032
- Table 36: Peru Computer Vision Industry Revenue (Million) Forecast, by Application 2019 & 2032
- Table 37: Chile Computer Vision Industry Revenue (Million) Forecast, by Application 2019 & 2032
- Table 38: Colombia Computer Vision Industry Revenue (Million) Forecast, by Application 2019 & 2032
- Table 39: Ecuador Computer Vision Industry Revenue (Million) Forecast, by Application 2019 & 2032
- Table 40: Venezuela Computer Vision Industry Revenue (Million) Forecast, by Application 2019 & 2032
- Table 41: Rest of South America Computer Vision Industry Revenue (Million) Forecast, by Application 2019 & 2032
- Table 42: Global Computer Vision Industry Revenue Million Forecast, by Country 2019 & 2032
- Table 43: United States Computer Vision Industry Revenue (Million) Forecast, by Application 2019 & 2032
- Table 44: Canada Computer Vision Industry Revenue (Million) Forecast, by Application 2019 & 2032
- Table 45: Mexico Computer Vision Industry Revenue (Million) Forecast, by Application 2019 & 2032
- Table 46: Global Computer Vision Industry Revenue Million Forecast, by Country 2019 & 2032
- Table 47: United Arab Emirates Computer Vision Industry Revenue (Million) Forecast, by Application 2019 & 2032
- Table 48: Saudi Arabia Computer Vision Industry Revenue (Million) Forecast, by Application 2019 & 2032
- Table 49: South Africa Computer Vision Industry Revenue (Million) Forecast, by Application 2019 & 2032
- Table 50: Rest of Middle East and Africa Computer Vision Industry Revenue (Million) Forecast, by Application 2019 & 2032
- Table 51: Global Computer Vision Industry Revenue Million Forecast, by Component 2019 & 2032
- Table 52: Global Computer Vision Industry Revenue Million Forecast, by Product 2019 & 2032
- Table 53: Global Computer Vision Industry Revenue Million Forecast, by End-user Industry 2019 & 2032
- Table 54: Global Computer Vision Industry Revenue Million Forecast, by Country 2019 & 2032
- Table 55: United States Computer Vision Industry Revenue (Million) Forecast, by Application 2019 & 2032
- Table 56: Canada Computer Vision Industry Revenue (Million) Forecast, by Application 2019 & 2032
- Table 57: Global Computer Vision Industry Revenue Million Forecast, by Component 2019 & 2032
- Table 58: Global Computer Vision Industry Revenue Million Forecast, by Product 2019 & 2032
- Table 59: Global Computer Vision Industry Revenue Million Forecast, by End-user Industry 2019 & 2032
- Table 60: Global Computer Vision Industry Revenue Million Forecast, by Country 2019 & 2032
- Table 61: Germany Computer Vision Industry Revenue (Million) Forecast, by Application 2019 & 2032
- Table 62: United Kingdom Computer Vision Industry Revenue (Million) Forecast, by Application 2019 & 2032
- Table 63: France Computer Vision Industry Revenue (Million) Forecast, by Application 2019 & 2032
- Table 64: Italy Computer Vision Industry Revenue (Million) Forecast, by Application 2019 & 2032
- Table 65: Spain Computer Vision Industry Revenue (Million) Forecast, by Application 2019 & 2032
- Table 66: Global Computer Vision Industry Revenue Million Forecast, by Component 2019 & 2032
- Table 67: Global Computer Vision Industry Revenue Million Forecast, by Product 2019 & 2032
- Table 68: Global Computer Vision Industry Revenue Million Forecast, by End-user Industry 2019 & 2032
- Table 69: Global Computer Vision Industry Revenue Million Forecast, by Country 2019 & 2032
- Table 70: China Computer Vision Industry Revenue (Million) Forecast, by Application 2019 & 2032
- Table 71: Japan Computer Vision Industry Revenue (Million) Forecast, by Application 2019 & 2032
- Table 72: South Korea Computer Vision Industry Revenue (Million) Forecast, by Application 2019 & 2032
- Table 73: India Computer Vision Industry Revenue (Million) Forecast, by Application 2019 & 2032
- Table 74: Global Computer Vision Industry Revenue Million Forecast, by Component 2019 & 2032
- Table 75: Global Computer Vision Industry Revenue Million Forecast, by Product 2019 & 2032
- Table 76: Global Computer Vision Industry Revenue Million Forecast, by End-user Industry 2019 & 2032
- Table 77: Global Computer Vision Industry Revenue Million Forecast, by Country 2019 & 2032
Frequently Asked Questions
1. What is the projected Compound Annual Growth Rate (CAGR) of the Computer Vision Industry?
The projected CAGR is approximately 8.32%.
2. Which companies are prominent players in the Computer Vision Industry?
Key companies in the market include Keyence Corporation, IDS Imaging Development Systems GmbH (Paul Hartmann AG), MVTec Software GmbH, National Instruments Corporation (Emerson), Cognex Corporation, Teledyne DALSA (Teledyne Technologies Company), Isra Vision AG (Atlas Copco Group), Omron Corporation, Toshiba Corporation, Sony Group Corporation.
3. What are the main segments of the Computer Vision Industry?
The market segments include Component, Product, End-user Industry.
4. Can you provide details about the market size?
The market size is estimated to be USD 12.88 Million as of 2022.
5. What are some drivers contributing to market growth?
Rising Need for Quality Inspections; Increasing Demand for Vision-guided Robotic Systems.
6. What are the notable trends driving market growth?
Cameras to be the Largest Hardware Segment.
7. Are there any restraints impacting market growth?
Scarcity of Flexible Machine Vision Solutions.
8. Can you provide examples of recent developments in the market?
November 2023: Basler AG and MVTec Software GmbH partnered with Siemens to bring machine vision solutions directly to customers’ machines and systems. The new partnerships between Basler AG and Siemens enable customers to integrate machine vision apps directly into their automation technology. Siemens’ experience with industrial automation and digitization, combined with MVTec’s expertise in machine vision, reduces the complexity for customers. It significantly reduces the barrier to entry for machine vision solutions.
9. What pricing options are available for accessing the report?
Pricing options include single-user, multi-user, and enterprise licenses priced at USD 4750, USD 5250, and USD 8750 respectively.
10. Is the market size provided in terms of value or volume?
The market size is provided in terms of value, measured in Million.
11. Are there any specific market keywords associated with the report?
Yes, the market keyword associated with the report is "Computer Vision Industry," which aids in identifying and referencing the specific market segment covered.
12. How do I determine which pricing option suits my needs best?
The pricing options vary based on user requirements and access needs. Individual users may opt for single-user licenses, while businesses requiring broader access may choose multi-user or enterprise licenses for cost-effective access to the report.
13. Are there any additional resources or data provided in the Computer Vision Industry report?
While the report offers comprehensive insights, it's advisable to review the specific contents or supplementary materials provided to ascertain if additional resources or data are available.
14. How can I stay updated on further developments or reports in the Computer Vision Industry?
To stay informed about further developments, trends, and reports in the Computer Vision Industry, consider subscribing to industry newsletters, following relevant companies and organizations, or regularly checking reputable industry news sources and publications.
Methodology
Step 1 - Identification of Relevant Samples Size from Population Database


Step 2 - Approaches for Defining Global Market Size (Value, Volume* & Price*)

Note*: In applicable scenarios
Step 3 - Data Sources
Primary Research
- Web Analytics
- Survey Reports
- Research Institute
- Latest Research Reports
- Opinion Leaders
Secondary Research
- Annual Reports
- White Paper
- Latest Press Release
- Industry Association
- Paid Database
- Investor Presentations

Step 4 - Data Triangulation
Involves using different sources of information in order to increase the validity of a study
These sources are likely to be stakeholders in a program - participants, other researchers, program staff, other community members, and so on.
Then we put all data in single framework & apply various statistical tools to find out the dynamic on the market.
During the analysis stage, feedback from the stakeholder groups would be compared to determine areas of agreement as well as areas of divergence
