


Key Insights
The global caviar market is poised for substantial growth, projected to reach an estimated $412.65 million in 2025. This expansion is driven by a confluence of factors, including the increasing demand from upscale dining establishments and a growing appreciation for gourmet food products in households. The market's compound annual growth rate (CAGR) of 8.3% for the forecast period of 2025-2033 indicates a robust upward trajectory. Key applications such as restaurants, where caviar is a staple of fine dining experiences, and the burgeoning household consumption, especially in emerging economies, are primary growth engines. Within the market segmentation, Malossol caviar, known for its delicate curing process and superior taste, is expected to maintain its dominance. Pressed and salted caviar varieties also contribute significantly to market volume, catering to diverse consumer preferences and culinary applications. The pasteurized caviar segment is gaining traction due to its extended shelf life and accessibility.
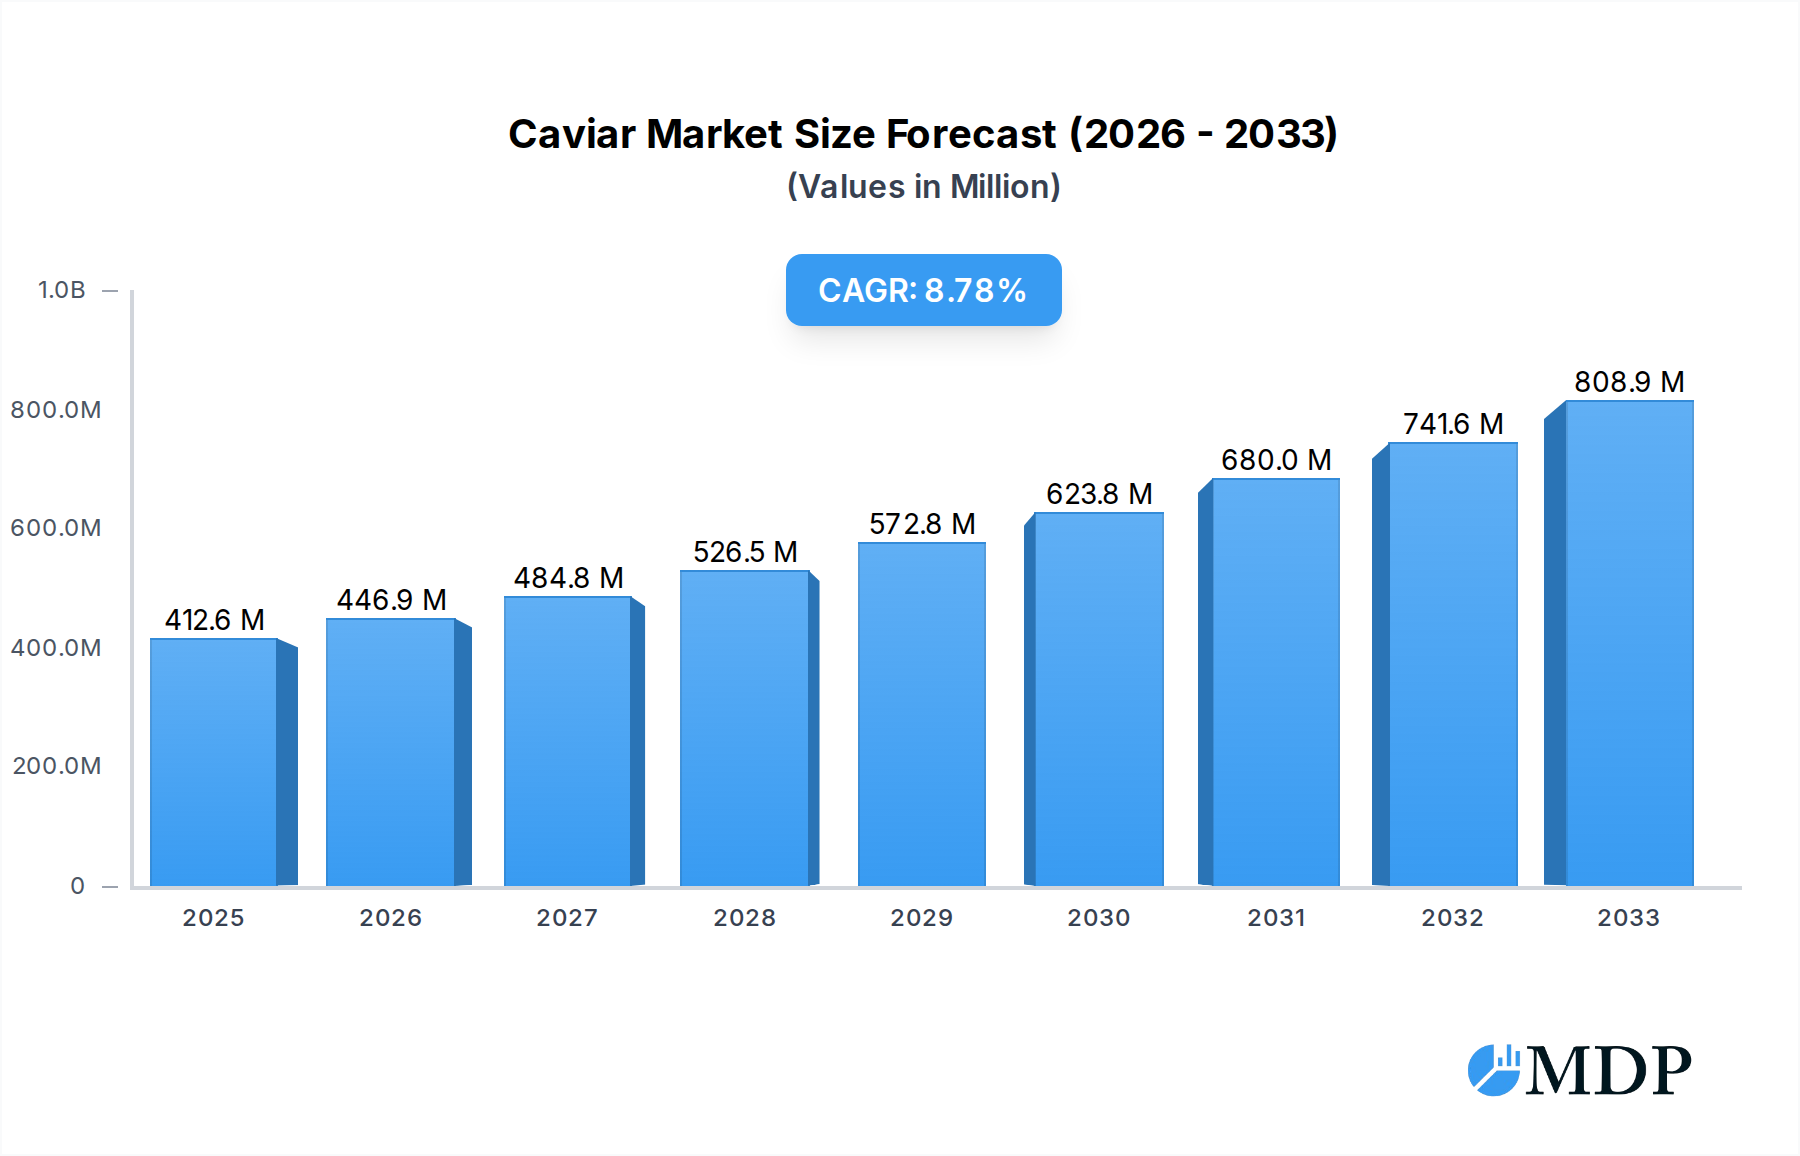
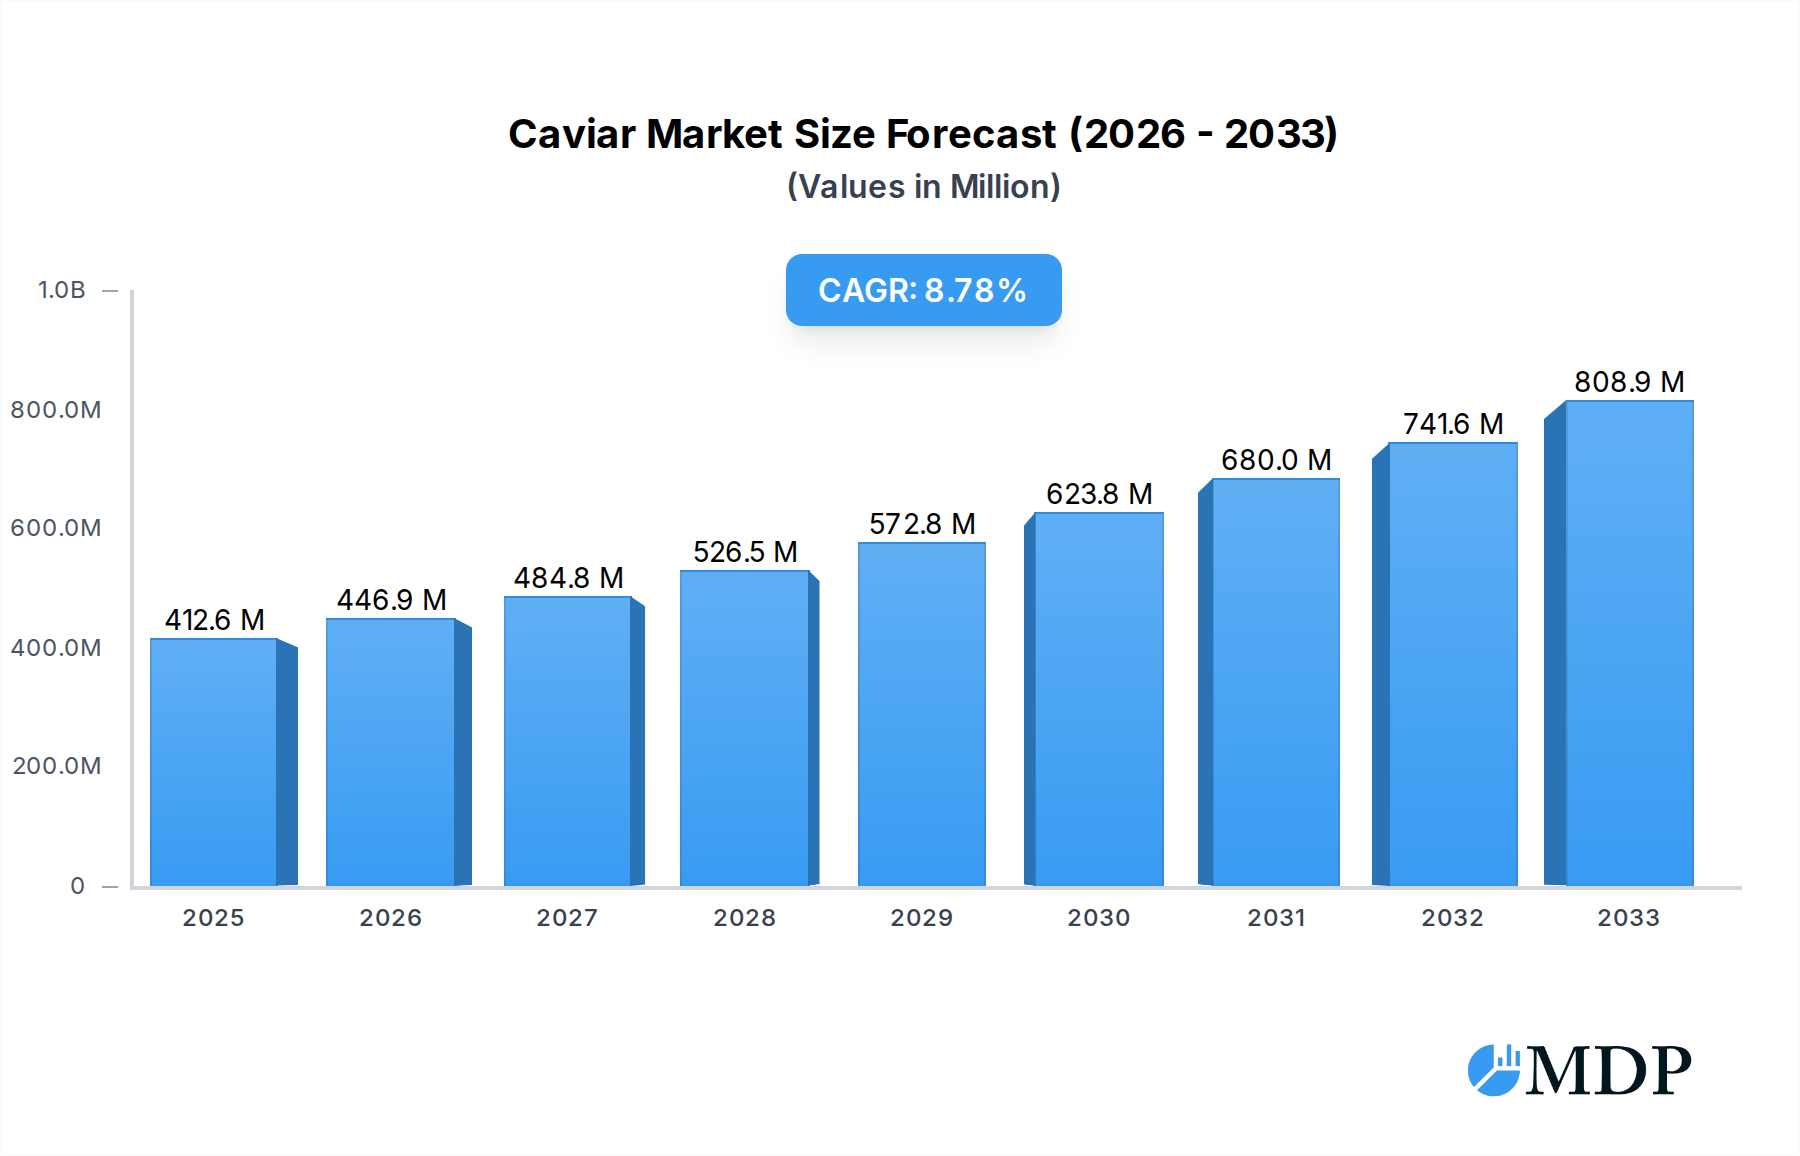
Caviar Market Size (In Million)

Several key trends are shaping the caviar industry. The rise of sustainable aquaculture practices is addressing concerns about overfishing and ensuring a consistent supply of high-quality caviar. Consumers are increasingly seeking traceability and ethical sourcing, pushing producers to adopt transparent and eco-friendly methods. Innovations in processing and packaging are also enhancing product appeal and extending market reach. However, the market faces certain restraints, including the high cost of production, which can limit accessibility for a wider consumer base. Fluctuations in raw material availability and stringent regulations surrounding the import and export of caviar can also pose challenges. Despite these hurdles, the overarching trend points towards a dynamic and expanding global caviar market, fueled by premiumization in food consumption and a growing global palate for luxury culinary experiences.
Caviar Company Market Share
The Global Caviar Market: A Comprehensive Report (2019-2033)
This in-depth report offers a detailed analysis of the global caviar market, providing strategic insights and actionable intelligence for industry stakeholders. Spanning a study period from 2019 to 2033, with a base year of 2025, this report delves into market dynamics, emerging trends, leading players, and future growth opportunities. With a robust forecast period from 2025 to 2033, this research is essential for anyone looking to navigate the complexities and capitalize on the lucrative opportunities within the premium aquaculture sector.
Caviar Market Dynamics & Concentration
The global caviar market, valued at an estimated 3,500 million in the base year of 2025, exhibits a moderate level of concentration. Key innovation drivers include advancements in sustainable aquaculture techniques, particularly in sturgeon farming, and the development of novel processing methods for enhanced shelf-life and flavor profiles. Regulatory frameworks play a crucial role, with CITES (Convention on International Trade in Endangered Species of Wild Fauna and Flora) regulations significantly impacting the trade of wild-caught caviar and promoting the growth of farmed alternatives. Product substitutes, such as other high-end roes like salmon roe and trout roe, pose a competitive threat, though they do not entirely replicate the distinct luxury appeal of caviar. End-user trends are increasingly leaning towards ethically sourced and sustainably farmed caviar, with a growing appreciation for traceability and origin. Mergers and acquisitions (M&A) activities, while not as frequent as in more consolidated industries, are observed as larger players seek to expand their production capacity and market reach. The number of significant M&A deals recorded within the historical period (2019-2024) is approximately 5, with an estimated total deal value of 300 million. The market share of the top five players is approximately 45%, indicating room for further consolidation and competition.
Caviar Industry Trends & Analysis
The caviar industry is experiencing robust growth, driven by a confluence of factors that are reshaping consumer preferences and market dynamics. The Compound Annual Growth Rate (CAGR) for the global caviar market is projected to be a healthy 7.5% during the forecast period of 2025–2033. This growth is significantly fueled by increasing disposable incomes in emerging economies and a burgeoning global appetite for luxury food products. Technological disruptions are at the forefront, with innovations in recirculating aquaculture systems (RAS) and advanced breeding techniques enabling more efficient and sustainable sturgeon farming, thereby increasing supply and reducing reliance on wild stocks. Consumer preferences are evolving, with a pronounced shift towards ethically sourced, sustainable, and traceable caviar. This trend is pushing companies to invest in transparent supply chains and eco-friendly production methods. The premiumization of dining experiences, both in restaurants and at home, further boosts demand for high-quality caviar. Market penetration for farmed caviar has risen dramatically, now estimated to be over 80% of the total market. The competitive landscape is characterized by a mix of established luxury brands and emerging aquaculture pioneers, all vying for market share through product quality, branding, and innovative marketing strategies. The increasing demand from the fine dining sector, coupled with a growing segment of affluent home consumers seeking gourmet experiences, are key market growth drivers. The industry is witnessing a diversification of caviar types and flavor profiles, moving beyond traditional offerings to cater to a wider range of palates. The total market size is expected to reach 7,200 million by 2033.
Leading Markets & Segments in Caviar
The global caviar market is significantly influenced by regional economic conditions, consumer purchasing power, and the prevalence of fine-dining culture. Europe, particularly countries like France, Germany, and the United Kingdom, continues to be a dominant region for caviar consumption, driven by a long-standing appreciation for gourmet foods and a well-established fine-dining infrastructure. The United States also represents a substantial market due to its large affluent population and high demand in both restaurant and household segments.
In terms of application, the Restaurants segment holds a commanding market share, estimated at 65% of the total market value in 2025. This dominance is attributed to the ubiquitous presence of caviar on the menus of high-end dining establishments, Michelin-starred restaurants, and luxury hotels. Key drivers for this segment include:
- Economic Policies: Favorable economic conditions and disposable income levels directly impact the spending capacity of restaurants on premium ingredients.
- Infrastructure: A robust hospitality infrastructure, including a network of gourmet restaurants and catering services, supports consistent demand.
- Culinary Trends: The ongoing trend of experiential dining and the demand for unique, high-quality ingredients in culinary creations bolster caviar's position.
The Household segment, while smaller at approximately 35% of the market in 2025, is experiencing a faster growth rate. This surge is fueled by the increasing popularity of home entertaining, the availability of premium e-commerce platforms for direct-to-consumer sales, and a growing segment of affluent consumers who seek to replicate restaurant-quality experiences at home.
Analyzing the Type of caviar, Malossol Caviar remains the most dominant segment, accounting for an estimated 70% of the market. This signifies a preference for lightly salted caviar, which preserves the delicate flavor and texture of the roe. Key drivers for Malossol's dominance include:
- Consumer Preference: The traditional and most sought-after preparation method emphasizes the natural taste of the sturgeon roe.
- Culinary Versatility: Malossol caviar is highly versatile, suitable for a wide array of culinary applications from simple garnishes to elaborate dishes.
- Perceived Quality: It is widely associated with higher quality and authenticity in the connoisseur community.
Other segments, while smaller, are showing promising growth:
- Salted Caviar: This segment, accounting for approximately 15% of the market, caters to consumers who prefer a more pronounced saline flavor.
- Pressed Caviar: Making up about 10% of the market, this type is produced from overripe roe and is characterized by a stronger flavor and a paste-like consistency, often used in specific culinary preparations.
- Pasteurized Caviar: This segment, representing 5% of the market, offers extended shelf-life and is appealing for wider distribution and less demanding storage conditions, though it often comes with a slightly altered flavor profile.
Caviar Product Developments
Caviar product development is witnessing significant innovation focused on enhancing sustainability, expanding flavor profiles, and improving accessibility. Companies are investing in advanced aquaculture techniques to produce caviar with unique taste characteristics, mimicking regional flavors or developing novel flavor infusions. For instance, the development of specific sturgeon diets and controlled breeding environments are leading to distinct flavor notes. Furthermore, advancements in processing and packaging are extending shelf life and ensuring the integrity of the product from farm to table, offering competitive advantages in niche markets and direct-to-consumer channels. The focus remains on maintaining the premium quality and luxurious appeal while addressing consumer demands for ethical sourcing and traceability.
Key Drivers of Caviar Growth
Several key drivers are propelling the growth of the global caviar market. Technologically, advancements in sustainable aquaculture, particularly recirculating aquaculture systems (RAS) and selective breeding of sturgeons, are crucial for increasing supply and improving efficiency. Economically, rising disposable incomes in emerging markets and a global trend towards premiumization in food consumption are creating a larger customer base for luxury products like caviar. Regulatory frameworks, such as the strict regulations on wild caviar trade, are inadvertently boosting the demand for farmed caviar, which is now the primary source. The increasing popularity of gourmet cooking at home and the desire for authentic, high-quality culinary experiences further amplify demand.
Challenges in the Caviar Market
Despite its growth, the caviar market faces significant challenges. Regulatory hurdles, particularly stringent CITES regulations and varying import/export laws across countries, can create complexities in international trade and increase operational costs. Supply chain issues, including the long maturation period of sturgeons and potential disease outbreaks in aquaculture farms, can lead to supply volatility and price fluctuations. Competitive pressures from other high-value roes and alternative luxury food items also exist. Furthermore, negative perceptions associated with the environmental impact of some aquaculture practices and the historical exploitation of wild sturgeon populations require continuous efforts in sustainable practices and transparent communication to maintain consumer trust.
Emerging Opportunities in Caviar
Emerging opportunities in the caviar market are primarily driven by technological breakthroughs and strategic market expansion. The continued refinement of sustainable aquaculture technologies promises to increase production yields and reduce environmental impact, making caviar more accessible and appealing to a broader consumer base. Strategic partnerships between aquaculture producers and high-end culinary institutions or luxury lifestyle brands can create new avenues for product promotion and market penetration. Furthermore, the untapped potential in burgeoning markets in Asia and the Middle East, coupled with the growing demand for ethically sourced and traceable food products, presents significant opportunities for market expansion and brand building.
Leading Players in the Caviar Sector
- Agroittica Lombarda
- Caviar de France
- Sterling Caviar
- Sturgeon
- Black River Sturgeon
- Beluga Inc VIDIN
- Caviar Court
- Caviar de Riofrio
- Osage Caviar
- Aviar Galilee Farm
- Caviar Creator
- Russian Caviar House
- California Caviar Company
- Hangzhou Qiandaohu Xunlong Sci-tech
- Hubei Tianxia Fisheries
- Amur Group
- Runzhao Fisheries
Key Milestones in Caviar Industry
- 2019: Increased investment in recirculating aquaculture systems (RAS) for sustainable sturgeon farming gains momentum.
- 2020: Global surge in e-commerce for premium food products, including direct-to-consumer caviar sales.
- 2021: Several aquaculture farms achieve ASC (Aquaculture Stewardship Council) certification, emphasizing sustainability.
- 2022: Launch of new caviar varieties with distinct flavor profiles by innovative producers.
- 2023: Expansion of aquaculture operations in previously underserved regions, indicating market diversification.
- 2024: Growing consumer awareness and demand for traceability in the caviar supply chain.
Strategic Outlook for Caviar Market
The strategic outlook for the caviar market is exceptionally positive, driven by sustained demand for luxury goods and continuous innovation in production and sustainability. Growth accelerators include the increasing adoption of advanced aquaculture technologies, leading to greater supply stability and reduced costs, and the expanding global middle class with a higher propensity to spend on premium food experiences. Opportunities lie in further penetrating emerging markets, developing innovative product formats for wider consumer appeal, and strengthening brand narratives around sustainability and ethical sourcing. Strategic focus on e-commerce expansion and building direct relationships with consumers will be crucial for long-term success.
Caviar Segmentation
-
1. Application
- 1.1. Restaurants
- 1.2. Household
-
2. Type
- 2.1. Malossol Caviar
- 2.2. Pressed Caviar
- 2.3. Salted Caviar
- 2.4. Pasteurized Caviar
Caviar Segmentation By Geography
-
1. North America
- 1.1. United States
- 1.2. Canada
- 1.3. Mexico
-
2. South America
- 2.1. Brazil
- 2.2. Argentina
- 2.3. Rest of South America
-
3. Europe
- 3.1. United Kingdom
- 3.2. Germany
- 3.3. France
- 3.4. Italy
- 3.5. Spain
- 3.6. Russia
- 3.7. Benelux
- 3.8. Nordics
- 3.9. Rest of Europe
-
4. Middle East & Africa
- 4.1. Turkey
- 4.2. Israel
- 4.3. GCC
- 4.4. North Africa
- 4.5. South Africa
- 4.6. Rest of Middle East & Africa
-
5. Asia Pacific
- 5.1. China
- 5.2. India
- 5.3. Japan
- 5.4. South Korea
- 5.5. ASEAN
- 5.6. Oceania
- 5.7. Rest of Asia Pacific
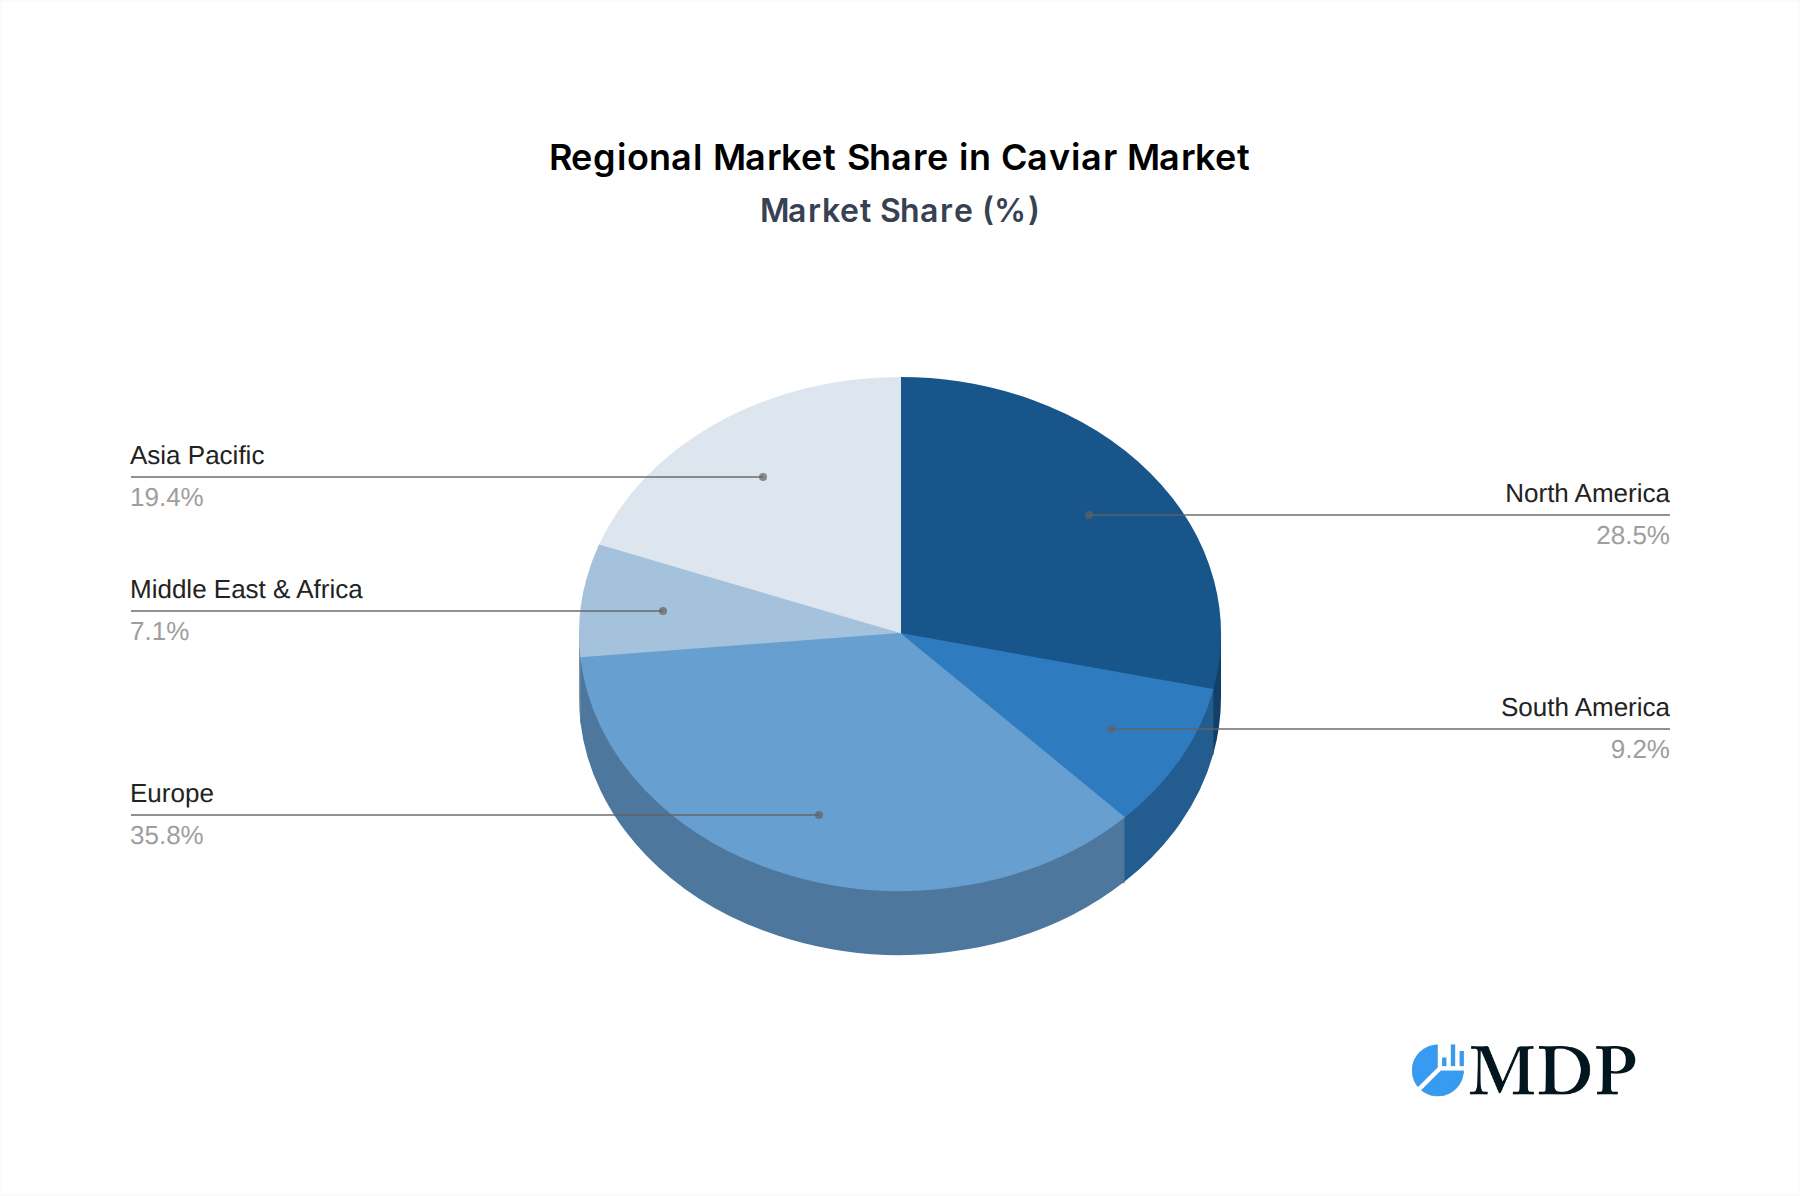
Caviar Regional Market Share
Geographic Coverage of Caviar
Caviar REPORT HIGHLIGHTS
| Aspects | Details |
|---|---|
| Study Period | 2020-2034 |
| Base Year | 2025 |
| Estimated Year | 2026 |
| Forecast Period | 2026-2034 |
| Historical Period | 2020-2025 |
| Growth Rate | CAGR of 8.3% from 2020-2034 |
| Segmentation |
|
Table of Contents
- 1. Introduction
- 1.1. Research Scope
- 1.2. Market Segmentation
- 1.3. Research Objective
- 1.4. Definitions and Assumptions
- 2. Executive Summary
- 2.1. Market Snapshot
- 3. Market Dynamics
- 3.1. Market Drivers
- 3.2. Market Restrains
- 3.3. Market Trends
- 3.4. Market Opportunities
- 4. Market Factor Analysis
- 4.1. Porters Five Forces
- 4.1.1. Bargaining Power of Suppliers
- 4.1.2. Bargaining Power of Buyers
- 4.1.3. Threat of New Entrants
- 4.1.4. Threat of Substitutes
- 4.1.5. Competitive Rivalry
- 4.2. PESTEL analysis
- 4.3. BCG Analysis
- 4.3.1. Stars (High Growth, High Market Share)
- 4.3.2. Cash Cows (Low Growth, High Market Share)
- 4.3.3. Question Mark (High Growth, Low Market Share)
- 4.3.4. Dogs (Low Growth, Low Market Share)
- 4.4. Ansoff Matrix Analysis
- 4.5. Supply Chain Analysis
- 4.6. Regulatory Landscape
- 4.7. Current Market Potential and Opportunity Assessment (TAM–SAM–SOM Framework)
- 4.8. MDP Analyst Note
- 4.1. Porters Five Forces
- 5. Market Analysis, Insights and Forecast 2021-2033
- 5.1. Market Analysis, Insights and Forecast - by Application
- 5.1.1. Restaurants
- 5.1.2. Household
- 5.2. Market Analysis, Insights and Forecast - by Type
- 5.2.1. Malossol Caviar
- 5.2.2. Pressed Caviar
- 5.2.3. Salted Caviar
- 5.2.4. Pasteurized Caviar
- 5.3. Market Analysis, Insights and Forecast - by Region
- 5.3.1. North America
- 5.3.2. South America
- 5.3.3. Europe
- 5.3.4. Middle East & Africa
- 5.3.5. Asia Pacific
- 5.1. Market Analysis, Insights and Forecast - by Application
- 6. Global Caviar Analysis, Insights and Forecast, 2021-2033
- 6.1. Market Analysis, Insights and Forecast - by Application
- 6.1.1. Restaurants
- 6.1.2. Household
- 6.2. Market Analysis, Insights and Forecast - by Type
- 6.2.1. Malossol Caviar
- 6.2.2. Pressed Caviar
- 6.2.3. Salted Caviar
- 6.2.4. Pasteurized Caviar
- 6.1. Market Analysis, Insights and Forecast - by Application
- 7. North America Caviar Analysis, Insights and Forecast, 2020-2032
- 7.1. Market Analysis, Insights and Forecast - by Application
- 7.1.1. Restaurants
- 7.1.2. Household
- 7.2. Market Analysis, Insights and Forecast - by Type
- 7.2.1. Malossol Caviar
- 7.2.2. Pressed Caviar
- 7.2.3. Salted Caviar
- 7.2.4. Pasteurized Caviar
- 7.1. Market Analysis, Insights and Forecast - by Application
- 8. South America Caviar Analysis, Insights and Forecast, 2020-2032
- 8.1. Market Analysis, Insights and Forecast - by Application
- 8.1.1. Restaurants
- 8.1.2. Household
- 8.2. Market Analysis, Insights and Forecast - by Type
- 8.2.1. Malossol Caviar
- 8.2.2. Pressed Caviar
- 8.2.3. Salted Caviar
- 8.2.4. Pasteurized Caviar
- 8.1. Market Analysis, Insights and Forecast - by Application
- 9. Europe Caviar Analysis, Insights and Forecast, 2020-2032
- 9.1. Market Analysis, Insights and Forecast - by Application
- 9.1.1. Restaurants
- 9.1.2. Household
- 9.2. Market Analysis, Insights and Forecast - by Type
- 9.2.1. Malossol Caviar
- 9.2.2. Pressed Caviar
- 9.2.3. Salted Caviar
- 9.2.4. Pasteurized Caviar
- 9.1. Market Analysis, Insights and Forecast - by Application
- 10. Middle East & Africa Caviar Analysis, Insights and Forecast, 2020-2032
- 10.1. Market Analysis, Insights and Forecast - by Application
- 10.1.1. Restaurants
- 10.1.2. Household
- 10.2. Market Analysis, Insights and Forecast - by Type
- 10.2.1. Malossol Caviar
- 10.2.2. Pressed Caviar
- 10.2.3. Salted Caviar
- 10.2.4. Pasteurized Caviar
- 10.1. Market Analysis, Insights and Forecast - by Application
- 11. Asia Pacific Caviar Analysis, Insights and Forecast, 2020-2032
- 11.1. Market Analysis, Insights and Forecast - by Application
- 11.1.1. Restaurants
- 11.1.2. Household
- 11.2. Market Analysis, Insights and Forecast - by Type
- 11.2.1. Malossol Caviar
- 11.2.2. Pressed Caviar
- 11.2.3. Salted Caviar
- 11.2.4. Pasteurized Caviar
- 11.1. Market Analysis, Insights and Forecast - by Application
- 12. Competitive Analysis
- 12.1. Company Profiles
- 12.1.1 Agroittica Lombarda
- 12.1.1.1. Company Overview
- 12.1.1.2. Products
- 12.1.1.3. Company Financials
- 12.1.1.4. SWOT Analysis
- 12.1.2 Caviar de France
- 12.1.2.1. Company Overview
- 12.1.2.2. Products
- 12.1.2.3. Company Financials
- 12.1.2.4. SWOT Analysis
- 12.1.3 Sterling Caviar
- 12.1.3.1. Company Overview
- 12.1.3.2. Products
- 12.1.3.3. Company Financials
- 12.1.3.4. SWOT Analysis
- 12.1.4 Sturgeon
- 12.1.4.1. Company Overview
- 12.1.4.2. Products
- 12.1.4.3. Company Financials
- 12.1.4.4. SWOT Analysis
- 12.1.5 Black River Sturgeon
- 12.1.5.1. Company Overview
- 12.1.5.2. Products
- 12.1.5.3. Company Financials
- 12.1.5.4. SWOT Analysis
- 12.1.6 Beluga Inc VIDIN
- 12.1.6.1. Company Overview
- 12.1.6.2. Products
- 12.1.6.3. Company Financials
- 12.1.6.4. SWOT Analysis
- 12.1.7 Caviar Court
- 12.1.7.1. Company Overview
- 12.1.7.2. Products
- 12.1.7.3. Company Financials
- 12.1.7.4. SWOT Analysis
- 12.1.8 Caviar de Riofrio
- 12.1.8.1. Company Overview
- 12.1.8.2. Products
- 12.1.8.3. Company Financials
- 12.1.8.4. SWOT Analysis
- 12.1.9 Osage Caviar
- 12.1.9.1. Company Overview
- 12.1.9.2. Products
- 12.1.9.3. Company Financials
- 12.1.9.4. SWOT Analysis
- 12.1.10 Aviar Galilee Farm
- 12.1.10.1. Company Overview
- 12.1.10.2. Products
- 12.1.10.3. Company Financials
- 12.1.10.4. SWOT Analysis
- 12.1.11 Caviar Creator
- 12.1.11.1. Company Overview
- 12.1.11.2. Products
- 12.1.11.3. Company Financials
- 12.1.11.4. SWOT Analysis
- 12.1.12 Russian Caviar House
- 12.1.12.1. Company Overview
- 12.1.12.2. Products
- 12.1.12.3. Company Financials
- 12.1.12.4. SWOT Analysis
- 12.1.13 California Caviar Company
- 12.1.13.1. Company Overview
- 12.1.13.2. Products
- 12.1.13.3. Company Financials
- 12.1.13.4. SWOT Analysis
- 12.1.14 Hangzhou Qiandaohu Xunlong Sci-tech
- 12.1.14.1. Company Overview
- 12.1.14.2. Products
- 12.1.14.3. Company Financials
- 12.1.14.4. SWOT Analysis
- 12.1.15 Hubei Tianxia Fisheries
- 12.1.15.1. Company Overview
- 12.1.15.2. Products
- 12.1.15.3. Company Financials
- 12.1.15.4. SWOT Analysis
- 12.1.16 Amur Group
- 12.1.16.1. Company Overview
- 12.1.16.2. Products
- 12.1.16.3. Company Financials
- 12.1.16.4. SWOT Analysis
- 12.1.17 Runzhao Fisheries
- 12.1.17.1. Company Overview
- 12.1.17.2. Products
- 12.1.17.3. Company Financials
- 12.1.17.4. SWOT Analysis
- 12.1.1 Agroittica Lombarda
- 12.2. Market Entropy
- 12.2.1 Company's Key Areas Served
- 12.2.2 Recent Developments
- 12.3. Company Market Share Analysis 2025
- 12.3.1 Top 5 Companies Market Share Analysis
- 12.3.2 Top 3 Companies Market Share Analysis
- 12.4. List of Potential Customers
- 13. Research Methodology
List of Figures
- Figure 1: Global Caviar Revenue Breakdown (million, %) by Region 2025 & 2033
- Figure 2: North America Caviar Revenue (million), by Application 2025 & 2033
- Figure 3: North America Caviar Revenue Share (%), by Application 2025 & 2033
- Figure 4: North America Caviar Revenue (million), by Type 2025 & 2033
- Figure 5: North America Caviar Revenue Share (%), by Type 2025 & 2033
- Figure 6: North America Caviar Revenue (million), by Country 2025 & 2033
- Figure 7: North America Caviar Revenue Share (%), by Country 2025 & 2033
- Figure 8: South America Caviar Revenue (million), by Application 2025 & 2033
- Figure 9: South America Caviar Revenue Share (%), by Application 2025 & 2033
- Figure 10: South America Caviar Revenue (million), by Type 2025 & 2033
- Figure 11: South America Caviar Revenue Share (%), by Type 2025 & 2033
- Figure 12: South America Caviar Revenue (million), by Country 2025 & 2033
- Figure 13: South America Caviar Revenue Share (%), by Country 2025 & 2033
- Figure 14: Europe Caviar Revenue (million), by Application 2025 & 2033
- Figure 15: Europe Caviar Revenue Share (%), by Application 2025 & 2033
- Figure 16: Europe Caviar Revenue (million), by Type 2025 & 2033
- Figure 17: Europe Caviar Revenue Share (%), by Type 2025 & 2033
- Figure 18: Europe Caviar Revenue (million), by Country 2025 & 2033
- Figure 19: Europe Caviar Revenue Share (%), by Country 2025 & 2033
- Figure 20: Middle East & Africa Caviar Revenue (million), by Application 2025 & 2033
- Figure 21: Middle East & Africa Caviar Revenue Share (%), by Application 2025 & 2033
- Figure 22: Middle East & Africa Caviar Revenue (million), by Type 2025 & 2033
- Figure 23: Middle East & Africa Caviar Revenue Share (%), by Type 2025 & 2033
- Figure 24: Middle East & Africa Caviar Revenue (million), by Country 2025 & 2033
- Figure 25: Middle East & Africa Caviar Revenue Share (%), by Country 2025 & 2033
- Figure 26: Asia Pacific Caviar Revenue (million), by Application 2025 & 2033
- Figure 27: Asia Pacific Caviar Revenue Share (%), by Application 2025 & 2033
- Figure 28: Asia Pacific Caviar Revenue (million), by Type 2025 & 2033
- Figure 29: Asia Pacific Caviar Revenue Share (%), by Type 2025 & 2033
- Figure 30: Asia Pacific Caviar Revenue (million), by Country 2025 & 2033
- Figure 31: Asia Pacific Caviar Revenue Share (%), by Country 2025 & 2033
List of Tables
- Table 1: Global Caviar Revenue million Forecast, by Application 2020 & 2033
- Table 2: Global Caviar Revenue million Forecast, by Type 2020 & 2033
- Table 3: Global Caviar Revenue million Forecast, by Region 2020 & 2033
- Table 4: Global Caviar Revenue million Forecast, by Application 2020 & 2033
- Table 5: Global Caviar Revenue million Forecast, by Type 2020 & 2033
- Table 6: Global Caviar Revenue million Forecast, by Country 2020 & 2033
- Table 7: United States Caviar Revenue (million) Forecast, by Application 2020 & 2033
- Table 8: Canada Caviar Revenue (million) Forecast, by Application 2020 & 2033
- Table 9: Mexico Caviar Revenue (million) Forecast, by Application 2020 & 2033
- Table 10: Global Caviar Revenue million Forecast, by Application 2020 & 2033
- Table 11: Global Caviar Revenue million Forecast, by Type 2020 & 2033
- Table 12: Global Caviar Revenue million Forecast, by Country 2020 & 2033
- Table 13: Brazil Caviar Revenue (million) Forecast, by Application 2020 & 2033
- Table 14: Argentina Caviar Revenue (million) Forecast, by Application 2020 & 2033
- Table 15: Rest of South America Caviar Revenue (million) Forecast, by Application 2020 & 2033
- Table 16: Global Caviar Revenue million Forecast, by Application 2020 & 2033
- Table 17: Global Caviar Revenue million Forecast, by Type 2020 & 2033
- Table 18: Global Caviar Revenue million Forecast, by Country 2020 & 2033
- Table 19: United Kingdom Caviar Revenue (million) Forecast, by Application 2020 & 2033
- Table 20: Germany Caviar Revenue (million) Forecast, by Application 2020 & 2033
- Table 21: France Caviar Revenue (million) Forecast, by Application 2020 & 2033
- Table 22: Italy Caviar Revenue (million) Forecast, by Application 2020 & 2033
- Table 23: Spain Caviar Revenue (million) Forecast, by Application 2020 & 2033
- Table 24: Russia Caviar Revenue (million) Forecast, by Application 2020 & 2033
- Table 25: Benelux Caviar Revenue (million) Forecast, by Application 2020 & 2033
- Table 26: Nordics Caviar Revenue (million) Forecast, by Application 2020 & 2033
- Table 27: Rest of Europe Caviar Revenue (million) Forecast, by Application 2020 & 2033
- Table 28: Global Caviar Revenue million Forecast, by Application 2020 & 2033
- Table 29: Global Caviar Revenue million Forecast, by Type 2020 & 2033
- Table 30: Global Caviar Revenue million Forecast, by Country 2020 & 2033
- Table 31: Turkey Caviar Revenue (million) Forecast, by Application 2020 & 2033
- Table 32: Israel Caviar Revenue (million) Forecast, by Application 2020 & 2033
- Table 33: GCC Caviar Revenue (million) Forecast, by Application 2020 & 2033
- Table 34: North Africa Caviar Revenue (million) Forecast, by Application 2020 & 2033
- Table 35: South Africa Caviar Revenue (million) Forecast, by Application 2020 & 2033
- Table 36: Rest of Middle East & Africa Caviar Revenue (million) Forecast, by Application 2020 & 2033
- Table 37: Global Caviar Revenue million Forecast, by Application 2020 & 2033
- Table 38: Global Caviar Revenue million Forecast, by Type 2020 & 2033
- Table 39: Global Caviar Revenue million Forecast, by Country 2020 & 2033
- Table 40: China Caviar Revenue (million) Forecast, by Application 2020 & 2033
- Table 41: India Caviar Revenue (million) Forecast, by Application 2020 & 2033
- Table 42: Japan Caviar Revenue (million) Forecast, by Application 2020 & 2033
- Table 43: South Korea Caviar Revenue (million) Forecast, by Application 2020 & 2033
- Table 44: ASEAN Caviar Revenue (million) Forecast, by Application 2020 & 2033
- Table 45: Oceania Caviar Revenue (million) Forecast, by Application 2020 & 2033
- Table 46: Rest of Asia Pacific Caviar Revenue (million) Forecast, by Application 2020 & 2033
Frequently Asked Questions
1. What is the projected Compound Annual Growth Rate (CAGR) of the Caviar?
The projected CAGR is approximately 8.3%.
2. Which companies are prominent players in the Caviar?
Key companies in the market include Agroittica Lombarda, Caviar de France, Sterling Caviar, Sturgeon, Black River Sturgeon, Beluga Inc VIDIN, Caviar Court, Caviar de Riofrio, Osage Caviar, Aviar Galilee Farm, Caviar Creator, Russian Caviar House, California Caviar Company, Hangzhou Qiandaohu Xunlong Sci-tech, Hubei Tianxia Fisheries, Amur Group, Runzhao Fisheries.
3. What are the main segments of the Caviar?
The market segments include Application, Type.
4. Can you provide details about the market size?
The market size is estimated to be USD 412.65 million as of 2022.
5. What are some drivers contributing to market growth?
N/A
6. What are the notable trends driving market growth?
N/A
7. Are there any restraints impacting market growth?
N/A
8. Can you provide examples of recent developments in the market?
N/A
9. What pricing options are available for accessing the report?
Pricing options include single-user, multi-user, and enterprise licenses priced at USD 5900.00, USD 8850.00, and USD 11800.00 respectively.
10. Is the market size provided in terms of value or volume?
The market size is provided in terms of value, measured in million.
11. Are there any specific market keywords associated with the report?
Yes, the market keyword associated with the report is "Caviar," which aids in identifying and referencing the specific market segment covered.
12. How do I determine which pricing option suits my needs best?
The pricing options vary based on user requirements and access needs. Individual users may opt for single-user licenses, while businesses requiring broader access may choose multi-user or enterprise licenses for cost-effective access to the report.
13. Are there any additional resources or data provided in the Caviar report?
While the report offers comprehensive insights, it's advisable to review the specific contents or supplementary materials provided to ascertain if additional resources or data are available.
14. How can I stay updated on further developments or reports in the Caviar?
To stay informed about further developments, trends, and reports in the Caviar, consider subscribing to industry newsletters, following relevant companies and organizations, or regularly checking reputable industry news sources and publications.
Methodology
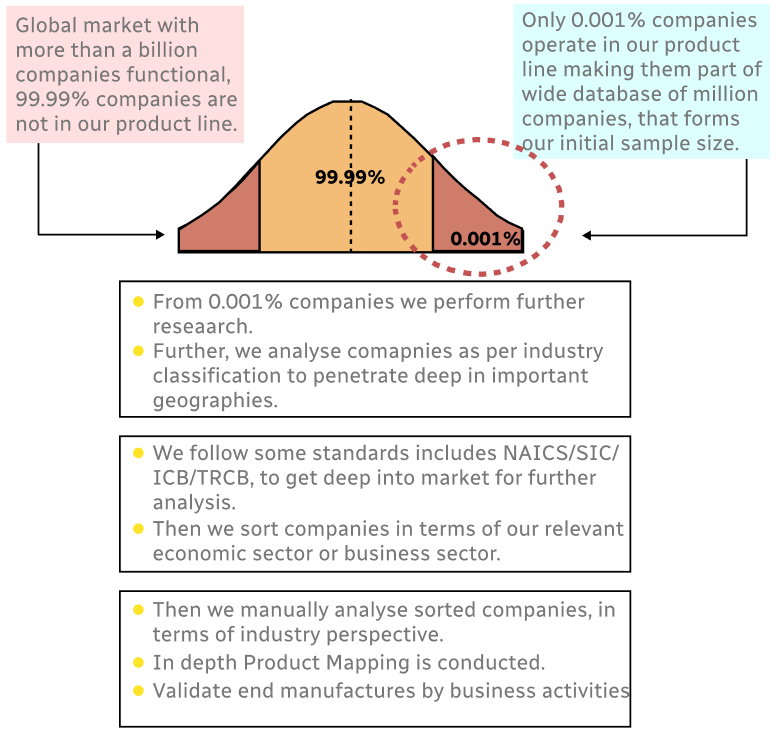
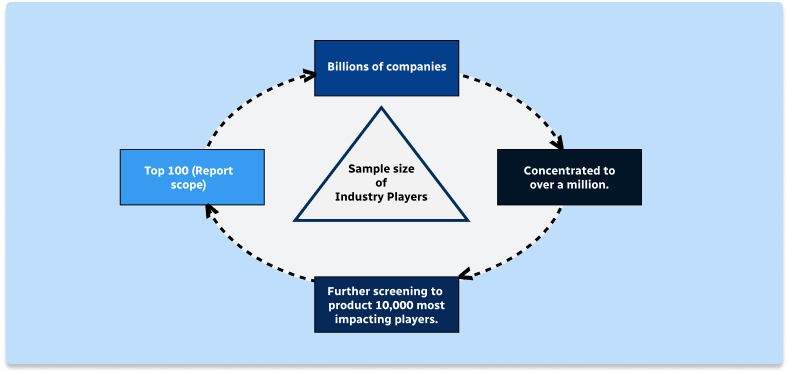
Step 1 - Identification of Relevant Samples Size from Population Database
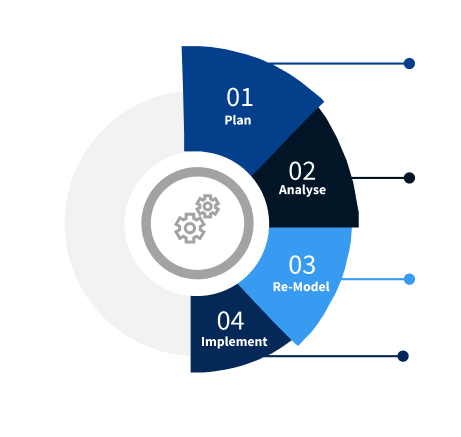
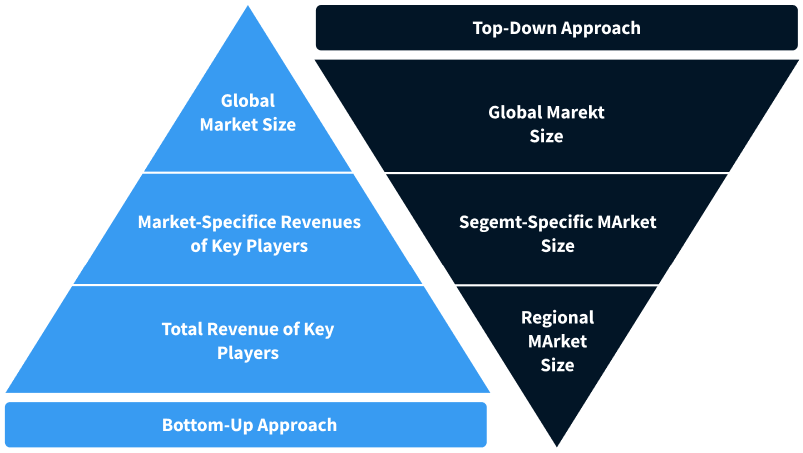
Step 2 - Approaches for Defining Global Market Size (Value, Volume* & Price*)
Note*: In applicable scenarios
Step 3 - Data Sources
Primary Research
- Web Analytics
- Survey Reports
- Research Institute
- Latest Research Reports
- Opinion Leaders
Secondary Research
- Annual Reports
- White Paper
- Latest Press Release
- Industry Association
- Paid Database
- Investor Presentations
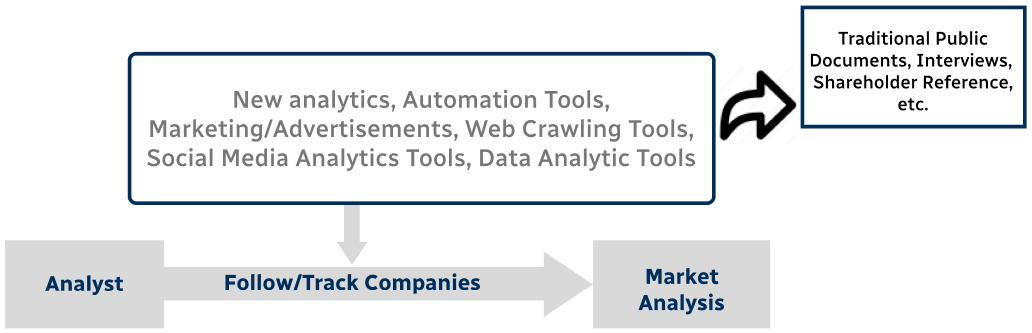
Step 4 - Data Triangulation
Involves using different sources of information in order to increase the validity of a study
These sources are likely to be stakeholders in a program - participants, other researchers, program staff, other community members, and so on.
Then we put all data in single framework & apply various statistical tools to find out the dynamic on the market.
During the analysis stage, feedback from the stakeholder groups would be compared to determine areas of agreement as well as areas of divergence