

Key Insights
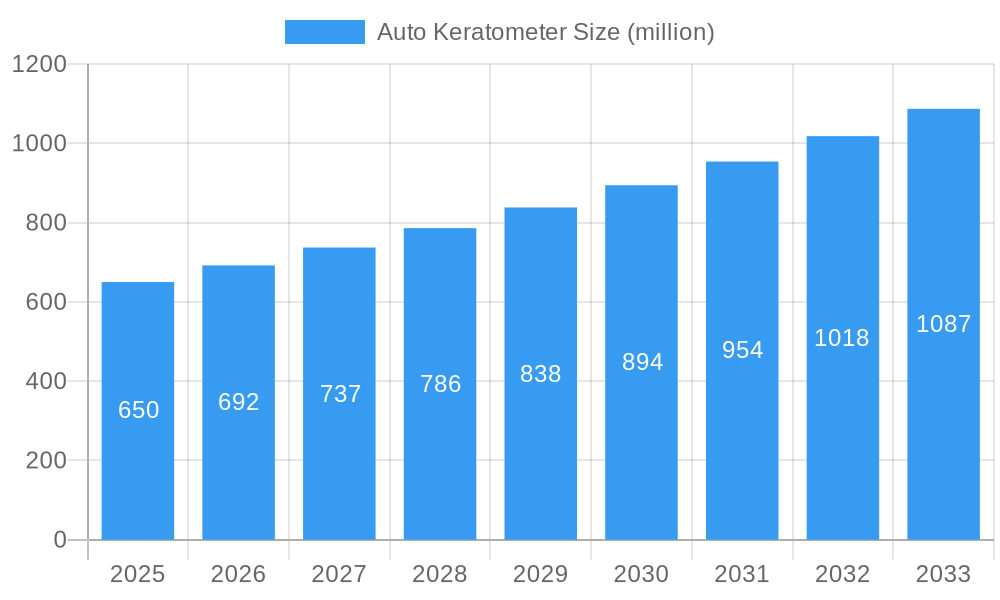
The global Auto Keratometer market is poised for significant expansion, projected to reach approximately $650 million by 2025, with a robust Compound Annual Growth Rate (CAGR) of around 6.5% anticipated through 2033. This upward trajectory is primarily fueled by the increasing prevalence of refractive errors globally, including myopia, hyperopia, and astigmatism. The aging global population also contributes to market growth, as age-related vision changes often necessitate regular eye examinations. Advancements in diagnostic technology, leading to more accurate and faster measurements by auto keratometers, are further driving adoption in both established and emerging economies. The rising demand for advanced ophthalmic equipment in hospitals, clinics, and specialized diagnosis centers underscores the market's potential. Furthermore, increasing healthcare expenditure, particularly in developing regions, and growing awareness about the importance of regular eye check-ups are acting as significant catalysts. The shift towards minimally invasive diagnostic procedures also favors the widespread use of auto keratometers, which offer non-contact and efficient measurement capabilities.
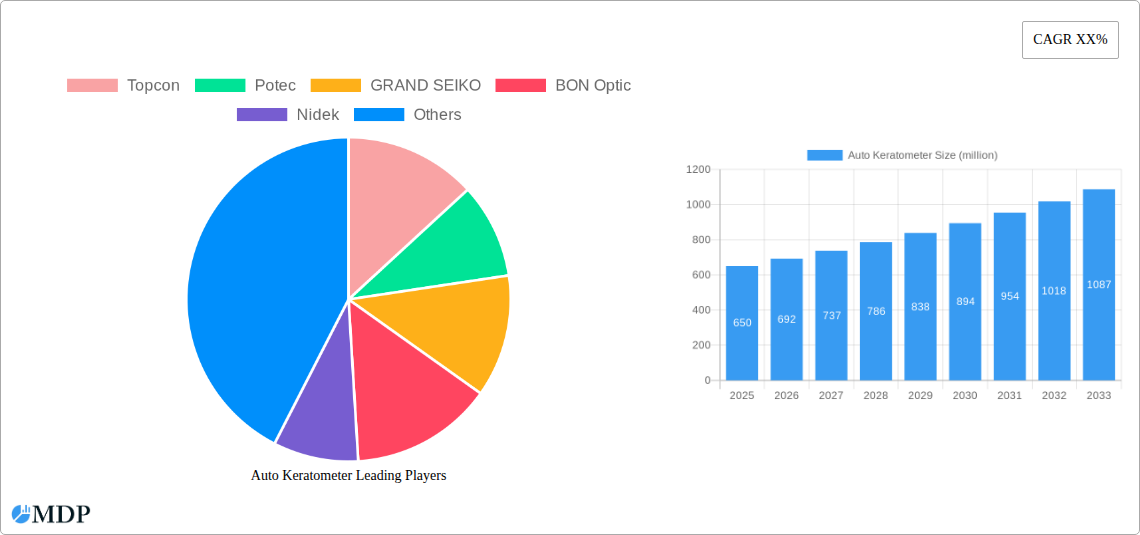
Auto Keratometer Market Size (In Million)
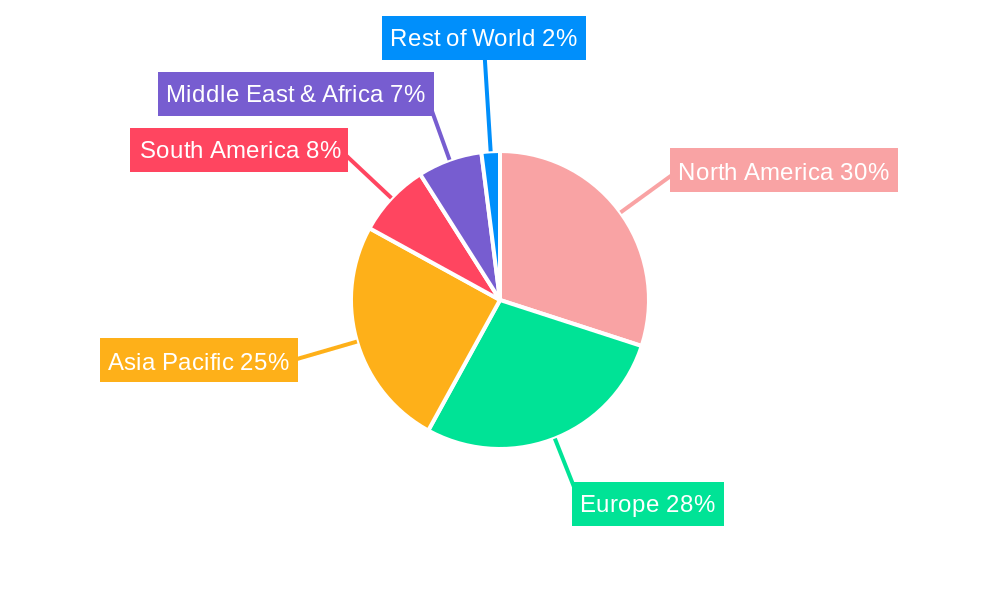
The market segmentation reveals a healthy demand for both handheld and benchtop auto keratometers, catering to diverse clinical settings and portability needs. Hospitals and diagnosis centers represent the largest application segments due to high patient volumes and the need for sophisticated diagnostic tools. However, the growing number of specialized eye clinics and optometry practices is also contributing significantly to the market's growth. Geographically, North America and Europe are expected to maintain their dominance due to well-established healthcare infrastructure and high disposable incomes. Nevertheless, the Asia Pacific region, particularly China and India, is projected to witness the fastest growth owing to a large, underserved population, increasing healthcare investments, and a rising incidence of eye conditions. Key industry players like Topcon, Nidek, and Potec are actively investing in research and development to introduce innovative features and expand their market reach, further stimulating competition and market expansion. Restraints such as the initial cost of advanced devices and a shortage of skilled ophthalmologists in some regions might pose challenges, but the overwhelming demand for precise and efficient vision diagnostics is set to propel the market forward.
Auto Keratometer Company Market Share
Auto Keratometer Market: Comprehensive Growth Analysis & Forecast (2019-2033)
This in-depth report provides a meticulously analyzed forecast of the global Auto Keratometer market, projecting robust growth from 2019 to 2033. The study leverages a robust historical analysis (2019-2024), a detailed base year assessment (2025), and an extensive forecast period (2025-2033) to offer actionable insights for industry stakeholders. With a projected market size exceeding XX million by 2025 and a Compound Annual Growth Rate (CAGR) of XX%, this report is an indispensable tool for understanding current trends, identifying future opportunities, and strategizing for sustained success in the dynamic ophthalmology diagnostics landscape.
Auto Keratometer Market Dynamics & Concentration
The global Auto Keratometer market exhibits a moderate to high concentration, with key players like Topcon, Potec, GRAND SEIKO, BON Optic, Nidek, Menicon, Visionix, Coburn Technologies, and others holding significant market share. Innovation drivers are primarily fueled by advancements in optical technology, miniaturization of devices, and increased demand for precise pre-operative measurements for refractive surgeries and contact lens fittings. Regulatory frameworks, particularly those governing medical device approvals in regions like North America and Europe, play a crucial role in shaping market entry and product development. Product substitutes, such as manual keratometers and other advanced diagnostic tools, exist but are gradually being displaced by the efficiency and accuracy of auto keratometers. End-user trends indicate a growing preference for automated, user-friendly devices in ophthalmology practices, driven by the need for faster patient throughput and reduced diagnostic errors. Merger and acquisition (M&A) activities within the sector are moderate, with approximately XX major deals recorded between 2019 and 2024, signaling consolidation and strategic expansion efforts by leading companies.
Auto Keratometer Industry Trends & Analysis
The Auto Keratometer industry is on a significant upward trajectory, driven by a confluence of factors poised to propel its market size to over XX million by 2025 and sustain a compelling CAGR of XX% throughout the forecast period (2025-2033). A primary growth driver is the escalating global prevalence of eye disorders such as myopia, hyperopia, astigmatism, and keratoconus. This demographic shift necessitates early and accurate diagnosis, placing auto keratometers at the forefront of ophthalmic examination. Technological disruptions are playing a pivotal role, with manufacturers increasingly incorporating advanced features like wavefront technology, enhanced imaging capabilities, and integration with electronic health records (EHRs). These innovations not only improve diagnostic accuracy but also streamline clinical workflows, leading to enhanced patient care and operational efficiency. Consumer preferences are increasingly leaning towards non-invasive, rapid, and precise diagnostic methods. Patients expect quick and accurate assessments, and auto keratometers fulfill this demand effectively. The competitive dynamics within the market are characterized by intense innovation, with companies striving to differentiate through superior technology, cost-effectiveness, and comprehensive service offerings. Market penetration is expected to deepen significantly, particularly in emerging economies where access to advanced ophthalmic diagnostics is rapidly expanding. The growing demand for personalized medicine in ophthalmology further fuels the need for precise measurements provided by auto keratometers, underpinning a sustained period of robust market expansion.
Leading Markets & Segments in Auto Keratometer
The Asia Pacific region is projected to be a dominant market for Auto Keratometers, largely driven by the economic policies and healthcare infrastructure development in countries like China and India. These nations are experiencing a substantial increase in disposable income and a growing awareness of eye health, leading to higher adoption rates of advanced ophthalmic diagnostic equipment.
- Dominant Country: China stands out as a leading market due to its vast population, increasing healthcare expenditure, and a burgeoning number of ophthalmic clinics and hospitals adopting modern diagnostic technologies. Government initiatives aimed at improving public health and screening programs further bolster demand.
- Dominant Application: Clinics: Ophthalmic Clinics are expected to be the largest segment within the application categorization. The increasing trend of specialized eye care centers and the need for efficient patient throughput in these settings make auto keratometers a crucial investment. The high volume of routine eye examinations, refractive error assessments, and pre-operative evaluations for surgeries drives this dominance.
- Dominant Type: Benchtop Auto Keratometer: The Benchtop Auto Keratometer segment is anticipated to lead in market share. These devices offer superior precision, a wider range of functionalities, and greater stability compared to their handheld counterparts, making them the preferred choice for established eye care facilities and hospitals. Their integration into comprehensive diagnostic suites further solidifies their market position.
- Economic Policies and Infrastructure: Favorable government policies promoting healthcare infrastructure development, tax incentives for medical equipment purchases, and increased public and private investment in healthcare are key drivers of market growth in leading regions.
- Technological Advancements: The continuous integration of advanced technologies, such as enhanced imaging resolutions, improved automation, and connectivity features, is also a significant factor influencing segment dominance, as users opt for devices that offer greater clinical utility and efficiency.
Auto Keratometer Product Developments
Recent product developments in the Auto Keratometer market focus on enhancing accuracy, speed, and user-friendliness. Innovations include devices with integrated corneal topography, advanced measurement algorithms for improved precision in irregular corneas, and miniaturized designs for better portability and space utilization in clinics. Companies are also prioritizing seamless integration with EMR/EHR systems and cloud-based data management for streamlined workflow and enhanced data analysis. These advancements offer significant competitive advantages by providing clinicians with more comprehensive diagnostic data, leading to better treatment planning and improved patient outcomes, thereby fitting perfectly into the evolving demands of modern ophthalmology.
Key Drivers of Auto Keratometer Growth
The global Auto Keratometer market is propelled by several key drivers. Firstly, the increasing prevalence of refractive errors and eye diseases worldwide necessitates accurate and efficient diagnostic tools. Secondly, technological advancements, such as improved optical systems and software algorithms, are enhancing device precision and functionality. Thirdly, the growing demand for refractive surgeries (LASIK, PRK) and the widespread use of contact lenses create a constant need for precise keratometric measurements. Finally, favorable healthcare policies and rising healthcare expenditure, particularly in emerging economies, are expanding access to advanced ophthalmic diagnostic equipment.
Challenges in the Auto Keratometer Market
Despite its promising growth, the Auto Keratometer market faces certain challenges. High initial investment costs for advanced devices can be a barrier for smaller clinics and practitioners in price-sensitive markets. Stringent regulatory approvals in various countries can lead to lengthy market entry times and increased compliance costs. Furthermore, limited awareness and understanding of advanced features among some end-users in developing regions can hinder adoption. Finally, intense competition among key players can lead to price pressures, impacting profit margins.
Emerging Opportunities in Auto Keratometer
Emerging opportunities in the Auto Keratometer market are primarily driven by technological innovation and expanding market reach. The development of AI-powered diagnostic assistants integrated with auto keratometers holds immense potential for automated analysis and early detection of subtle corneal anomalies. Expansion into emerging economies with rapidly developing healthcare sectors presents a significant growth avenue, as demand for advanced ophthalmic diagnostics rises. Strategic partnerships between manufacturers and ophthalmic software providers can lead to integrated diagnostic solutions, offering enhanced value to end-users. Furthermore, the increasing focus on tele-ophthalmology could spur the development of more compact, remotely manageable auto keratometer systems.
Leading Players in the Auto Keratometer Sector
- Topcon
- Potec
- GRAND SEIKO
- BON Optic
- Nidek
- Menicon
- Visionix
- Coburn Technologies
Key Milestones in Auto Keratometer Industry
- 2019: Launch of next-generation auto keratometers with enhanced imaging resolution and faster scan times.
- 2020: Increased adoption of cloud connectivity for data management and remote access to diagnostic information.
- 2021: Introduction of AI-driven features for improved detection of subtle corneal abnormalities.
- 2022: Significant market penetration in emerging economies driven by increased healthcare investment.
- 2023: Development of hybrid devices combining auto keratometry with other diagnostic functions.
- 2024: Focus on miniaturization and improved portability for handheld auto keratometer models.
Strategic Outlook for Auto Keratometer Market
The strategic outlook for the Auto Keratometer market remains highly optimistic, fueled by ongoing technological advancements and increasing global demand for precise ophthalmic diagnostics. Future growth accelerators will likely involve further integration of artificial intelligence for enhanced diagnostic capabilities, the development of more affordable and accessible solutions for emerging markets, and the creation of comprehensive digital health platforms that seamlessly incorporate auto keratometry data. Companies that focus on innovation, strategic collaborations, and expanding their global footprint are best positioned to capitalize on the significant market potential and achieve sustained success in the coming years.
Auto Keratometer Segmentation
-
1. Application
- 1.1. Hospitals
- 1.2. Clinics
- 1.3. Diagnosis Centers
- 1.4. Others
-
2. Types
- 2.1. Handheld Auto Keratometer
- 2.2. Benchtop Auto Keratometer
Auto Keratometer Segmentation By Geography
-
1. North America
- 1.1. United States
- 1.2. Canada
- 1.3. Mexico
-
2. South America
- 2.1. Brazil
- 2.2. Argentina
- 2.3. Rest of South America
-
3. Europe
- 3.1. United Kingdom
- 3.2. Germany
- 3.3. France
- 3.4. Italy
- 3.5. Spain
- 3.6. Russia
- 3.7. Benelux
- 3.8. Nordics
- 3.9. Rest of Europe
-
4. Middle East & Africa
- 4.1. Turkey
- 4.2. Israel
- 4.3. GCC
- 4.4. North Africa
- 4.5. South Africa
- 4.6. Rest of Middle East & Africa
-
5. Asia Pacific
- 5.1. China
- 5.2. India
- 5.3. Japan
- 5.4. South Korea
- 5.5. ASEAN
- 5.6. Oceania
- 5.7. Rest of Asia Pacific
Auto Keratometer Regional Market Share
Geographic Coverage of Auto Keratometer
Auto Keratometer REPORT HIGHLIGHTS
| Aspects | Details |
|---|---|
| Study Period | 2020-2034 |
| Base Year | 2025 |
| Estimated Year | 2026 |
| Forecast Period | 2026-2034 |
| Historical Period | 2020-2025 |
| Growth Rate | CAGR of 5.71% from 2020-2034 |
| Segmentation |
|
Table of Contents
- 1. Introduction
- 1.1. Research Scope
- 1.2. Market Segmentation
- 1.3. Research Methodology
- 1.4. Definitions and Assumptions
- 2. Executive Summary
- 2.1. Introduction
- 3. Market Dynamics
- 3.1. Introduction
- 3.2. Market Drivers
- 3.3. Market Restrains
- 3.4. Market Trends
- 4. Market Factor Analysis
- 4.1. Porters Five Forces
- 4.2. Supply/Value Chain
- 4.3. PESTEL analysis
- 4.4. Market Entropy
- 4.5. Patent/Trademark Analysis
- 5. Global Auto Keratometer Analysis, Insights and Forecast, 2020-2032
- 5.1. Market Analysis, Insights and Forecast - by Application
- 5.1.1. Hospitals
- 5.1.2. Clinics
- 5.1.3. Diagnosis Centers
- 5.1.4. Others
- 5.2. Market Analysis, Insights and Forecast - by Types
- 5.2.1. Handheld Auto Keratometer
- 5.2.2. Benchtop Auto Keratometer
- 5.3. Market Analysis, Insights and Forecast - by Region
- 5.3.1. North America
- 5.3.2. South America
- 5.3.3. Europe
- 5.3.4. Middle East & Africa
- 5.3.5. Asia Pacific
- 5.1. Market Analysis, Insights and Forecast - by Application
- 6. North America Auto Keratometer Analysis, Insights and Forecast, 2020-2032
- 6.1. Market Analysis, Insights and Forecast - by Application
- 6.1.1. Hospitals
- 6.1.2. Clinics
- 6.1.3. Diagnosis Centers
- 6.1.4. Others
- 6.2. Market Analysis, Insights and Forecast - by Types
- 6.2.1. Handheld Auto Keratometer
- 6.2.2. Benchtop Auto Keratometer
- 6.1. Market Analysis, Insights and Forecast - by Application
- 7. South America Auto Keratometer Analysis, Insights and Forecast, 2020-2032
- 7.1. Market Analysis, Insights and Forecast - by Application
- 7.1.1. Hospitals
- 7.1.2. Clinics
- 7.1.3. Diagnosis Centers
- 7.1.4. Others
- 7.2. Market Analysis, Insights and Forecast - by Types
- 7.2.1. Handheld Auto Keratometer
- 7.2.2. Benchtop Auto Keratometer
- 7.1. Market Analysis, Insights and Forecast - by Application
- 8. Europe Auto Keratometer Analysis, Insights and Forecast, 2020-2032
- 8.1. Market Analysis, Insights and Forecast - by Application
- 8.1.1. Hospitals
- 8.1.2. Clinics
- 8.1.3. Diagnosis Centers
- 8.1.4. Others
- 8.2. Market Analysis, Insights and Forecast - by Types
- 8.2.1. Handheld Auto Keratometer
- 8.2.2. Benchtop Auto Keratometer
- 8.1. Market Analysis, Insights and Forecast - by Application
- 9. Middle East & Africa Auto Keratometer Analysis, Insights and Forecast, 2020-2032
- 9.1. Market Analysis, Insights and Forecast - by Application
- 9.1.1. Hospitals
- 9.1.2. Clinics
- 9.1.3. Diagnosis Centers
- 9.1.4. Others
- 9.2. Market Analysis, Insights and Forecast - by Types
- 9.2.1. Handheld Auto Keratometer
- 9.2.2. Benchtop Auto Keratometer
- 9.1. Market Analysis, Insights and Forecast - by Application
- 10. Asia Pacific Auto Keratometer Analysis, Insights and Forecast, 2020-2032
- 10.1. Market Analysis, Insights and Forecast - by Application
- 10.1.1. Hospitals
- 10.1.2. Clinics
- 10.1.3. Diagnosis Centers
- 10.1.4. Others
- 10.2. Market Analysis, Insights and Forecast - by Types
- 10.2.1. Handheld Auto Keratometer
- 10.2.2. Benchtop Auto Keratometer
- 10.1. Market Analysis, Insights and Forecast - by Application
- 11. Competitive Analysis
- 11.1. Global Market Share Analysis 2025
- 11.2. Company Profiles
- 11.2.1 Topcon
- 11.2.1.1. Overview
- 11.2.1.2. Products
- 11.2.1.3. SWOT Analysis
- 11.2.1.4. Recent Developments
- 11.2.1.5. Financials (Based on Availability)
- 11.2.2 Potec
- 11.2.2.1. Overview
- 11.2.2.2. Products
- 11.2.2.3. SWOT Analysis
- 11.2.2.4. Recent Developments
- 11.2.2.5. Financials (Based on Availability)
- 11.2.3 GRAND SEIKO
- 11.2.3.1. Overview
- 11.2.3.2. Products
- 11.2.3.3. SWOT Analysis
- 11.2.3.4. Recent Developments
- 11.2.3.5. Financials (Based on Availability)
- 11.2.4 BON Optic
- 11.2.4.1. Overview
- 11.2.4.2. Products
- 11.2.4.3. SWOT Analysis
- 11.2.4.4. Recent Developments
- 11.2.4.5. Financials (Based on Availability)
- 11.2.5 Nidek
- 11.2.5.1. Overview
- 11.2.5.2. Products
- 11.2.5.3. SWOT Analysis
- 11.2.5.4. Recent Developments
- 11.2.5.5. Financials (Based on Availability)
- 11.2.6 Menicon
- 11.2.6.1. Overview
- 11.2.6.2. Products
- 11.2.6.3. SWOT Analysis
- 11.2.6.4. Recent Developments
- 11.2.6.5. Financials (Based on Availability)
- 11.2.7 Visionix
- 11.2.7.1. Overview
- 11.2.7.2. Products
- 11.2.7.3. SWOT Analysis
- 11.2.7.4. Recent Developments
- 11.2.7.5. Financials (Based on Availability)
- 11.2.8 Coburn Technologies
- 11.2.8.1. Overview
- 11.2.8.2. Products
- 11.2.8.3. SWOT Analysis
- 11.2.8.4. Recent Developments
- 11.2.8.5. Financials (Based on Availability)
- 11.2.1 Topcon
List of Figures
- Figure 1: Global Auto Keratometer Revenue Breakdown (undefined, %) by Region 2025 & 2033
- Figure 2: North America Auto Keratometer Revenue (undefined), by Application 2025 & 2033
- Figure 3: North America Auto Keratometer Revenue Share (%), by Application 2025 & 2033
- Figure 4: North America Auto Keratometer Revenue (undefined), by Types 2025 & 2033
- Figure 5: North America Auto Keratometer Revenue Share (%), by Types 2025 & 2033
- Figure 6: North America Auto Keratometer Revenue (undefined), by Country 2025 & 2033
- Figure 7: North America Auto Keratometer Revenue Share (%), by Country 2025 & 2033
- Figure 8: South America Auto Keratometer Revenue (undefined), by Application 2025 & 2033
- Figure 9: South America Auto Keratometer Revenue Share (%), by Application 2025 & 2033
- Figure 10: South America Auto Keratometer Revenue (undefined), by Types 2025 & 2033
- Figure 11: South America Auto Keratometer Revenue Share (%), by Types 2025 & 2033
- Figure 12: South America Auto Keratometer Revenue (undefined), by Country 2025 & 2033
- Figure 13: South America Auto Keratometer Revenue Share (%), by Country 2025 & 2033
- Figure 14: Europe Auto Keratometer Revenue (undefined), by Application 2025 & 2033
- Figure 15: Europe Auto Keratometer Revenue Share (%), by Application 2025 & 2033
- Figure 16: Europe Auto Keratometer Revenue (undefined), by Types 2025 & 2033
- Figure 17: Europe Auto Keratometer Revenue Share (%), by Types 2025 & 2033
- Figure 18: Europe Auto Keratometer Revenue (undefined), by Country 2025 & 2033
- Figure 19: Europe Auto Keratometer Revenue Share (%), by Country 2025 & 2033
- Figure 20: Middle East & Africa Auto Keratometer Revenue (undefined), by Application 2025 & 2033
- Figure 21: Middle East & Africa Auto Keratometer Revenue Share (%), by Application 2025 & 2033
- Figure 22: Middle East & Africa Auto Keratometer Revenue (undefined), by Types 2025 & 2033
- Figure 23: Middle East & Africa Auto Keratometer Revenue Share (%), by Types 2025 & 2033
- Figure 24: Middle East & Africa Auto Keratometer Revenue (undefined), by Country 2025 & 2033
- Figure 25: Middle East & Africa Auto Keratometer Revenue Share (%), by Country 2025 & 2033
- Figure 26: Asia Pacific Auto Keratometer Revenue (undefined), by Application 2025 & 2033
- Figure 27: Asia Pacific Auto Keratometer Revenue Share (%), by Application 2025 & 2033
- Figure 28: Asia Pacific Auto Keratometer Revenue (undefined), by Types 2025 & 2033
- Figure 29: Asia Pacific Auto Keratometer Revenue Share (%), by Types 2025 & 2033
- Figure 30: Asia Pacific Auto Keratometer Revenue (undefined), by Country 2025 & 2033
- Figure 31: Asia Pacific Auto Keratometer Revenue Share (%), by Country 2025 & 2033
List of Tables
- Table 1: Global Auto Keratometer Revenue undefined Forecast, by Application 2020 & 2033
- Table 2: Global Auto Keratometer Revenue undefined Forecast, by Types 2020 & 2033
- Table 3: Global Auto Keratometer Revenue undefined Forecast, by Region 2020 & 2033
- Table 4: Global Auto Keratometer Revenue undefined Forecast, by Application 2020 & 2033
- Table 5: Global Auto Keratometer Revenue undefined Forecast, by Types 2020 & 2033
- Table 6: Global Auto Keratometer Revenue undefined Forecast, by Country 2020 & 2033
- Table 7: United States Auto Keratometer Revenue (undefined) Forecast, by Application 2020 & 2033
- Table 8: Canada Auto Keratometer Revenue (undefined) Forecast, by Application 2020 & 2033
- Table 9: Mexico Auto Keratometer Revenue (undefined) Forecast, by Application 2020 & 2033
- Table 10: Global Auto Keratometer Revenue undefined Forecast, by Application 2020 & 2033
- Table 11: Global Auto Keratometer Revenue undefined Forecast, by Types 2020 & 2033
- Table 12: Global Auto Keratometer Revenue undefined Forecast, by Country 2020 & 2033
- Table 13: Brazil Auto Keratometer Revenue (undefined) Forecast, by Application 2020 & 2033
- Table 14: Argentina Auto Keratometer Revenue (undefined) Forecast, by Application 2020 & 2033
- Table 15: Rest of South America Auto Keratometer Revenue (undefined) Forecast, by Application 2020 & 2033
- Table 16: Global Auto Keratometer Revenue undefined Forecast, by Application 2020 & 2033
- Table 17: Global Auto Keratometer Revenue undefined Forecast, by Types 2020 & 2033
- Table 18: Global Auto Keratometer Revenue undefined Forecast, by Country 2020 & 2033
- Table 19: United Kingdom Auto Keratometer Revenue (undefined) Forecast, by Application 2020 & 2033
- Table 20: Germany Auto Keratometer Revenue (undefined) Forecast, by Application 2020 & 2033
- Table 21: France Auto Keratometer Revenue (undefined) Forecast, by Application 2020 & 2033
- Table 22: Italy Auto Keratometer Revenue (undefined) Forecast, by Application 2020 & 2033
- Table 23: Spain Auto Keratometer Revenue (undefined) Forecast, by Application 2020 & 2033
- Table 24: Russia Auto Keratometer Revenue (undefined) Forecast, by Application 2020 & 2033
- Table 25: Benelux Auto Keratometer Revenue (undefined) Forecast, by Application 2020 & 2033
- Table 26: Nordics Auto Keratometer Revenue (undefined) Forecast, by Application 2020 & 2033
- Table 27: Rest of Europe Auto Keratometer Revenue (undefined) Forecast, by Application 2020 & 2033
- Table 28: Global Auto Keratometer Revenue undefined Forecast, by Application 2020 & 2033
- Table 29: Global Auto Keratometer Revenue undefined Forecast, by Types 2020 & 2033
- Table 30: Global Auto Keratometer Revenue undefined Forecast, by Country 2020 & 2033
- Table 31: Turkey Auto Keratometer Revenue (undefined) Forecast, by Application 2020 & 2033
- Table 32: Israel Auto Keratometer Revenue (undefined) Forecast, by Application 2020 & 2033
- Table 33: GCC Auto Keratometer Revenue (undefined) Forecast, by Application 2020 & 2033
- Table 34: North Africa Auto Keratometer Revenue (undefined) Forecast, by Application 2020 & 2033
- Table 35: South Africa Auto Keratometer Revenue (undefined) Forecast, by Application 2020 & 2033
- Table 36: Rest of Middle East & Africa Auto Keratometer Revenue (undefined) Forecast, by Application 2020 & 2033
- Table 37: Global Auto Keratometer Revenue undefined Forecast, by Application 2020 & 2033
- Table 38: Global Auto Keratometer Revenue undefined Forecast, by Types 2020 & 2033
- Table 39: Global Auto Keratometer Revenue undefined Forecast, by Country 2020 & 2033
- Table 40: China Auto Keratometer Revenue (undefined) Forecast, by Application 2020 & 2033
- Table 41: India Auto Keratometer Revenue (undefined) Forecast, by Application 2020 & 2033
- Table 42: Japan Auto Keratometer Revenue (undefined) Forecast, by Application 2020 & 2033
- Table 43: South Korea Auto Keratometer Revenue (undefined) Forecast, by Application 2020 & 2033
- Table 44: ASEAN Auto Keratometer Revenue (undefined) Forecast, by Application 2020 & 2033
- Table 45: Oceania Auto Keratometer Revenue (undefined) Forecast, by Application 2020 & 2033
- Table 46: Rest of Asia Pacific Auto Keratometer Revenue (undefined) Forecast, by Application 2020 & 2033
Frequently Asked Questions
1. What is the projected Compound Annual Growth Rate (CAGR) of the Auto Keratometer?
The projected CAGR is approximately 5.71%.
2. Which companies are prominent players in the Auto Keratometer?
Key companies in the market include Topcon, Potec, GRAND SEIKO, BON Optic, Nidek, Menicon, Visionix, Coburn Technologies.
3. What are the main segments of the Auto Keratometer?
The market segments include Application, Types.
4. Can you provide details about the market size?
The market size is estimated to be USD XXX N/A as of 2022.
5. What are some drivers contributing to market growth?
N/A
6. What are the notable trends driving market growth?
N/A
7. Are there any restraints impacting market growth?
N/A
8. Can you provide examples of recent developments in the market?
N/A
9. What pricing options are available for accessing the report?
Pricing options include single-user, multi-user, and enterprise licenses priced at USD 4900.00, USD 7350.00, and USD 9800.00 respectively.
10. Is the market size provided in terms of value or volume?
The market size is provided in terms of value, measured in N/A.
11. Are there any specific market keywords associated with the report?
Yes, the market keyword associated with the report is "Auto Keratometer," which aids in identifying and referencing the specific market segment covered.
12. How do I determine which pricing option suits my needs best?
The pricing options vary based on user requirements and access needs. Individual users may opt for single-user licenses, while businesses requiring broader access may choose multi-user or enterprise licenses for cost-effective access to the report.
13. Are there any additional resources or data provided in the Auto Keratometer report?
While the report offers comprehensive insights, it's advisable to review the specific contents or supplementary materials provided to ascertain if additional resources or data are available.
14. How can I stay updated on further developments or reports in the Auto Keratometer?
To stay informed about further developments, trends, and reports in the Auto Keratometer, consider subscribing to industry newsletters, following relevant companies and organizations, or regularly checking reputable industry news sources and publications.
Methodology
Step 1 - Identification of Relevant Samples Size from Population Database


Step 2 - Approaches for Defining Global Market Size (Value, Volume* & Price*)

Note*: In applicable scenarios
Step 3 - Data Sources
Primary Research
- Web Analytics
- Survey Reports
- Research Institute
- Latest Research Reports
- Opinion Leaders
Secondary Research
- Annual Reports
- White Paper
- Latest Press Release
- Industry Association
- Paid Database
- Investor Presentations

Step 4 - Data Triangulation
Involves using different sources of information in order to increase the validity of a study
These sources are likely to be stakeholders in a program - participants, other researchers, program staff, other community members, and so on.
Then we put all data in single framework & apply various statistical tools to find out the dynamic on the market.
During the analysis stage, feedback from the stakeholder groups would be compared to determine areas of agreement as well as areas of divergence