

Key Insights
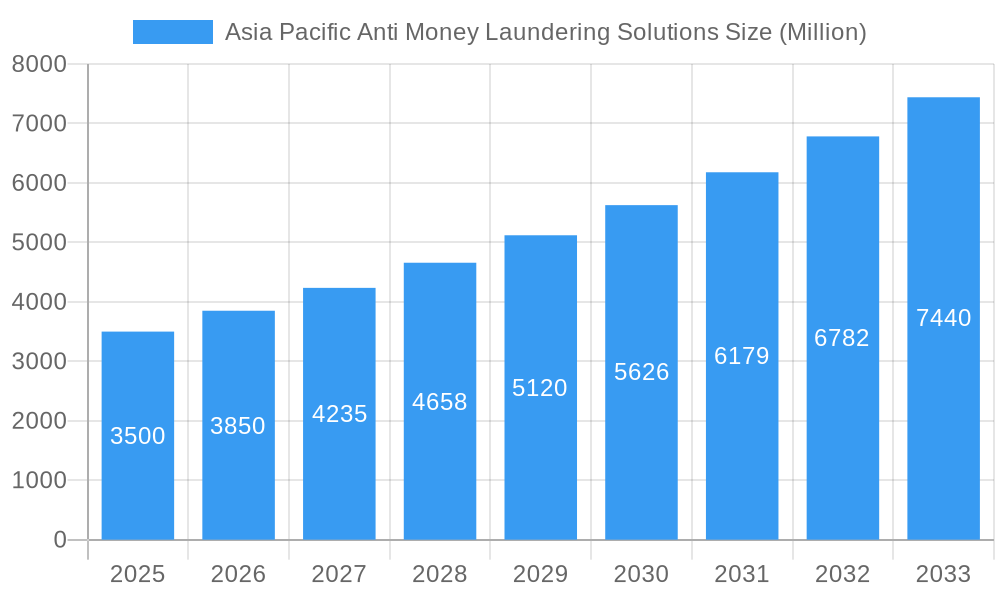
The Asia-Pacific Anti-Money Laundering (AML) solutions market is poised for substantial expansion, driven by escalating financial crime, stringent regulatory compliance, and the rapid digital transformation of financial services across the region. With a projected market size of $4.13 billion in the base year 2025, the market is anticipated to grow at a robust Compound Annual Growth Rate (CAGR) of 17.8% through 2033. Key growth catalysts include the increasing volume of cross-border transactions, the sophistication of financial fraud, and intensified governmental efforts to bolster AML frameworks against money laundering and terrorist financing. The widespread adoption of scalable, cost-effective, and data-rich cloud-based AML solutions further accelerates market penetration. Segments such as Know Your Customer (KYC) and transaction monitoring are experiencing significant demand, underscoring the critical need for real-time risk assessment and fraud prevention. Major economies like China, India, and Japan present substantial market opportunities due to their expansive and dynamic financial sectors. Challenges include the high implementation costs, data privacy considerations, and the complexities of evolving regulatory environments. Despite these obstacles, the outlook for the Asia-Pacific AML solutions market remains highly optimistic, forecasting sustained growth across diverse segments and geographies.
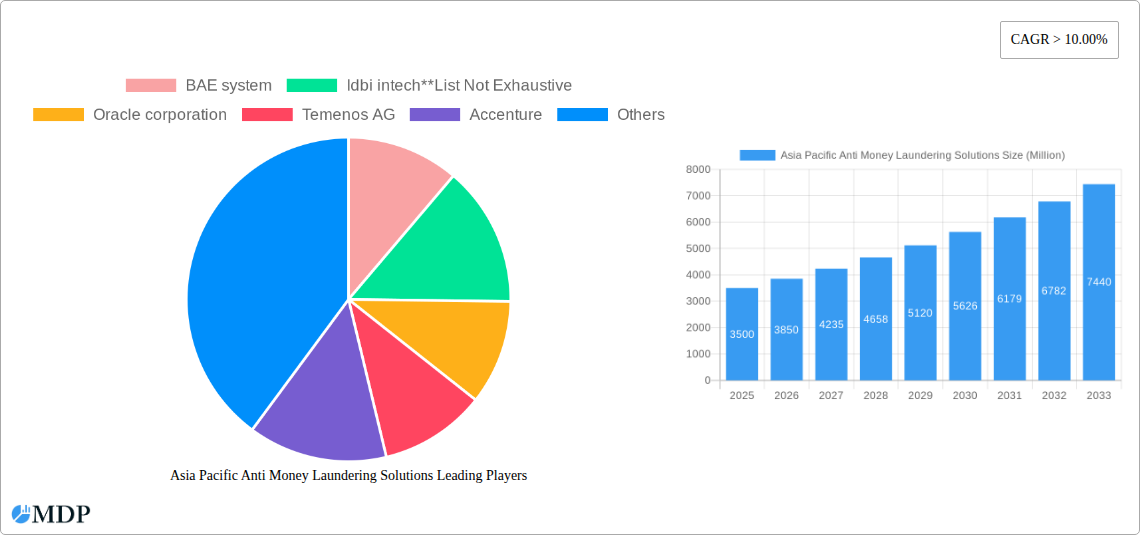
Asia Pacific Anti Money Laundering Solutions Market Size (In Billion)
The competitive landscape features established technology providers, specialized AML solution developers, and consulting firms. Prominent players like BAE Systems, Oracle, Temenos, Accenture, and IBM offer comprehensive AML solutions, integrating software, services, and expert consulting. Niche players address specific needs in areas like transaction monitoring and KYC, serving a broad range of financial institutions and regulated entities. Market growth is further stimulated by strategic alliances, mergers and acquisitions, and the integration of advanced technologies such as Artificial Intelligence (AI) and Machine Learning (ML) for enhanced fraud detection and risk management. The increasing demand for integrated AML solutions that seamlessly interface with existing financial systems will shape future market dynamics. Prioritizing data quality, fostering inter-institutional collaboration, and navigating regulatory complexities will be paramount for sustained market growth and effective financial crime mitigation in the Asia-Pacific region.
Asia Pacific Anti Money Laundering Solutions Company Market Share
Asia Pacific Anti-Money Laundering (AML) Solutions Market Report: 2019-2033
Unlocking Growth Opportunities in a $XX Billion Market
This comprehensive report provides an in-depth analysis of the Asia Pacific Anti-Money Laundering (AML) Solutions market, projecting a robust growth trajectory from 2025 to 2033. The study covers key market segments, leading players, and emerging trends, offering invaluable insights for businesses, investors, and policymakers navigating this critical sector. With a focus on actionable data and strategic analysis spanning the period 2019-2033 (Base Year: 2025, Forecast Period: 2025-2033, Historical Period: 2019-2024), this report is your essential guide to understanding and capitalizing on the opportunities within the Asia Pacific AML solutions landscape. The market is valued at $XX Billion in 2025 and is projected to reach $XX Billion by 2033.
Asia Pacific Anti Money Laundering Solutions Market Dynamics & Concentration
The Asia Pacific AML solutions market exhibits a moderately concentrated landscape, with several multinational corporations and regional players holding significant market share. Market concentration is influenced by factors such as technological innovation, stringent regulatory frameworks, and the increasing adoption of advanced AML solutions. The market share of the top five players is estimated at XX% in 2025. Innovation drivers include advancements in artificial intelligence (AI), machine learning (ML), and big data analytics, enabling more effective detection of suspicious activities. Regulatory frameworks, particularly those implemented by individual countries within the Asia-Pacific region (e.g., China's AML regulations, India's PMLA), significantly impact market growth and technological adoption. Product substitutes, such as manual review processes, are gradually being replaced by automated solutions, fueled by increasing data volumes and the need for efficiency. End-user trends reveal a strong preference for cloud-based solutions, driven by scalability and cost-effectiveness. M&A activities are prevalent, with approximately XX mergers and acquisitions recorded in the last five years, indicating a consolidating market.
Asia Pacific Anti Money Laundering Solutions Industry Trends & Analysis
The Asia Pacific AML solutions market is experiencing robust growth, driven by increasing cross-border transactions, rising cybercrime, and stringent regulatory compliance requirements across various sectors. The Compound Annual Growth Rate (CAGR) is projected to be XX% during the forecast period (2025-2033). This growth is fueled by several key trends:
- Technological Disruptions: AI, ML, and blockchain technology are revolutionizing AML solutions, enabling more accurate and efficient fraud detection.
- Government Initiatives: Increasing government spending on AML infrastructure and regulatory enforcement is boosting market demand.
- Growing Awareness: Heightened awareness of financial crimes and the need for robust AML compliance is driving adoption across various industries.
- Market Penetration: The market penetration rate for AML solutions is expected to reach XX% by 2033, indicating substantial growth potential.
- Competitive Dynamics: Intense competition among vendors is leading to innovation and price optimization, benefiting end-users.
Leading Markets & Segments in Asia Pacific Anti Money Laundering Solutions
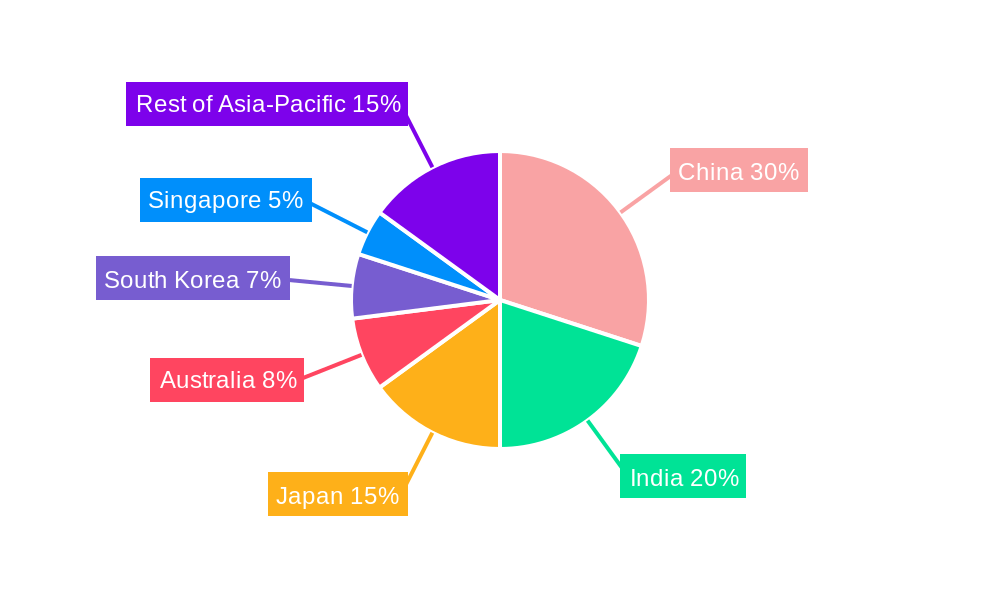
China and India dominate the Asia Pacific AML solutions market, representing a combined XX% market share in 2025. Other significant markets include Australia, Japan, Singapore, and South Korea. The BFSI sector is the largest end-user segment, accounting for XX% of the market.
Key Drivers by Segment:
By Country:
- China: Robust economic growth, expanding financial sector, and stringent regulatory compliance.
- India: Growing digital economy, increasing financial transactions, and government initiatives.
- Australia: Stringent regulatory environment, high adoption of advanced technologies.
- Japan: Well-established financial sector, focus on regulatory compliance.
- Singapore: Regional financial hub, sophisticated AML infrastructure.
- South Korea: Rapid technological advancement, increasing cross-border transactions.
- Rest of Asia-Pacific: Varied levels of AML maturity, increasing demand for basic AML solutions.
By Type: Software solutions hold the largest market share (XX%), followed by services (XX%).
By Deployment: Cloud-based solutions are witnessing rapid adoption (XX%), surpassing on-premise deployments (XX%).
By Solution: Transaction monitoring (XX%) and Know Your Customer (KYC) systems (XX%) dominate the market.
By Industry: BFSI (XX%), followed by Retail (XX%) and Government (XX%).
Asia Pacific Anti Money Laundering Solutions Product Developments
Recent product innovations focus on integrating AI and ML for enhanced fraud detection and real-time transaction monitoring. These solutions offer improved accuracy, reduced false positives, and greater efficiency compared to traditional rule-based systems. Cloud-based deployments provide scalability, cost-effectiveness, and ease of integration with existing systems, strengthening their market fit.
Key Drivers of Asia Pacific Anti Money Laundering Solutions Growth
The growth of the Asia Pacific AML solutions market is primarily driven by:
- Stringent Regulatory Compliance: Governments across the region are implementing stricter AML regulations, driving the adoption of AML solutions.
- Rise in Cybercrime: Increasing cyberattacks and financial fraud necessitate robust AML systems for prevention and detection.
- Technological Advancements: AI, ML, and big data analytics are enabling more effective and efficient AML solutions.
- Growing Cross-Border Transactions: The increase in international trade and financial transactions necessitates enhanced AML compliance.
Challenges in the Asia Pacific Anti Money Laundering Solutions Market
The market faces several challenges, including:
- Data Privacy Concerns: Balancing compliance requirements with data privacy regulations poses a significant challenge.
- High Implementation Costs: The initial investment in AML solutions can be substantial for smaller organizations.
- Integration Complexity: Integrating AML solutions with existing IT infrastructure can be complex and time-consuming.
- Shortage of Skilled Professionals: A lack of professionals with expertise in AML technologies hinders implementation and maintenance.
Emerging Opportunities in Asia Pacific Anti Money Laundering Solutions
Emerging opportunities include the adoption of blockchain technology for enhanced transparency and traceability, the development of specialized AML solutions for specific industries (e.g., fintech), and strategic partnerships between technology providers and financial institutions. Expansion into under-served markets within the Asia Pacific region also presents considerable potential.
Leading Players in the Asia Pacific Anti Money Laundering Solutions Sector
Key Milestones in Asia Pacific Anti Money Laundering Solutions Industry
- 2020: Increased regulatory scrutiny on AML compliance following several high-profile financial scandals.
- 2021: Significant investments in AI and ML-based AML solutions by major technology providers.
- 2022: Several mergers and acquisitions among AML solution providers, leading to market consolidation.
- 2023: Growing adoption of cloud-based AML solutions due to scalability and cost-effectiveness.
- 2024: Launch of several new AML solutions incorporating advanced analytics and blockchain technology.
Strategic Outlook for Asia Pacific Anti Money Laundering Solutions Market
The Asia Pacific AML solutions market is poised for continued growth, driven by robust economic expansion, technological advancements, and increasingly stringent regulatory frameworks. Strategic partnerships, expansion into new markets, and the development of innovative solutions will be crucial for companies seeking to capitalize on this market’s immense potential. Focus on providing customized solutions tailored to the specific needs of various industries will also be key to success.
Asia Pacific Anti Money Laundering Solutions Segmentation
-
1. Type
- 1.1. Software
- 1.2. Services
-
2. Deployment
- 2.1. On-premise
- 2.2. cloud
-
3. Solution
- 3.1. Know your customer systems
- 3.2. Compliance reporting
- 3.3. Transaction monitoring
- 3.4. Auditing & reporting
- 3.5. Other solutions
-
4. Industry
- 4.1. Healthcare
- 4.2. BFSI
- 4.3. Retail
- 4.4. IT & telecom
- 4.5. Government & others
Asia Pacific Anti Money Laundering Solutions Segmentation By Geography
-
1. Asia Pacific
- 1.1. China
- 1.2. Japan
- 1.3. South Korea
- 1.4. India
- 1.5. Australia
- 1.6. New Zealand
- 1.7. Indonesia
- 1.8. Malaysia
- 1.9. Singapore
- 1.10. Thailand
- 1.11. Vietnam
- 1.12. Philippines
Asia Pacific Anti Money Laundering Solutions Regional Market Share
Geographic Coverage of Asia Pacific Anti Money Laundering Solutions
Asia Pacific Anti Money Laundering Solutions REPORT HIGHLIGHTS
| Aspects | Details |
|---|---|
| Study Period | 2020-2034 |
| Base Year | 2025 |
| Estimated Year | 2026 |
| Forecast Period | 2026-2034 |
| Historical Period | 2020-2025 |
| Growth Rate | CAGR of 17.8% from 2020-2034 |
| Segmentation |
|
Table of Contents
- 1. Introduction
- 1.1. Research Scope
- 1.2. Market Segmentation
- 1.3. Research Objective
- 1.4. Definitions and Assumptions
- 2. Executive Summary
- 2.1. Market Snapshot
- 3. Market Dynamics
- 3.1. Market Drivers
- 3.2. Market Restrains
- 3.3. Market Trends
- 3.4. Market Opportunities
- 4. Market Factor Analysis
- 4.1. Porters Five Forces
- 4.1.1. Bargaining Power of Suppliers
- 4.1.2. Bargaining Power of Buyers
- 4.1.3. Threat of New Entrants
- 4.1.4. Threat of Substitutes
- 4.1.5. Competitive Rivalry
- 4.2. PESTEL analysis
- 4.3. BCG Analysis
- 4.3.1. Stars (High Growth, High Market Share)
- 4.3.2. Cash Cows (Low Growth, High Market Share)
- 4.3.3. Question Mark (High Growth, Low Market Share)
- 4.3.4. Dogs (Low Growth, Low Market Share)
- 4.4. Ansoff Matrix Analysis
- 4.5. Supply Chain Analysis
- 4.6. Regulatory Landscape
- 4.7. Current Market Potential and Opportunity Assessment (TAM–SAM–SOM Framework)
- 4.8. MDP Analyst Note
- 4.1. Porters Five Forces
- 5. Market Analysis, Insights and Forecast 2021-2033
- 5.1. Market Analysis, Insights and Forecast - by Type
- 5.1.1. Software
- 5.1.2. Services
- 5.2. Market Analysis, Insights and Forecast - by Deployment
- 5.2.1. On-premise
- 5.2.2. cloud
- 5.3. Market Analysis, Insights and Forecast - by Solution
- 5.3.1. Know your customer systems
- 5.3.2. Compliance reporting
- 5.3.3. Transaction monitoring
- 5.3.4. Auditing & reporting
- 5.3.5. Other solutions
- 5.4. Market Analysis, Insights and Forecast - by Industry
- 5.4.1. Healthcare
- 5.4.2. BFSI
- 5.4.3. Retail
- 5.4.4. IT & telecom
- 5.4.5. Government & others
- 5.5. Market Analysis, Insights and Forecast - by Region
- 5.5.1. Asia Pacific
- 5.1. Market Analysis, Insights and Forecast - by Type
- 6. Asia Pacific Anti Money Laundering Solutions Analysis, Insights and Forecast, 2021-2033
- 6.1. Market Analysis, Insights and Forecast - by Type
- 6.1.1. Software
- 6.1.2. Services
- 6.2. Market Analysis, Insights and Forecast - by Deployment
- 6.2.1. On-premise
- 6.2.2. cloud
- 6.3. Market Analysis, Insights and Forecast - by Solution
- 6.3.1. Know your customer systems
- 6.3.2. Compliance reporting
- 6.3.3. Transaction monitoring
- 6.3.4. Auditing & reporting
- 6.3.5. Other solutions
- 6.4. Market Analysis, Insights and Forecast - by Industry
- 6.4.1. Healthcare
- 6.4.2. BFSI
- 6.4.3. Retail
- 6.4.4. IT & telecom
- 6.4.5. Government & others
- 6.1. Market Analysis, Insights and Forecast - by Type
- 7. Competitive Analysis
- 7.1. Company Profiles
- 7.1.1 BAE system
- 7.1.1.1. Company Overview
- 7.1.1.2. Products
- 7.1.1.3. Company Financials
- 7.1.1.4. SWOT Analysis
- 7.1.2 Idbi intech**List Not Exhaustive
- 7.1.2.1. Company Overview
- 7.1.2.2. Products
- 7.1.2.3. Company Financials
- 7.1.2.4. SWOT Analysis
- 7.1.3 Oracle corporation
- 7.1.3.1. Company Overview
- 7.1.3.2. Products
- 7.1.3.3. Company Financials
- 7.1.3.4. SWOT Analysis
- 7.1.4 Temenos AG
- 7.1.4.1. Company Overview
- 7.1.4.2. Products
- 7.1.4.3. Company Financials
- 7.1.4.4. SWOT Analysis
- 7.1.5 Accenture
- 7.1.5.1. Company Overview
- 7.1.5.2. Products
- 7.1.5.3. Company Financials
- 7.1.5.4. SWOT Analysis
- 7.1.6 Open text corporation
- 7.1.6.1. Company Overview
- 7.1.6.2. Products
- 7.1.6.3. Company Financials
- 7.1.6.4. SWOT Analysis
- 7.1.7 eastnets
- 7.1.7.1. Company Overview
- 7.1.7.2. Products
- 7.1.7.3. Company Financials
- 7.1.7.4. SWOT Analysis
- 7.1.8 ACI worldwide
- 7.1.8.1. Company Overview
- 7.1.8.2. Products
- 7.1.8.3. Company Financials
- 7.1.8.4. SWOT Analysis
- 7.1.9 IBM corporation
- 7.1.9.1. Company Overview
- 7.1.9.2. Products
- 7.1.9.3. Company Financials
- 7.1.9.4. SWOT Analysis
- 7.1.10 SAS Institute
- 7.1.10.1. Company Overview
- 7.1.10.2. Products
- 7.1.10.3. Company Financials
- 7.1.10.4. SWOT Analysis
- 7.1.11 Fiserv
- 7.1.11.1. Company Overview
- 7.1.11.2. Products
- 7.1.11.3. Company Financials
- 7.1.11.4. SWOT Analysis
- 7.1.12 NICE systems
- 7.1.12.1. Company Overview
- 7.1.12.2. Products
- 7.1.12.3. Company Financials
- 7.1.12.4. SWOT Analysis
- 7.1.1 BAE system
- 7.2. Market Entropy
- 7.2.1 Company's Key Areas Served
- 7.2.2 Recent Developments
- 7.3. Company Market Share Analysis 2025
- 7.3.1 Top 5 Companies Market Share Analysis
- 7.3.2 Top 3 Companies Market Share Analysis
- 7.4. List of Potential Customers
- 8. Research Methodology
List of Figures
- Figure 1: Asia Pacific Anti Money Laundering Solutions Revenue Breakdown (billion, %) by Product 2025 & 2033
- Figure 2: Asia Pacific Anti Money Laundering Solutions Share (%) by Company 2025
List of Tables
- Table 1: Asia Pacific Anti Money Laundering Solutions Revenue billion Forecast, by Type 2020 & 2033
- Table 2: Asia Pacific Anti Money Laundering Solutions Revenue billion Forecast, by Deployment 2020 & 2033
- Table 3: Asia Pacific Anti Money Laundering Solutions Revenue billion Forecast, by Solution 2020 & 2033
- Table 4: Asia Pacific Anti Money Laundering Solutions Revenue billion Forecast, by Industry 2020 & 2033
- Table 5: Asia Pacific Anti Money Laundering Solutions Revenue billion Forecast, by Region 2020 & 2033
- Table 6: Asia Pacific Anti Money Laundering Solutions Revenue billion Forecast, by Type 2020 & 2033
- Table 7: Asia Pacific Anti Money Laundering Solutions Revenue billion Forecast, by Deployment 2020 & 2033
- Table 8: Asia Pacific Anti Money Laundering Solutions Revenue billion Forecast, by Solution 2020 & 2033
- Table 9: Asia Pacific Anti Money Laundering Solutions Revenue billion Forecast, by Industry 2020 & 2033
- Table 10: Asia Pacific Anti Money Laundering Solutions Revenue billion Forecast, by Country 2020 & 2033
- Table 11: China Asia Pacific Anti Money Laundering Solutions Revenue (billion) Forecast, by Application 2020 & 2033
- Table 12: Japan Asia Pacific Anti Money Laundering Solutions Revenue (billion) Forecast, by Application 2020 & 2033
- Table 13: South Korea Asia Pacific Anti Money Laundering Solutions Revenue (billion) Forecast, by Application 2020 & 2033
- Table 14: India Asia Pacific Anti Money Laundering Solutions Revenue (billion) Forecast, by Application 2020 & 2033
- Table 15: Australia Asia Pacific Anti Money Laundering Solutions Revenue (billion) Forecast, by Application 2020 & 2033
- Table 16: New Zealand Asia Pacific Anti Money Laundering Solutions Revenue (billion) Forecast, by Application 2020 & 2033
- Table 17: Indonesia Asia Pacific Anti Money Laundering Solutions Revenue (billion) Forecast, by Application 2020 & 2033
- Table 18: Malaysia Asia Pacific Anti Money Laundering Solutions Revenue (billion) Forecast, by Application 2020 & 2033
- Table 19: Singapore Asia Pacific Anti Money Laundering Solutions Revenue (billion) Forecast, by Application 2020 & 2033
- Table 20: Thailand Asia Pacific Anti Money Laundering Solutions Revenue (billion) Forecast, by Application 2020 & 2033
- Table 21: Vietnam Asia Pacific Anti Money Laundering Solutions Revenue (billion) Forecast, by Application 2020 & 2033
- Table 22: Philippines Asia Pacific Anti Money Laundering Solutions Revenue (billion) Forecast, by Application 2020 & 2033
Frequently Asked Questions
1. What is the projected Compound Annual Growth Rate (CAGR) of the Asia Pacific Anti Money Laundering Solutions?
The projected CAGR is approximately 17.8%.
2. Which companies are prominent players in the Asia Pacific Anti Money Laundering Solutions?
Key companies in the market include BAE system, Idbi intech**List Not Exhaustive, Oracle corporation, Temenos AG, Accenture, Open text corporation, eastnets, ACI worldwide, IBM corporation, SAS Institute, Fiserv, NICE systems.
3. What are the main segments of the Asia Pacific Anti Money Laundering Solutions?
The market segments include Type, Deployment, Solution, Industry.
4. Can you provide details about the market size?
The market size is estimated to be USD 4.13 billion as of 2022.
5. What are some drivers contributing to market growth?
Embedded Insurance is Driving the Market.
6. What are the notable trends driving market growth?
Rise in the Volume of Wired Transactions Driving the Market.
7. Are there any restraints impacting market growth?
Inflation is Restraining the Property and Casualty Insurance Market of Singapore.
8. Can you provide examples of recent developments in the market?
N/A
9. What pricing options are available for accessing the report?
Pricing options include single-user, multi-user, and enterprise licenses priced at USD 3800, USD 4500, and USD 5800 respectively.
10. Is the market size provided in terms of value or volume?
The market size is provided in terms of value, measured in billion.
11. Are there any specific market keywords associated with the report?
Yes, the market keyword associated with the report is "Asia Pacific Anti Money Laundering Solutions," which aids in identifying and referencing the specific market segment covered.
12. How do I determine which pricing option suits my needs best?
The pricing options vary based on user requirements and access needs. Individual users may opt for single-user licenses, while businesses requiring broader access may choose multi-user or enterprise licenses for cost-effective access to the report.
13. Are there any additional resources or data provided in the Asia Pacific Anti Money Laundering Solutions report?
While the report offers comprehensive insights, it's advisable to review the specific contents or supplementary materials provided to ascertain if additional resources or data are available.
14. How can I stay updated on further developments or reports in the Asia Pacific Anti Money Laundering Solutions?
To stay informed about further developments, trends, and reports in the Asia Pacific Anti Money Laundering Solutions, consider subscribing to industry newsletters, following relevant companies and organizations, or regularly checking reputable industry news sources and publications.
Methodology
Step 1 - Identification of Relevant Samples Size from Population Database


Step 2 - Approaches for Defining Global Market Size (Value, Volume* & Price*)

Note*: In applicable scenarios
Step 3 - Data Sources
Primary Research
- Web Analytics
- Survey Reports
- Research Institute
- Latest Research Reports
- Opinion Leaders
Secondary Research
- Annual Reports
- White Paper
- Latest Press Release
- Industry Association
- Paid Database
- Investor Presentations

Step 4 - Data Triangulation
Involves using different sources of information in order to increase the validity of a study
These sources are likely to be stakeholders in a program - participants, other researchers, program staff, other community members, and so on.
Then we put all data in single framework & apply various statistical tools to find out the dynamic on the market.
During the analysis stage, feedback from the stakeholder groups would be compared to determine areas of agreement as well as areas of divergence