

Key Insights
The global Artificial Intelligence (AI) market is forecast for substantial expansion, projected to reach $390.91 billion by 2025. This growth trajectory is underpinned by widespread adoption across critical sectors including healthcare, finance, and manufacturing. A significant Compound Annual Growth Rate (CAGR) of 30.6% is anticipated, indicating a robust market evolution. This surge is propelled by advancements in deep learning and machine learning, the increasing availability of big data, and amplified global investments in AI research and development. The growing demand for automation, personalized user experiences, and enhanced operational efficiency across industries further bolsters this market's upward trend.
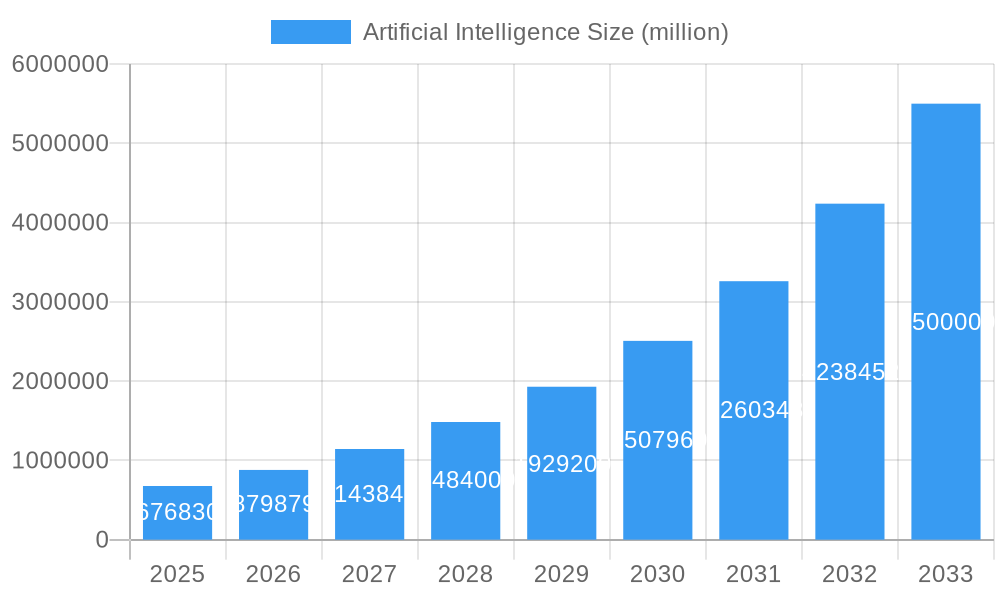
Artificial Intelligence Market Size (In Billion)
While opportunities abound, potential restraints include data privacy concerns and ethical considerations, necessitating stringent regulatory frameworks and responsible AI implementation. The substantial costs associated with AI deployment and the scarcity of specialized talent also present challenges. Nevertheless, the market's outlook remains exceedingly positive, segmented by diverse applications such as computer vision and natural language processing, and by key geographic regions. Leading technology companies and emerging startups are actively driving innovation and forging strategic alliances, creating a dynamic and competitive landscape that will continue to fuel AI market growth.
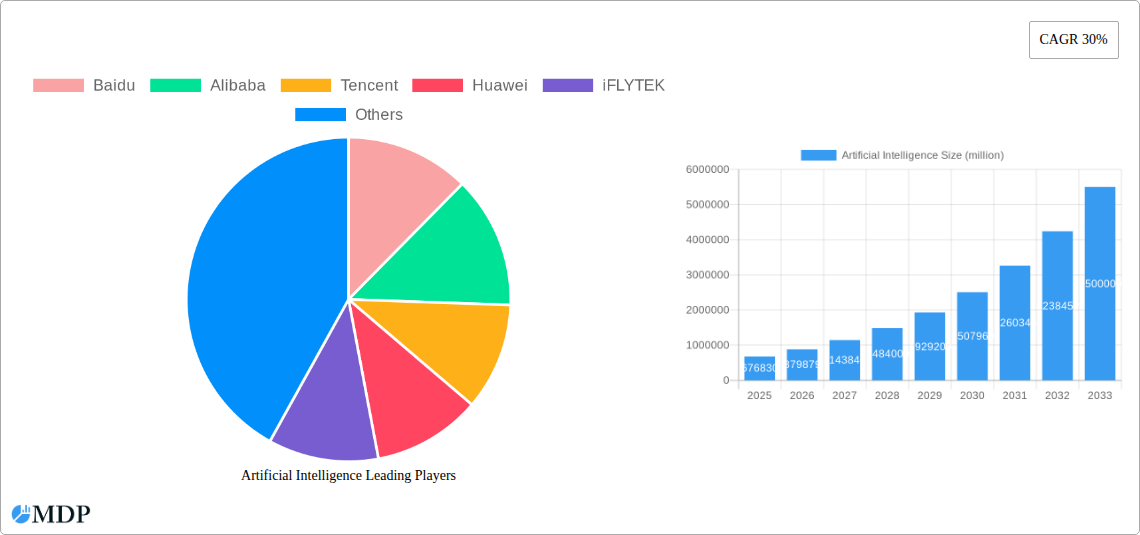
Artificial Intelligence Company Market Share
Unlock the Trillion-Dollar Potential: The Definitive Artificial Intelligence Market Report (2019-2033)
This comprehensive report provides an in-depth analysis of the Artificial Intelligence (AI) market, projecting a market value exceeding $xx trillion by 2033. Covering the period from 2019 to 2033, with a base year of 2025 and a forecast period of 2025-2033, this report is an essential resource for investors, industry stakeholders, and technology enthusiasts alike. Leveraging data from the historical period (2019-2024), this study delivers actionable insights and forecasts for navigating the rapidly evolving AI landscape.
Artificial Intelligence Market Dynamics & Concentration
The global AI market, currently valued at $xx trillion (2025), is experiencing rapid growth fueled by technological advancements and increasing adoption across various sectors. Market concentration is high, with a few major players holding significant shares. However, the landscape is dynamic, characterized by continuous innovation, strategic mergers and acquisitions (M&A), and evolving regulatory frameworks. The following factors significantly influence market dynamics:
- Market Share: While precise figures for individual companies require proprietary data, leading players such as Baidu, Alibaba, Tencent, and Huawei are anticipated to hold significant market shares (xx%, xx%, xx%, xx% respectively, estimated for 2025). Smaller players such as SenseTime, Megvii, and Yitu Technology contribute to a competitive landscape within specific segments.
- Innovation Drivers: Continuous research and development in deep learning, natural language processing (NLP), and computer vision are key drivers. The rise of generative AI and large language models (LLMs) has significantly impacted market dynamics.
- Regulatory Frameworks: Government regulations concerning data privacy, AI ethics, and algorithmic transparency are impacting market development, particularly in regions like Europe and North America.
- Product Substitutes: While true substitutes are limited, alternative solutions like traditional rule-based systems offer competition in specific niche areas.
- End-User Trends: The increasing demand for AI-powered solutions across various industries, from healthcare to finance, fuels market growth.
- M&A Activities: The AI market has witnessed a significant number of mergers and acquisitions (M&A) deals in recent years (xx deals estimated for 2019-2024) aiming for strategic partnerships, technological expansion, and market consolidation.
Artificial Intelligence Industry Trends & Analysis
The AI market exhibits a Compound Annual Growth Rate (CAGR) of xx% during the forecast period (2025-2033). This robust growth is driven by several key factors:
- Market Growth Drivers: The increasing availability of vast datasets, advancements in computing power (particularly GPUs and specialized AI chips), and the decreasing cost of AI development are primary drivers. The growing adoption of cloud-based AI services also contributes significantly.
- Technological Disruptions: The emergence of transformative technologies like generative AI and large language models is significantly disrupting existing market dynamics, creating new opportunities and requiring continuous adaptation.
- Consumer Preferences: Consumers are increasingly embracing AI-powered solutions in their daily lives, from smart assistants to personalized recommendations, driving demand for AI-integrated products and services.
- Competitive Dynamics: The AI market is highly competitive, with established tech giants and emerging startups vying for market share. This competition drives innovation and accelerates technological advancements, benefiting consumers and businesses. Market penetration is projected to reach xx% by 2033.
Leading Markets & Segments in Artificial Intelligence
North America currently dominates the global AI market, driven by robust technological advancements, substantial R&D investments, and a high adoption rate across various sectors. China is rapidly catching up, fueled by substantial government support and a thriving tech industry.
Key Drivers of North American Dominance:
- Strong R&D ecosystem: Significant investments in AI research from both the public and private sectors.
- Abundant data availability: Large volumes of data from diverse sources fuel AI model training.
- Established tech infrastructure: Well-developed computing infrastructure and cloud services facilitate AI development.
- Favorable regulatory environment (relatively): While evolving, regulations are generally considered less restrictive compared to some other regions.
Key Drivers of China's Growth:
- Government support: Significant national investment and strategic policies promote AI development.
- Large domestic market: Massive consumer base provides ample opportunities for AI applications.
- Growing talent pool: A large and rapidly growing number of skilled AI professionals.
Artificial Intelligence Product Developments
The AI market is witnessing rapid product innovation, with a focus on developing more sophisticated and user-friendly applications. This includes advancements in natural language processing (NLP), computer vision, machine learning (ML), and deep learning (DL). New applications are constantly emerging in diverse sectors, offering significant competitive advantages to companies adopting AI technologies. The focus is shifting towards edge AI, which brings AI processing closer to data sources, improving real-time capabilities and reducing latency.
Key Drivers of Artificial Intelligence Growth
Several factors contribute to the exponential growth of the AI market:
- Technological advancements: Continual progress in deep learning, NLP, and computer vision leads to more powerful and versatile AI applications.
- Economic benefits: AI offers significant productivity gains and cost reductions across various industries, driving adoption.
- Supportive government policies: Many governments are actively promoting AI development through funding, research initiatives, and regulatory frameworks. Examples include the EU's AI Act and various national AI strategies globally.
Challenges in the Artificial Intelligence Market
Despite the enormous potential, the AI market faces several significant hurdles:
- Regulatory hurdles: Data privacy concerns and ethical considerations create regulatory challenges, particularly regarding algorithmic bias and transparency. This leads to increased development and compliance costs (estimated at $xx million annually for the industry).
- Supply chain issues: The demand for specialized hardware, such as GPUs and AI chips, is exceeding supply, leading to potential bottlenecks.
- Competitive pressures: The intensely competitive market leads to pressure on pricing and profit margins.
Emerging Opportunities in Artificial Intelligence
Significant opportunities for long-term growth exist, driven by several factors:
The convergence of AI with other transformative technologies like the Internet of Things (IoT), blockchain, and quantum computing promises to create entirely new possibilities. Strategic partnerships between established tech giants and innovative startups will fuel further growth. Expanding AI applications into emerging markets represents a huge untapped potential for future expansion.
Key Milestones in Artificial Intelligence Industry
- 2012: AlexNet's victory in the ImageNet competition marks a breakthrough in deep learning.
- 2016: AlphaGo defeats a world champion Go player, demonstrating the power of AI in complex games.
- 2018: Large language models like BERT achieve significant advancements in natural language understanding.
- 2022: Generative AI models like DALL-E 2 and Stable Diffusion demonstrate remarkable capabilities in image generation and text-to-image synthesis.
- 2023: The widespread adoption of LLMs marks the start of a new era in AI accessibility and application. (Specific dates for other events need to be added based on your research).
Strategic Outlook for Artificial Intelligence Market
The future of the AI market is bright, driven by ongoing technological advancements and increasing industry adoption. Strategic investments in AI research, development, and talent acquisition will be crucial for success. Companies must focus on building robust and ethical AI systems that address societal needs while minimizing potential risks. The market's trajectory points towards a future where AI permeates nearly every aspect of our lives, transforming industries and shaping society in unprecedented ways.
Artificial Intelligence Segmentation
-
1. Application
- 1.1. Healthcare
- 1.2. Financial Services
- 1.3. Retail
- 1.4. Manufacturing
- 1.5. Automotive
- 1.6. Others
-
2. Type
- 2.1. Machine Learning and Deep Learning
- 2.2. Natural Language Processing (NLP)
- 2.3. Computer Vision
Artificial Intelligence Segmentation By Geography
-
1. North America
- 1.1. United States
- 1.2. Canada
- 1.3. Mexico
-
2. South America
- 2.1. Brazil
- 2.2. Argentina
- 2.3. Rest of South America
-
3. Europe
- 3.1. United Kingdom
- 3.2. Germany
- 3.3. France
- 3.4. Italy
- 3.5. Spain
- 3.6. Russia
- 3.7. Benelux
- 3.8. Nordics
- 3.9. Rest of Europe
-
4. Middle East & Africa
- 4.1. Turkey
- 4.2. Israel
- 4.3. GCC
- 4.4. North Africa
- 4.5. South Africa
- 4.6. Rest of Middle East & Africa
-
5. Asia Pacific
- 5.1. China
- 5.2. India
- 5.3. Japan
- 5.4. South Korea
- 5.5. ASEAN
- 5.6. Oceania
- 5.7. Rest of Asia Pacific
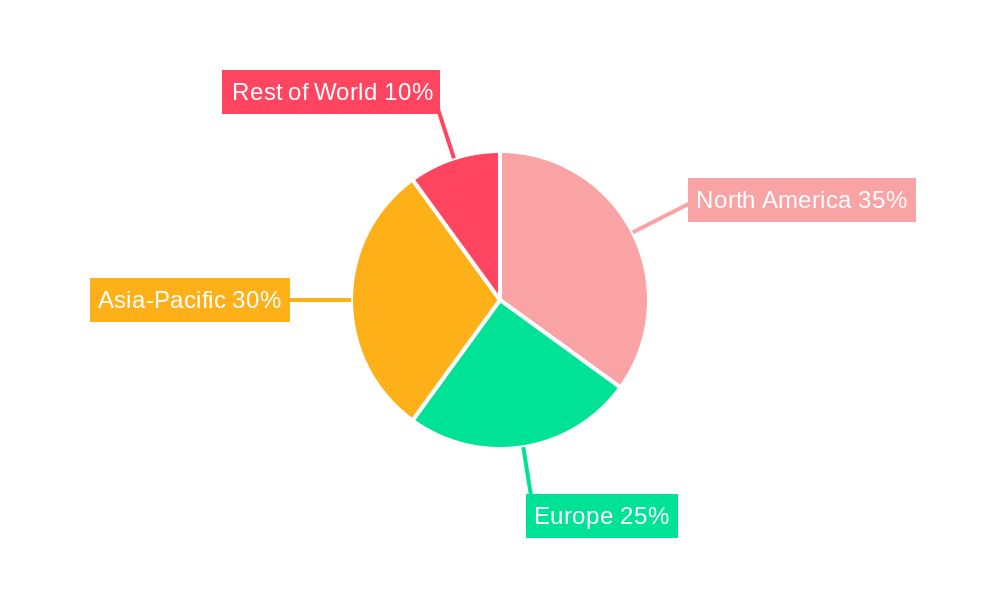
Artificial Intelligence Regional Market Share
Geographic Coverage of Artificial Intelligence
Artificial Intelligence REPORT HIGHLIGHTS
| Aspects | Details |
|---|---|
| Study Period | 2020-2034 |
| Base Year | 2025 |
| Estimated Year | 2026 |
| Forecast Period | 2026-2034 |
| Historical Period | 2020-2025 |
| Growth Rate | CAGR of 30.6% from 2020-2034 |
| Segmentation |
|
Table of Contents
- 1. Introduction
- 1.1. Research Scope
- 1.2. Market Segmentation
- 1.3. Research Objective
- 1.4. Definitions and Assumptions
- 2. Executive Summary
- 2.1. Market Snapshot
- 3. Market Dynamics
- 3.1. Market Drivers
- 3.2. Market Restrains
- 3.3. Market Trends
- 3.4. Market Opportunities
- 4. Market Factor Analysis
- 4.1. Porters Five Forces
- 4.1.1. Bargaining Power of Suppliers
- 4.1.2. Bargaining Power of Buyers
- 4.1.3. Threat of New Entrants
- 4.1.4. Threat of Substitutes
- 4.1.5. Competitive Rivalry
- 4.2. PESTEL analysis
- 4.3. BCG Analysis
- 4.3.1. Stars (High Growth, High Market Share)
- 4.3.2. Cash Cows (Low Growth, High Market Share)
- 4.3.3. Question Mark (High Growth, Low Market Share)
- 4.3.4. Dogs (Low Growth, Low Market Share)
- 4.4. Ansoff Matrix Analysis
- 4.5. Supply Chain Analysis
- 4.6. Regulatory Landscape
- 4.7. Current Market Potential and Opportunity Assessment (TAM–SAM–SOM Framework)
- 4.8. MDP Analyst Note
- 4.1. Porters Five Forces
- 5. Market Analysis, Insights and Forecast 2021-2033
- 5.1. Market Analysis, Insights and Forecast - by Application
- 5.1.1. Healthcare
- 5.1.2. Financial Services
- 5.1.3. Retail
- 5.1.4. Manufacturing
- 5.1.5. Automotive
- 5.1.6. Others
- 5.2. Market Analysis, Insights and Forecast - by Type
- 5.2.1. Machine Learning and Deep Learning
- 5.2.2. Natural Language Processing (NLP)
- 5.2.3. Computer Vision
- 5.3. Market Analysis, Insights and Forecast - by Region
- 5.3.1. North America
- 5.3.2. South America
- 5.3.3. Europe
- 5.3.4. Middle East & Africa
- 5.3.5. Asia Pacific
- 5.1. Market Analysis, Insights and Forecast - by Application
- 6. Global Artificial Intelligence Analysis, Insights and Forecast, 2021-2033
- 6.1. Market Analysis, Insights and Forecast - by Application
- 6.1.1. Healthcare
- 6.1.2. Financial Services
- 6.1.3. Retail
- 6.1.4. Manufacturing
- 6.1.5. Automotive
- 6.1.6. Others
- 6.2. Market Analysis, Insights and Forecast - by Type
- 6.2.1. Machine Learning and Deep Learning
- 6.2.2. Natural Language Processing (NLP)
- 6.2.3. Computer Vision
- 6.1. Market Analysis, Insights and Forecast - by Application
- 7. North America Artificial Intelligence Analysis, Insights and Forecast, 2020-2032
- 7.1. Market Analysis, Insights and Forecast - by Application
- 7.1.1. Healthcare
- 7.1.2. Financial Services
- 7.1.3. Retail
- 7.1.4. Manufacturing
- 7.1.5. Automotive
- 7.1.6. Others
- 7.2. Market Analysis, Insights and Forecast - by Type
- 7.2.1. Machine Learning and Deep Learning
- 7.2.2. Natural Language Processing (NLP)
- 7.2.3. Computer Vision
- 7.1. Market Analysis, Insights and Forecast - by Application
- 8. South America Artificial Intelligence Analysis, Insights and Forecast, 2020-2032
- 8.1. Market Analysis, Insights and Forecast - by Application
- 8.1.1. Healthcare
- 8.1.2. Financial Services
- 8.1.3. Retail
- 8.1.4. Manufacturing
- 8.1.5. Automotive
- 8.1.6. Others
- 8.2. Market Analysis, Insights and Forecast - by Type
- 8.2.1. Machine Learning and Deep Learning
- 8.2.2. Natural Language Processing (NLP)
- 8.2.3. Computer Vision
- 8.1. Market Analysis, Insights and Forecast - by Application
- 9. Europe Artificial Intelligence Analysis, Insights and Forecast, 2020-2032
- 9.1. Market Analysis, Insights and Forecast - by Application
- 9.1.1. Healthcare
- 9.1.2. Financial Services
- 9.1.3. Retail
- 9.1.4. Manufacturing
- 9.1.5. Automotive
- 9.1.6. Others
- 9.2. Market Analysis, Insights and Forecast - by Type
- 9.2.1. Machine Learning and Deep Learning
- 9.2.2. Natural Language Processing (NLP)
- 9.2.3. Computer Vision
- 9.1. Market Analysis, Insights and Forecast - by Application
- 10. Middle East & Africa Artificial Intelligence Analysis, Insights and Forecast, 2020-2032
- 10.1. Market Analysis, Insights and Forecast - by Application
- 10.1.1. Healthcare
- 10.1.2. Financial Services
- 10.1.3. Retail
- 10.1.4. Manufacturing
- 10.1.5. Automotive
- 10.1.6. Others
- 10.2. Market Analysis, Insights and Forecast - by Type
- 10.2.1. Machine Learning and Deep Learning
- 10.2.2. Natural Language Processing (NLP)
- 10.2.3. Computer Vision
- 10.1. Market Analysis, Insights and Forecast - by Application
- 11. Asia Pacific Artificial Intelligence Analysis, Insights and Forecast, 2020-2032
- 11.1. Market Analysis, Insights and Forecast - by Application
- 11.1.1. Healthcare
- 11.1.2. Financial Services
- 11.1.3. Retail
- 11.1.4. Manufacturing
- 11.1.5. Automotive
- 11.1.6. Others
- 11.2. Market Analysis, Insights and Forecast - by Type
- 11.2.1. Machine Learning and Deep Learning
- 11.2.2. Natural Language Processing (NLP)
- 11.2.3. Computer Vision
- 11.1. Market Analysis, Insights and Forecast - by Application
- 12. Competitive Analysis
- 12.1. Company Profiles
- 12.1.1 Baidu
- 12.1.1.1. Company Overview
- 12.1.1.2. Products
- 12.1.1.3. Company Financials
- 12.1.1.4. SWOT Analysis
- 12.1.2 Alibaba
- 12.1.2.1. Company Overview
- 12.1.2.2. Products
- 12.1.2.3. Company Financials
- 12.1.2.4. SWOT Analysis
- 12.1.3 Tencent
- 12.1.3.1. Company Overview
- 12.1.3.2. Products
- 12.1.3.3. Company Financials
- 12.1.3.4. SWOT Analysis
- 12.1.4 Huawei
- 12.1.4.1. Company Overview
- 12.1.4.2. Products
- 12.1.4.3. Company Financials
- 12.1.4.4. SWOT Analysis
- 12.1.5 iFLYTEK
- 12.1.5.1. Company Overview
- 12.1.5.2. Products
- 12.1.5.3. Company Financials
- 12.1.5.4. SWOT Analysis
- 12.1.6 SenseTime
- 12.1.6.1. Company Overview
- 12.1.6.2. Products
- 12.1.6.3. Company Financials
- 12.1.6.4. SWOT Analysis
- 12.1.7 Megvii
- 12.1.7.1. Company Overview
- 12.1.7.2. Products
- 12.1.7.3. Company Financials
- 12.1.7.4. SWOT Analysis
- 12.1.8 Yitu Technology
- 12.1.8.1. Company Overview
- 12.1.8.2. Products
- 12.1.8.3. Company Financials
- 12.1.8.4. SWOT Analysis
- 12.1.9 NVIDIA
- 12.1.9.1. Company Overview
- 12.1.9.2. Products
- 12.1.9.3. Company Financials
- 12.1.9.4. SWOT Analysis
- 12.1.10 Microsoft
- 12.1.10.1. Company Overview
- 12.1.10.2. Products
- 12.1.10.3. Company Financials
- 12.1.10.4. SWOT Analysis
- 12.1.11 Google
- 12.1.11.1. Company Overview
- 12.1.11.2. Products
- 12.1.11.3. Company Financials
- 12.1.11.4. SWOT Analysis
- 12.1.12 IBM
- 12.1.12.1. Company Overview
- 12.1.12.2. Products
- 12.1.12.3. Company Financials
- 12.1.12.4. SWOT Analysis
- 12.1.13 Amazon
- 12.1.13.1. Company Overview
- 12.1.13.2. Products
- 12.1.13.3. Company Financials
- 12.1.13.4. SWOT Analysis
- 12.1.14 OpenAI
- 12.1.14.1. Company Overview
- 12.1.14.2. Products
- 12.1.14.3. Company Financials
- 12.1.14.4. SWOT Analysis
- 12.1.15 Intel
- 12.1.15.1. Company Overview
- 12.1.15.2. Products
- 12.1.15.3. Company Financials
- 12.1.15.4. SWOT Analysis
- 12.1.16 SAP
- 12.1.16.1. Company Overview
- 12.1.16.2. Products
- 12.1.16.3. Company Financials
- 12.1.16.4. SWOT Analysis
- 12.1.17 Salesforce
- 12.1.17.1. Company Overview
- 12.1.17.2. Products
- 12.1.17.3. Company Financials
- 12.1.17.4. SWOT Analysis
- 12.1.18 Brighterion
- 12.1.18.1. Company Overview
- 12.1.18.2. Products
- 12.1.18.3. Company Financials
- 12.1.18.4. SWOT Analysis
- 12.1.19 KITT.AI
- 12.1.19.1. Company Overview
- 12.1.19.2. Products
- 12.1.19.3. Company Financials
- 12.1.19.4. SWOT Analysis
- 12.1.20 Megvii Technology
- 12.1.20.1. Company Overview
- 12.1.20.2. Products
- 12.1.20.3. Company Financials
- 12.1.20.4. SWOT Analysis
- 12.1.21 Albert Technologies
- 12.1.21.1. Company Overview
- 12.1.21.2. Products
- 12.1.21.3. Company Financials
- 12.1.21.4. SWOT Analysis
- 12.1.22 Brainasoft
- 12.1.22.1. Company Overview
- 12.1.22.2. Products
- 12.1.22.3. Company Financials
- 12.1.22.4. SWOT Analysis
- 12.1.1 Baidu
- 12.2. Market Entropy
- 12.2.1 Company's Key Areas Served
- 12.2.2 Recent Developments
- 12.3. Company Market Share Analysis 2025
- 12.3.1 Top 5 Companies Market Share Analysis
- 12.3.2 Top 3 Companies Market Share Analysis
- 12.4. List of Potential Customers
- 13. Research Methodology
List of Figures
- Figure 1: Global Artificial Intelligence Revenue Breakdown (billion, %) by Region 2025 & 2033
- Figure 2: North America Artificial Intelligence Revenue (billion), by Application 2025 & 2033
- Figure 3: North America Artificial Intelligence Revenue Share (%), by Application 2025 & 2033
- Figure 4: North America Artificial Intelligence Revenue (billion), by Type 2025 & 2033
- Figure 5: North America Artificial Intelligence Revenue Share (%), by Type 2025 & 2033
- Figure 6: North America Artificial Intelligence Revenue (billion), by Country 2025 & 2033
- Figure 7: North America Artificial Intelligence Revenue Share (%), by Country 2025 & 2033
- Figure 8: South America Artificial Intelligence Revenue (billion), by Application 2025 & 2033
- Figure 9: South America Artificial Intelligence Revenue Share (%), by Application 2025 & 2033
- Figure 10: South America Artificial Intelligence Revenue (billion), by Type 2025 & 2033
- Figure 11: South America Artificial Intelligence Revenue Share (%), by Type 2025 & 2033
- Figure 12: South America Artificial Intelligence Revenue (billion), by Country 2025 & 2033
- Figure 13: South America Artificial Intelligence Revenue Share (%), by Country 2025 & 2033
- Figure 14: Europe Artificial Intelligence Revenue (billion), by Application 2025 & 2033
- Figure 15: Europe Artificial Intelligence Revenue Share (%), by Application 2025 & 2033
- Figure 16: Europe Artificial Intelligence Revenue (billion), by Type 2025 & 2033
- Figure 17: Europe Artificial Intelligence Revenue Share (%), by Type 2025 & 2033
- Figure 18: Europe Artificial Intelligence Revenue (billion), by Country 2025 & 2033
- Figure 19: Europe Artificial Intelligence Revenue Share (%), by Country 2025 & 2033
- Figure 20: Middle East & Africa Artificial Intelligence Revenue (billion), by Application 2025 & 2033
- Figure 21: Middle East & Africa Artificial Intelligence Revenue Share (%), by Application 2025 & 2033
- Figure 22: Middle East & Africa Artificial Intelligence Revenue (billion), by Type 2025 & 2033
- Figure 23: Middle East & Africa Artificial Intelligence Revenue Share (%), by Type 2025 & 2033
- Figure 24: Middle East & Africa Artificial Intelligence Revenue (billion), by Country 2025 & 2033
- Figure 25: Middle East & Africa Artificial Intelligence Revenue Share (%), by Country 2025 & 2033
- Figure 26: Asia Pacific Artificial Intelligence Revenue (billion), by Application 2025 & 2033
- Figure 27: Asia Pacific Artificial Intelligence Revenue Share (%), by Application 2025 & 2033
- Figure 28: Asia Pacific Artificial Intelligence Revenue (billion), by Type 2025 & 2033
- Figure 29: Asia Pacific Artificial Intelligence Revenue Share (%), by Type 2025 & 2033
- Figure 30: Asia Pacific Artificial Intelligence Revenue (billion), by Country 2025 & 2033
- Figure 31: Asia Pacific Artificial Intelligence Revenue Share (%), by Country 2025 & 2033
List of Tables
- Table 1: Global Artificial Intelligence Revenue billion Forecast, by Application 2020 & 2033
- Table 2: Global Artificial Intelligence Revenue billion Forecast, by Type 2020 & 2033
- Table 3: Global Artificial Intelligence Revenue billion Forecast, by Region 2020 & 2033
- Table 4: Global Artificial Intelligence Revenue billion Forecast, by Application 2020 & 2033
- Table 5: Global Artificial Intelligence Revenue billion Forecast, by Type 2020 & 2033
- Table 6: Global Artificial Intelligence Revenue billion Forecast, by Country 2020 & 2033
- Table 7: United States Artificial Intelligence Revenue (billion) Forecast, by Application 2020 & 2033
- Table 8: Canada Artificial Intelligence Revenue (billion) Forecast, by Application 2020 & 2033
- Table 9: Mexico Artificial Intelligence Revenue (billion) Forecast, by Application 2020 & 2033
- Table 10: Global Artificial Intelligence Revenue billion Forecast, by Application 2020 & 2033
- Table 11: Global Artificial Intelligence Revenue billion Forecast, by Type 2020 & 2033
- Table 12: Global Artificial Intelligence Revenue billion Forecast, by Country 2020 & 2033
- Table 13: Brazil Artificial Intelligence Revenue (billion) Forecast, by Application 2020 & 2033
- Table 14: Argentina Artificial Intelligence Revenue (billion) Forecast, by Application 2020 & 2033
- Table 15: Rest of South America Artificial Intelligence Revenue (billion) Forecast, by Application 2020 & 2033
- Table 16: Global Artificial Intelligence Revenue billion Forecast, by Application 2020 & 2033
- Table 17: Global Artificial Intelligence Revenue billion Forecast, by Type 2020 & 2033
- Table 18: Global Artificial Intelligence Revenue billion Forecast, by Country 2020 & 2033
- Table 19: United Kingdom Artificial Intelligence Revenue (billion) Forecast, by Application 2020 & 2033
- Table 20: Germany Artificial Intelligence Revenue (billion) Forecast, by Application 2020 & 2033
- Table 21: France Artificial Intelligence Revenue (billion) Forecast, by Application 2020 & 2033
- Table 22: Italy Artificial Intelligence Revenue (billion) Forecast, by Application 2020 & 2033
- Table 23: Spain Artificial Intelligence Revenue (billion) Forecast, by Application 2020 & 2033
- Table 24: Russia Artificial Intelligence Revenue (billion) Forecast, by Application 2020 & 2033
- Table 25: Benelux Artificial Intelligence Revenue (billion) Forecast, by Application 2020 & 2033
- Table 26: Nordics Artificial Intelligence Revenue (billion) Forecast, by Application 2020 & 2033
- Table 27: Rest of Europe Artificial Intelligence Revenue (billion) Forecast, by Application 2020 & 2033
- Table 28: Global Artificial Intelligence Revenue billion Forecast, by Application 2020 & 2033
- Table 29: Global Artificial Intelligence Revenue billion Forecast, by Type 2020 & 2033
- Table 30: Global Artificial Intelligence Revenue billion Forecast, by Country 2020 & 2033
- Table 31: Turkey Artificial Intelligence Revenue (billion) Forecast, by Application 2020 & 2033
- Table 32: Israel Artificial Intelligence Revenue (billion) Forecast, by Application 2020 & 2033
- Table 33: GCC Artificial Intelligence Revenue (billion) Forecast, by Application 2020 & 2033
- Table 34: North Africa Artificial Intelligence Revenue (billion) Forecast, by Application 2020 & 2033
- Table 35: South Africa Artificial Intelligence Revenue (billion) Forecast, by Application 2020 & 2033
- Table 36: Rest of Middle East & Africa Artificial Intelligence Revenue (billion) Forecast, by Application 2020 & 2033
- Table 37: Global Artificial Intelligence Revenue billion Forecast, by Application 2020 & 2033
- Table 38: Global Artificial Intelligence Revenue billion Forecast, by Type 2020 & 2033
- Table 39: Global Artificial Intelligence Revenue billion Forecast, by Country 2020 & 2033
- Table 40: China Artificial Intelligence Revenue (billion) Forecast, by Application 2020 & 2033
- Table 41: India Artificial Intelligence Revenue (billion) Forecast, by Application 2020 & 2033
- Table 42: Japan Artificial Intelligence Revenue (billion) Forecast, by Application 2020 & 2033
- Table 43: South Korea Artificial Intelligence Revenue (billion) Forecast, by Application 2020 & 2033
- Table 44: ASEAN Artificial Intelligence Revenue (billion) Forecast, by Application 2020 & 2033
- Table 45: Oceania Artificial Intelligence Revenue (billion) Forecast, by Application 2020 & 2033
- Table 46: Rest of Asia Pacific Artificial Intelligence Revenue (billion) Forecast, by Application 2020 & 2033
Frequently Asked Questions
1. What is the projected Compound Annual Growth Rate (CAGR) of the Artificial Intelligence?
The projected CAGR is approximately 30.6%.
2. Which companies are prominent players in the Artificial Intelligence?
Key companies in the market include Baidu, Alibaba, Tencent, Huawei, iFLYTEK, SenseTime, Megvii, Yitu Technology, NVIDIA, Microsoft, Google, IBM, Amazon, OpenAI, Intel, SAP, Salesforce, Brighterion, KITT.AI, Megvii Technology, Albert Technologies, Brainasoft.
3. What are the main segments of the Artificial Intelligence?
The market segments include Application, Type.
4. Can you provide details about the market size?
The market size is estimated to be USD 390.91 billion as of 2022.
5. What are some drivers contributing to market growth?
N/A
6. What are the notable trends driving market growth?
N/A
7. Are there any restraints impacting market growth?
N/A
8. Can you provide examples of recent developments in the market?
N/A
9. What pricing options are available for accessing the report?
Pricing options include single-user, multi-user, and enterprise licenses priced at USD 4900.00, USD 7350.00, and USD 9800.00 respectively.
10. Is the market size provided in terms of value or volume?
The market size is provided in terms of value, measured in billion.
11. Are there any specific market keywords associated with the report?
Yes, the market keyword associated with the report is "Artificial Intelligence," which aids in identifying and referencing the specific market segment covered.
12. How do I determine which pricing option suits my needs best?
The pricing options vary based on user requirements and access needs. Individual users may opt for single-user licenses, while businesses requiring broader access may choose multi-user or enterprise licenses for cost-effective access to the report.
13. Are there any additional resources or data provided in the Artificial Intelligence report?
While the report offers comprehensive insights, it's advisable to review the specific contents or supplementary materials provided to ascertain if additional resources or data are available.
14. How can I stay updated on further developments or reports in the Artificial Intelligence?
To stay informed about further developments, trends, and reports in the Artificial Intelligence, consider subscribing to industry newsletters, following relevant companies and organizations, or regularly checking reputable industry news sources and publications.
Methodology
Step 1 - Identification of Relevant Samples Size from Population Database


Step 2 - Approaches for Defining Global Market Size (Value, Volume* & Price*)

Note*: In applicable scenarios
Step 3 - Data Sources
Primary Research
- Web Analytics
- Survey Reports
- Research Institute
- Latest Research Reports
- Opinion Leaders
Secondary Research
- Annual Reports
- White Paper
- Latest Press Release
- Industry Association
- Paid Database
- Investor Presentations

Step 4 - Data Triangulation
Involves using different sources of information in order to increase the validity of a study
These sources are likely to be stakeholders in a program - participants, other researchers, program staff, other community members, and so on.
Then we put all data in single framework & apply various statistical tools to find out the dynamic on the market.
During the analysis stage, feedback from the stakeholder groups would be compared to determine areas of agreement as well as areas of divergence