

Key Insights
The Asia-Pacific (APAC) portable X-ray devices market is experiencing robust growth, driven by increasing healthcare infrastructure development, rising prevalence of chronic diseases requiring frequent X-ray imaging, and the growing adoption of point-of-care diagnostics. The region's large and diverse population, coupled with expanding medical tourism, further fuels market expansion. Technological advancements, such as the development of lightweight, battery-powered handheld devices and improved image quality through digitalization, are key factors contributing to market growth. While the initial investment in digital X-ray systems can be substantial, the long-term cost savings associated with reduced film processing and improved diagnostic accuracy are driving adoption. The market is segmented by technology (analog and digital), application (dental, mammography, chest, abdomen, etc.), and modality (handheld and mobile). Digital X-ray technology is witnessing significantly higher growth compared to analog due to its superior image quality, ease of use, and efficient workflow. The increasing demand for mobile and handheld X-ray devices, particularly in rural and remote areas with limited access to healthcare facilities, is another prominent trend. However, challenges such as high initial costs of equipment, stringent regulatory requirements, and a lack of skilled technicians in some regions can potentially restrain market growth. Based on the global market size of $1.54 billion and a CAGR of 10.75%, a reasonable estimation for the APAC market share (considering its substantial population and growing healthcare sector) can be around 30-35% of the global market.
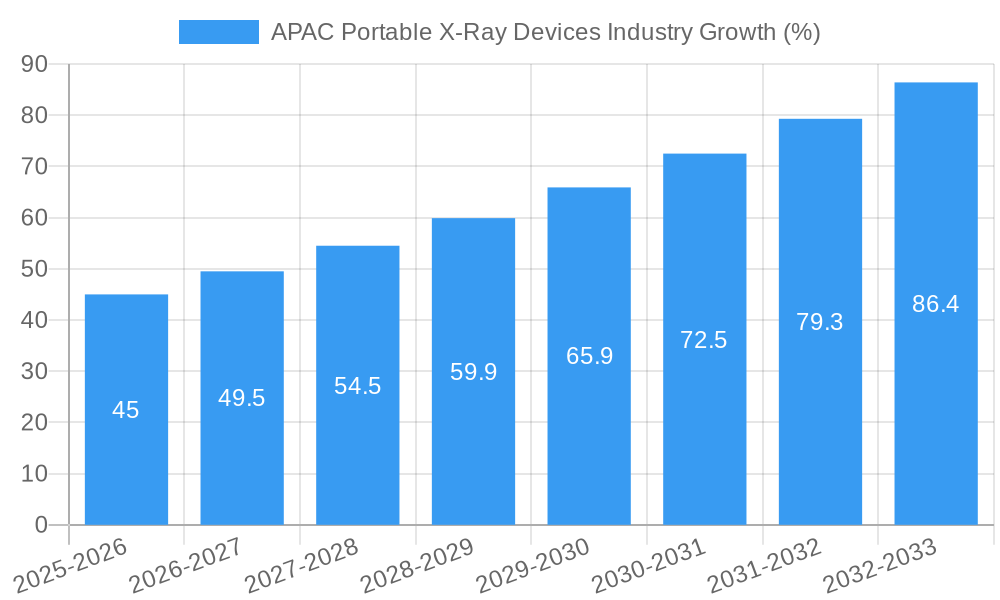
Considering the projected CAGR, the APAC portable X-ray devices market is expected to demonstrate continuous expansion through 2033. The increasing focus on preventative healthcare, coupled with government initiatives promoting improved healthcare access in underserved regions, will further stimulate growth. Competitive dynamics within the market are characterized by the presence of both established international players and emerging domestic companies. These companies are focusing on strategic partnerships, acquisitions, and product innovations to gain a competitive edge. The adoption of tele-radiology and AI-powered image analysis is expected to further revolutionize the market in the coming years, enhancing diagnostic accuracy and efficiency. Future growth is projected to be further fueled by the integration of portable X-ray devices with advanced imaging techniques and the rising demand for personalized medicine. The market will continue to benefit from the strong emphasis on improving healthcare infrastructure and enhancing access to quality medical services across the region.
APAC Portable X-Ray Devices Industry: Market Report 2019-2033
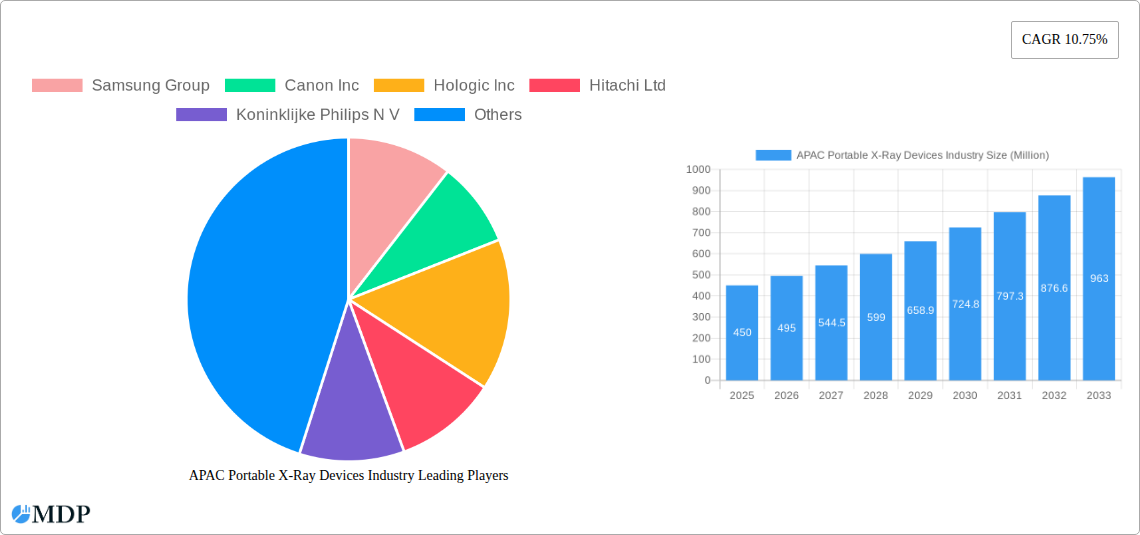
This comprehensive report provides an in-depth analysis of the Asia-Pacific (APAC) portable X-ray devices market, covering the period 2019-2033. It offers actionable insights for industry stakeholders, including manufacturers, investors, and healthcare providers, leveraging high-impact keywords to ensure maximum search engine visibility. The report analyzes market dynamics, leading players, technological advancements, and future growth opportunities within the APAC region. With a base year of 2025 and a forecast period of 2025-2033, this report is an indispensable resource for understanding and navigating this dynamic market. The market is segmented by technology (Analog X-ray, Digital X-ray), application (Dental X-ray, Mammography, Chest X-ray, Abdomen X-ray), and modality (Handheld X-ray Devices, Mobile X-ray Devices). Key players analyzed include Samsung Group, Canon Inc, Hologic Inc, Hitachi Ltd, Koninklijke Philips N.V., Siemens AG, GE Healthcare, Carestream Health Inc, Shimadzu Corporation, and Fujifilm Holdings Corporation. The total market size is projected to reach xx Million by 2033.
APAC Portable X-Ray Devices Industry Market Dynamics & Concentration
The APAC portable X-ray devices market is characterized by a moderate level of concentration, with the top five players holding an estimated xx% market share in 2024. Innovation is a key driver, fueled by advancements in digital imaging technology, miniaturization, and wireless connectivity. Stringent regulatory frameworks, varying across different APAC countries, significantly impact market access and product approvals. The market experiences competition from alternative diagnostic imaging technologies, such as ultrasound and MRI, albeit with varying degrees of substitutability depending on application. End-user trends, particularly the increasing demand for point-of-care diagnostics and telehealth solutions, are shaping market growth. Mergers and acquisitions (M&A) activity has been relatively modest in recent years, with approximately xx M&A deals recorded between 2019 and 2024.
- Market Concentration: Top 5 players hold xx% market share (2024).
- Innovation Drivers: Digital imaging, miniaturization, wireless connectivity.
- Regulatory Landscape: Stringent regulations vary across APAC countries.
- Product Substitutes: Ultrasound, MRI (limited substitutability).
- End-User Trends: Growing demand for point-of-care diagnostics and telehealth.
- M&A Activity: Approximately xx deals between 2019 and 2024.
APAC Portable X-Ray Devices Industry Industry Trends & Analysis
The APAC portable X-ray devices market is experiencing robust growth, driven by factors such as the increasing prevalence of chronic diseases, rising healthcare expenditure, and expanding healthcare infrastructure, particularly in emerging economies. Technological advancements, including the adoption of digital X-ray systems and AI-powered image analysis, are further accelerating market growth. Consumer preferences are shifting towards portable and user-friendly devices, enhancing accessibility and convenience. The competitive landscape is characterized by both established players and emerging companies vying for market share through innovation, strategic partnerships, and geographic expansion. The market is projected to exhibit a CAGR of xx% during the forecast period (2025-2033), with digital X-ray systems achieving higher market penetration compared to analog systems.
Leading Markets & Segments in APAC Portable X-Ray Devices Industry
China and India represent the largest markets for portable X-ray devices in APAC, driven by their large populations, expanding healthcare infrastructure, and rising disposable incomes. Within the technology segment, digital X-ray systems are experiencing significantly faster growth compared to analog systems, fueled by superior image quality and enhanced diagnostic capabilities. In terms of application, the mammography and chest X-ray segments dominate the market, driven by the high prevalence of related diseases. The handheld X-ray device segment is gaining traction due to its portability and ease of use.
- Key Drivers in China & India:
- Large populations
- Expanding healthcare infrastructure
- Rising disposable incomes
- Government initiatives to improve healthcare access.
- Dominant Segments:
- Technology: Digital X-ray (faster growth)
- Application: Mammography, Chest X-ray
- Modality: Handheld X-ray devices (growing popularity)
APAC Portable X-Ray Devices Industry Product Developments
Recent product developments focus on enhancing image quality, portability, and ease of use. Manufacturers are incorporating advanced features like wireless connectivity, AI-powered image analysis, and dose reduction technologies. These innovations cater to the growing demand for efficient and user-friendly diagnostic tools, improving diagnostic accuracy and patient experience while addressing regulatory requirements. The market is seeing a shift towards miniaturized and lightweight devices, particularly in the handheld segment, expanding accessibility to remote areas and improving patient comfort.
Key Drivers of APAC Portable X-Ray Devices Industry Growth
The APAC portable X-ray devices market is driven by several factors: the increasing prevalence of chronic diseases like cancer and cardiovascular diseases; rising healthcare expenditure; growing demand for point-of-care diagnostics; technological advancements in digital X-ray and AI; and favorable government initiatives promoting healthcare infrastructure development in several APAC countries. These factors contribute to a favorable environment for market expansion and increased adoption of portable X-ray systems.
Challenges in the APAC Portable X-Ray Devices Industry Market
Challenges include the high initial investment costs associated with advanced digital X-ray systems, stringent regulatory hurdles for product approvals, potential supply chain disruptions, and intense competition from established and emerging players. These factors can impede market growth and necessitate strategic planning by market participants. The xx% import tax in some countries also presents a notable hurdle.
Emerging Opportunities in APAC Portable X-Ray Devices Industry
Long-term growth opportunities include the expanding telehealth market, increasing adoption of AI-powered image analysis tools, strategic partnerships between device manufacturers and healthcare providers, and expansion into underserved rural areas. The development of more compact and affordable devices will also unlock further market potential.
Leading Players in the APAC Portable X-Ray Devices Industry Sector
- Samsung Group
- Canon Inc
- Hologic Inc
- Hitachi Ltd
- Koninklijke Philips N.V.
- Siemens AG
- GE Healthcare
- Carestream Health Inc
- Shimadzu Corporation
- Fujifilm Holdings Corporation
Key Milestones in APAC Portable X-Ray Devices Industry Industry
- February 2023: Carestream Health India launched its high-powered Carestream Motion Mobile X-ray system, expanding its product portfolio and market reach.
- July 2022: FUJIFILM Corporation opened two new NURA health screening centers in India, equipped with mammography systems, indicating increased focus on preventative healthcare and market expansion.
Strategic Outlook for APAC Portable X-Ray Devices Industry Market
The APAC portable X-ray devices market is poised for significant growth, driven by technological advancements, increasing healthcare spending, and a growing demand for accessible and efficient diagnostic tools. Strategic partnerships, product innovation, and expansion into emerging markets will be crucial for success. Companies that focus on providing affordable, user-friendly, and technologically advanced devices will be best positioned to capture market share and drive future growth.
APAC Portable X-Ray Devices Industry Segmentation
-
1. Technology
- 1.1. Analog X-ray
- 1.2. Digital X-ray
-
2. Application
- 2.1. Dental X-ray
- 2.2. Mammography
- 2.3. Chest X-ray
- 2.4. Abdomen X-ray
-
3. Modality
- 3.1. Handheld X-ray Devices
- 3.2. Mobile X-ray Devices
-
4. Geography
- 4.1. China
- 4.2. Japan
- 4.3. India
- 4.4. Australia
- 4.5. South Korea
- 4.6. Rest of Asia-Pacific
APAC Portable X-Ray Devices Industry Segmentation By Geography
- 1. China
- 2. Japan
- 3. India
- 4. Australia
- 5. South Korea
- 6. Rest of Asia Pacific
APAC Portable X-Ray Devices Industry REPORT HIGHLIGHTS
| Aspects | Details |
|---|---|
| Study Period | 2019-2033 |
| Base Year | 2024 |
| Estimated Year | 2025 |
| Forecast Period | 2025-2033 |
| Historical Period | 2019-2024 |
| Growth Rate | CAGR of 10.75% from 2019-2033 |
| Segmentation |
|
Table of Contents
- 1. Introduction
- 1.1. Research Scope
- 1.2. Market Segmentation
- 1.3. Research Methodology
- 1.4. Definitions and Assumptions
- 2. Executive Summary
- 2.1. Introduction
- 3. Market Dynamics
- 3.1. Introduction
- 3.2. Market Drivers
- 3.2.1. Rising Burden of Diseases Requiring Diagnosis; Rising Technological Advancement of X-Ray Devices
- 3.3. Market Restrains
- 3.3.1. High Costs of Devices
- 3.4. Market Trends
- 3.4.1. Mammography Segment is Expected to Grow With a Significant CAGR Over the Forecast Period of the Study
- 4. Market Factor Analysis
- 4.1. Porters Five Forces
- 4.2. Supply/Value Chain
- 4.3. PESTEL analysis
- 4.4. Market Entropy
- 4.5. Patent/Trademark Analysis
- 5. Global APAC Portable X-Ray Devices Industry Analysis, Insights and Forecast, 2019-2031
- 5.1. Market Analysis, Insights and Forecast - by Technology
- 5.1.1. Analog X-ray
- 5.1.2. Digital X-ray
- 5.2. Market Analysis, Insights and Forecast - by Application
- 5.2.1. Dental X-ray
- 5.2.2. Mammography
- 5.2.3. Chest X-ray
- 5.2.4. Abdomen X-ray
- 5.3. Market Analysis, Insights and Forecast - by Modality
- 5.3.1. Handheld X-ray Devices
- 5.3.2. Mobile X-ray Devices
- 5.4. Market Analysis, Insights and Forecast - by Geography
- 5.4.1. China
- 5.4.2. Japan
- 5.4.3. India
- 5.4.4. Australia
- 5.4.5. South Korea
- 5.4.6. Rest of Asia-Pacific
- 5.5. Market Analysis, Insights and Forecast - by Region
- 5.5.1. China
- 5.5.2. Japan
- 5.5.3. India
- 5.5.4. Australia
- 5.5.5. South Korea
- 5.5.6. Rest of Asia Pacific
- 5.1. Market Analysis, Insights and Forecast - by Technology
- 6. China APAC Portable X-Ray Devices Industry Analysis, Insights and Forecast, 2019-2031
- 6.1. Market Analysis, Insights and Forecast - by Technology
- 6.1.1. Analog X-ray
- 6.1.2. Digital X-ray
- 6.2. Market Analysis, Insights and Forecast - by Application
- 6.2.1. Dental X-ray
- 6.2.2. Mammography
- 6.2.3. Chest X-ray
- 6.2.4. Abdomen X-ray
- 6.3. Market Analysis, Insights and Forecast - by Modality
- 6.3.1. Handheld X-ray Devices
- 6.3.2. Mobile X-ray Devices
- 6.4. Market Analysis, Insights and Forecast - by Geography
- 6.4.1. China
- 6.4.2. Japan
- 6.4.3. India
- 6.4.4. Australia
- 6.4.5. South Korea
- 6.4.6. Rest of Asia-Pacific
- 6.1. Market Analysis, Insights and Forecast - by Technology
- 7. Japan APAC Portable X-Ray Devices Industry Analysis, Insights and Forecast, 2019-2031
- 7.1. Market Analysis, Insights and Forecast - by Technology
- 7.1.1. Analog X-ray
- 7.1.2. Digital X-ray
- 7.2. Market Analysis, Insights and Forecast - by Application
- 7.2.1. Dental X-ray
- 7.2.2. Mammography
- 7.2.3. Chest X-ray
- 7.2.4. Abdomen X-ray
- 7.3. Market Analysis, Insights and Forecast - by Modality
- 7.3.1. Handheld X-ray Devices
- 7.3.2. Mobile X-ray Devices
- 7.4. Market Analysis, Insights and Forecast - by Geography
- 7.4.1. China
- 7.4.2. Japan
- 7.4.3. India
- 7.4.4. Australia
- 7.4.5. South Korea
- 7.4.6. Rest of Asia-Pacific
- 7.1. Market Analysis, Insights and Forecast - by Technology
- 8. India APAC Portable X-Ray Devices Industry Analysis, Insights and Forecast, 2019-2031
- 8.1. Market Analysis, Insights and Forecast - by Technology
- 8.1.1. Analog X-ray
- 8.1.2. Digital X-ray
- 8.2. Market Analysis, Insights and Forecast - by Application
- 8.2.1. Dental X-ray
- 8.2.2. Mammography
- 8.2.3. Chest X-ray
- 8.2.4. Abdomen X-ray
- 8.3. Market Analysis, Insights and Forecast - by Modality
- 8.3.1. Handheld X-ray Devices
- 8.3.2. Mobile X-ray Devices
- 8.4. Market Analysis, Insights and Forecast - by Geography
- 8.4.1. China
- 8.4.2. Japan
- 8.4.3. India
- 8.4.4. Australia
- 8.4.5. South Korea
- 8.4.6. Rest of Asia-Pacific
- 8.1. Market Analysis, Insights and Forecast - by Technology
- 9. Australia APAC Portable X-Ray Devices Industry Analysis, Insights and Forecast, 2019-2031
- 9.1. Market Analysis, Insights and Forecast - by Technology
- 9.1.1. Analog X-ray
- 9.1.2. Digital X-ray
- 9.2. Market Analysis, Insights and Forecast - by Application
- 9.2.1. Dental X-ray
- 9.2.2. Mammography
- 9.2.3. Chest X-ray
- 9.2.4. Abdomen X-ray
- 9.3. Market Analysis, Insights and Forecast - by Modality
- 9.3.1. Handheld X-ray Devices
- 9.3.2. Mobile X-ray Devices
- 9.4. Market Analysis, Insights and Forecast - by Geography
- 9.4.1. China
- 9.4.2. Japan
- 9.4.3. India
- 9.4.4. Australia
- 9.4.5. South Korea
- 9.4.6. Rest of Asia-Pacific
- 9.1. Market Analysis, Insights and Forecast - by Technology
- 10. South Korea APAC Portable X-Ray Devices Industry Analysis, Insights and Forecast, 2019-2031
- 10.1. Market Analysis, Insights and Forecast - by Technology
- 10.1.1. Analog X-ray
- 10.1.2. Digital X-ray
- 10.2. Market Analysis, Insights and Forecast - by Application
- 10.2.1. Dental X-ray
- 10.2.2. Mammography
- 10.2.3. Chest X-ray
- 10.2.4. Abdomen X-ray
- 10.3. Market Analysis, Insights and Forecast - by Modality
- 10.3.1. Handheld X-ray Devices
- 10.3.2. Mobile X-ray Devices
- 10.4. Market Analysis, Insights and Forecast - by Geography
- 10.4.1. China
- 10.4.2. Japan
- 10.4.3. India
- 10.4.4. Australia
- 10.4.5. South Korea
- 10.4.6. Rest of Asia-Pacific
- 10.1. Market Analysis, Insights and Forecast - by Technology
- 11. Rest of Asia Pacific APAC Portable X-Ray Devices Industry Analysis, Insights and Forecast, 2019-2031
- 11.1. Market Analysis, Insights and Forecast - by Technology
- 11.1.1. Analog X-ray
- 11.1.2. Digital X-ray
- 11.2. Market Analysis, Insights and Forecast - by Application
- 11.2.1. Dental X-ray
- 11.2.2. Mammography
- 11.2.3. Chest X-ray
- 11.2.4. Abdomen X-ray
- 11.3. Market Analysis, Insights and Forecast - by Modality
- 11.3.1. Handheld X-ray Devices
- 11.3.2. Mobile X-ray Devices
- 11.4. Market Analysis, Insights and Forecast - by Geography
- 11.4.1. China
- 11.4.2. Japan
- 11.4.3. India
- 11.4.4. Australia
- 11.4.5. South Korea
- 11.4.6. Rest of Asia-Pacific
- 11.1. Market Analysis, Insights and Forecast - by Technology
- 12. North America APAC Portable X-Ray Devices Industry Analysis, Insights and Forecast, 2019-2031
- 12.1. Market Analysis, Insights and Forecast - By Country/Sub-region
- 12.1.1 United States
- 12.1.2 Canada
- 12.1.3 Mexico
- 13. Europe APAC Portable X-Ray Devices Industry Analysis, Insights and Forecast, 2019-2031
- 13.1. Market Analysis, Insights and Forecast - By Country/Sub-region
- 13.1.1 Germany
- 13.1.2 United Kingdom
- 13.1.3 France
- 13.1.4 Spain
- 13.1.5 Italy
- 13.1.6 Spain
- 13.1.7 Belgium
- 13.1.8 Netherland
- 13.1.9 Nordics
- 13.1.10 Rest of Europe
- 14. Asia Pacific APAC Portable X-Ray Devices Industry Analysis, Insights and Forecast, 2019-2031
- 14.1. Market Analysis, Insights and Forecast - By Country/Sub-region
- 14.1.1 China
- 14.1.2 Japan
- 14.1.3 India
- 14.1.4 South Korea
- 14.1.5 Southeast Asia
- 14.1.6 Australia
- 14.1.7 Indonesia
- 14.1.8 Phillipes
- 14.1.9 Singapore
- 14.1.10 Thailandc
- 14.1.11 Rest of Asia Pacific
- 15. South America APAC Portable X-Ray Devices Industry Analysis, Insights and Forecast, 2019-2031
- 15.1. Market Analysis, Insights and Forecast - By Country/Sub-region
- 15.1.1 Brazil
- 15.1.2 Argentina
- 15.1.3 Peru
- 15.1.4 Chile
- 15.1.5 Colombia
- 15.1.6 Ecuador
- 15.1.7 Venezuela
- 15.1.8 Rest of South America
- 16. MEA APAC Portable X-Ray Devices Industry Analysis, Insights and Forecast, 2019-2031
- 16.1. Market Analysis, Insights and Forecast - By Country/Sub-region
- 16.1.1 United Arab Emirates
- 16.1.2 Saudi Arabia
- 16.1.3 South Africa
- 16.1.4 Rest of Middle East and Africa
- 17. Competitive Analysis
- 17.1. Global Market Share Analysis 2024
- 17.2. Company Profiles
- 17.2.1 Samsung Group
- 17.2.1.1. Overview
- 17.2.1.2. Products
- 17.2.1.3. SWOT Analysis
- 17.2.1.4. Recent Developments
- 17.2.1.5. Financials (Based on Availability)
- 17.2.2 Canon Inc
- 17.2.2.1. Overview
- 17.2.2.2. Products
- 17.2.2.3. SWOT Analysis
- 17.2.2.4. Recent Developments
- 17.2.2.5. Financials (Based on Availability)
- 17.2.3 Hologic Inc
- 17.2.3.1. Overview
- 17.2.3.2. Products
- 17.2.3.3. SWOT Analysis
- 17.2.3.4. Recent Developments
- 17.2.3.5. Financials (Based on Availability)
- 17.2.4 Hitachi Ltd
- 17.2.4.1. Overview
- 17.2.4.2. Products
- 17.2.4.3. SWOT Analysis
- 17.2.4.4. Recent Developments
- 17.2.4.5. Financials (Based on Availability)
- 17.2.5 Koninklijke Philips N V
- 17.2.5.1. Overview
- 17.2.5.2. Products
- 17.2.5.3. SWOT Analysis
- 17.2.5.4. Recent Developments
- 17.2.5.5. Financials (Based on Availability)
- 17.2.6 Siemens AG
- 17.2.6.1. Overview
- 17.2.6.2. Products
- 17.2.6.3. SWOT Analysis
- 17.2.6.4. Recent Developments
- 17.2.6.5. Financials (Based on Availability)
- 17.2.7 GE Healthcare
- 17.2.7.1. Overview
- 17.2.7.2. Products
- 17.2.7.3. SWOT Analysis
- 17.2.7.4. Recent Developments
- 17.2.7.5. Financials (Based on Availability)
- 17.2.8 Carestream Health Inc
- 17.2.8.1. Overview
- 17.2.8.2. Products
- 17.2.8.3. SWOT Analysis
- 17.2.8.4. Recent Developments
- 17.2.8.5. Financials (Based on Availability)
- 17.2.9 Shimadzu Corporation
- 17.2.9.1. Overview
- 17.2.9.2. Products
- 17.2.9.3. SWOT Analysis
- 17.2.9.4. Recent Developments
- 17.2.9.5. Financials (Based on Availability)
- 17.2.10 Fujifilm Holdings Corporation
- 17.2.10.1. Overview
- 17.2.10.2. Products
- 17.2.10.3. SWOT Analysis
- 17.2.10.4. Recent Developments
- 17.2.10.5. Financials (Based on Availability)
- 17.2.1 Samsung Group
List of Figures
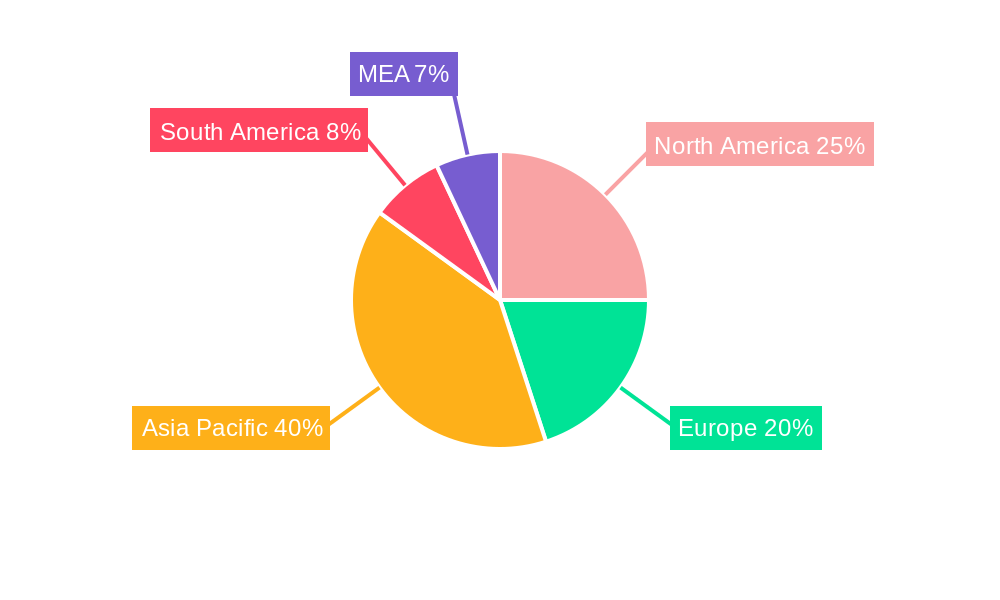
- Figure 1: Global APAC Portable X-Ray Devices Industry Revenue Breakdown (Million, %) by Region 2024 & 2032
- Figure 2: Global APAC Portable X-Ray Devices Industry Volume Breakdown (K Unit, %) by Region 2024 & 2032
- Figure 3: North America APAC Portable X-Ray Devices Industry Revenue (Million), by Country 2024 & 2032
- Figure 4: North America APAC Portable X-Ray Devices Industry Volume (K Unit), by Country 2024 & 2032
- Figure 5: North America APAC Portable X-Ray Devices Industry Revenue Share (%), by Country 2024 & 2032
- Figure 6: North America APAC Portable X-Ray Devices Industry Volume Share (%), by Country 2024 & 2032
- Figure 7: Europe APAC Portable X-Ray Devices Industry Revenue (Million), by Country 2024 & 2032
- Figure 8: Europe APAC Portable X-Ray Devices Industry Volume (K Unit), by Country 2024 & 2032
- Figure 9: Europe APAC Portable X-Ray Devices Industry Revenue Share (%), by Country 2024 & 2032
- Figure 10: Europe APAC Portable X-Ray Devices Industry Volume Share (%), by Country 2024 & 2032
- Figure 11: Asia Pacific APAC Portable X-Ray Devices Industry Revenue (Million), by Country 2024 & 2032
- Figure 12: Asia Pacific APAC Portable X-Ray Devices Industry Volume (K Unit), by Country 2024 & 2032
- Figure 13: Asia Pacific APAC Portable X-Ray Devices Industry Revenue Share (%), by Country 2024 & 2032
- Figure 14: Asia Pacific APAC Portable X-Ray Devices Industry Volume Share (%), by Country 2024 & 2032
- Figure 15: South America APAC Portable X-Ray Devices Industry Revenue (Million), by Country 2024 & 2032
- Figure 16: South America APAC Portable X-Ray Devices Industry Volume (K Unit), by Country 2024 & 2032
- Figure 17: South America APAC Portable X-Ray Devices Industry Revenue Share (%), by Country 2024 & 2032
- Figure 18: South America APAC Portable X-Ray Devices Industry Volume Share (%), by Country 2024 & 2032
- Figure 19: MEA APAC Portable X-Ray Devices Industry Revenue (Million), by Country 2024 & 2032
- Figure 20: MEA APAC Portable X-Ray Devices Industry Volume (K Unit), by Country 2024 & 2032
- Figure 21: MEA APAC Portable X-Ray Devices Industry Revenue Share (%), by Country 2024 & 2032
- Figure 22: MEA APAC Portable X-Ray Devices Industry Volume Share (%), by Country 2024 & 2032
- Figure 23: China APAC Portable X-Ray Devices Industry Revenue (Million), by Technology 2024 & 2032
- Figure 24: China APAC Portable X-Ray Devices Industry Volume (K Unit), by Technology 2024 & 2032
- Figure 25: China APAC Portable X-Ray Devices Industry Revenue Share (%), by Technology 2024 & 2032
- Figure 26: China APAC Portable X-Ray Devices Industry Volume Share (%), by Technology 2024 & 2032
- Figure 27: China APAC Portable X-Ray Devices Industry Revenue (Million), by Application 2024 & 2032
- Figure 28: China APAC Portable X-Ray Devices Industry Volume (K Unit), by Application 2024 & 2032
- Figure 29: China APAC Portable X-Ray Devices Industry Revenue Share (%), by Application 2024 & 2032
- Figure 30: China APAC Portable X-Ray Devices Industry Volume Share (%), by Application 2024 & 2032
- Figure 31: China APAC Portable X-Ray Devices Industry Revenue (Million), by Modality 2024 & 2032
- Figure 32: China APAC Portable X-Ray Devices Industry Volume (K Unit), by Modality 2024 & 2032
- Figure 33: China APAC Portable X-Ray Devices Industry Revenue Share (%), by Modality 2024 & 2032
- Figure 34: China APAC Portable X-Ray Devices Industry Volume Share (%), by Modality 2024 & 2032
- Figure 35: China APAC Portable X-Ray Devices Industry Revenue (Million), by Geography 2024 & 2032
- Figure 36: China APAC Portable X-Ray Devices Industry Volume (K Unit), by Geography 2024 & 2032
- Figure 37: China APAC Portable X-Ray Devices Industry Revenue Share (%), by Geography 2024 & 2032
- Figure 38: China APAC Portable X-Ray Devices Industry Volume Share (%), by Geography 2024 & 2032
- Figure 39: China APAC Portable X-Ray Devices Industry Revenue (Million), by Country 2024 & 2032
- Figure 40: China APAC Portable X-Ray Devices Industry Volume (K Unit), by Country 2024 & 2032
- Figure 41: China APAC Portable X-Ray Devices Industry Revenue Share (%), by Country 2024 & 2032
- Figure 42: China APAC Portable X-Ray Devices Industry Volume Share (%), by Country 2024 & 2032
- Figure 43: Japan APAC Portable X-Ray Devices Industry Revenue (Million), by Technology 2024 & 2032
- Figure 44: Japan APAC Portable X-Ray Devices Industry Volume (K Unit), by Technology 2024 & 2032
- Figure 45: Japan APAC Portable X-Ray Devices Industry Revenue Share (%), by Technology 2024 & 2032
- Figure 46: Japan APAC Portable X-Ray Devices Industry Volume Share (%), by Technology 2024 & 2032
- Figure 47: Japan APAC Portable X-Ray Devices Industry Revenue (Million), by Application 2024 & 2032
- Figure 48: Japan APAC Portable X-Ray Devices Industry Volume (K Unit), by Application 2024 & 2032
- Figure 49: Japan APAC Portable X-Ray Devices Industry Revenue Share (%), by Application 2024 & 2032
- Figure 50: Japan APAC Portable X-Ray Devices Industry Volume Share (%), by Application 2024 & 2032
- Figure 51: Japan APAC Portable X-Ray Devices Industry Revenue (Million), by Modality 2024 & 2032
- Figure 52: Japan APAC Portable X-Ray Devices Industry Volume (K Unit), by Modality 2024 & 2032
- Figure 53: Japan APAC Portable X-Ray Devices Industry Revenue Share (%), by Modality 2024 & 2032
- Figure 54: Japan APAC Portable X-Ray Devices Industry Volume Share (%), by Modality 2024 & 2032
- Figure 55: Japan APAC Portable X-Ray Devices Industry Revenue (Million), by Geography 2024 & 2032
- Figure 56: Japan APAC Portable X-Ray Devices Industry Volume (K Unit), by Geography 2024 & 2032
- Figure 57: Japan APAC Portable X-Ray Devices Industry Revenue Share (%), by Geography 2024 & 2032
- Figure 58: Japan APAC Portable X-Ray Devices Industry Volume Share (%), by Geography 2024 & 2032
- Figure 59: Japan APAC Portable X-Ray Devices Industry Revenue (Million), by Country 2024 & 2032
- Figure 60: Japan APAC Portable X-Ray Devices Industry Volume (K Unit), by Country 2024 & 2032
- Figure 61: Japan APAC Portable X-Ray Devices Industry Revenue Share (%), by Country 2024 & 2032
- Figure 62: Japan APAC Portable X-Ray Devices Industry Volume Share (%), by Country 2024 & 2032
- Figure 63: India APAC Portable X-Ray Devices Industry Revenue (Million), by Technology 2024 & 2032
- Figure 64: India APAC Portable X-Ray Devices Industry Volume (K Unit), by Technology 2024 & 2032
- Figure 65: India APAC Portable X-Ray Devices Industry Revenue Share (%), by Technology 2024 & 2032
- Figure 66: India APAC Portable X-Ray Devices Industry Volume Share (%), by Technology 2024 & 2032
- Figure 67: India APAC Portable X-Ray Devices Industry Revenue (Million), by Application 2024 & 2032
- Figure 68: India APAC Portable X-Ray Devices Industry Volume (K Unit), by Application 2024 & 2032
- Figure 69: India APAC Portable X-Ray Devices Industry Revenue Share (%), by Application 2024 & 2032
- Figure 70: India APAC Portable X-Ray Devices Industry Volume Share (%), by Application 2024 & 2032
- Figure 71: India APAC Portable X-Ray Devices Industry Revenue (Million), by Modality 2024 & 2032
- Figure 72: India APAC Portable X-Ray Devices Industry Volume (K Unit), by Modality 2024 & 2032
- Figure 73: India APAC Portable X-Ray Devices Industry Revenue Share (%), by Modality 2024 & 2032
- Figure 74: India APAC Portable X-Ray Devices Industry Volume Share (%), by Modality 2024 & 2032
- Figure 75: India APAC Portable X-Ray Devices Industry Revenue (Million), by Geography 2024 & 2032
- Figure 76: India APAC Portable X-Ray Devices Industry Volume (K Unit), by Geography 2024 & 2032
- Figure 77: India APAC Portable X-Ray Devices Industry Revenue Share (%), by Geography 2024 & 2032
- Figure 78: India APAC Portable X-Ray Devices Industry Volume Share (%), by Geography 2024 & 2032
- Figure 79: India APAC Portable X-Ray Devices Industry Revenue (Million), by Country 2024 & 2032
- Figure 80: India APAC Portable X-Ray Devices Industry Volume (K Unit), by Country 2024 & 2032
- Figure 81: India APAC Portable X-Ray Devices Industry Revenue Share (%), by Country 2024 & 2032
- Figure 82: India APAC Portable X-Ray Devices Industry Volume Share (%), by Country 2024 & 2032
- Figure 83: Australia APAC Portable X-Ray Devices Industry Revenue (Million), by Technology 2024 & 2032
- Figure 84: Australia APAC Portable X-Ray Devices Industry Volume (K Unit), by Technology 2024 & 2032
- Figure 85: Australia APAC Portable X-Ray Devices Industry Revenue Share (%), by Technology 2024 & 2032
- Figure 86: Australia APAC Portable X-Ray Devices Industry Volume Share (%), by Technology 2024 & 2032
- Figure 87: Australia APAC Portable X-Ray Devices Industry Revenue (Million), by Application 2024 & 2032
- Figure 88: Australia APAC Portable X-Ray Devices Industry Volume (K Unit), by Application 2024 & 2032
- Figure 89: Australia APAC Portable X-Ray Devices Industry Revenue Share (%), by Application 2024 & 2032
- Figure 90: Australia APAC Portable X-Ray Devices Industry Volume Share (%), by Application 2024 & 2032
- Figure 91: Australia APAC Portable X-Ray Devices Industry Revenue (Million), by Modality 2024 & 2032
- Figure 92: Australia APAC Portable X-Ray Devices Industry Volume (K Unit), by Modality 2024 & 2032
- Figure 93: Australia APAC Portable X-Ray Devices Industry Revenue Share (%), by Modality 2024 & 2032
- Figure 94: Australia APAC Portable X-Ray Devices Industry Volume Share (%), by Modality 2024 & 2032
- Figure 95: Australia APAC Portable X-Ray Devices Industry Revenue (Million), by Geography 2024 & 2032
- Figure 96: Australia APAC Portable X-Ray Devices Industry Volume (K Unit), by Geography 2024 & 2032
- Figure 97: Australia APAC Portable X-Ray Devices Industry Revenue Share (%), by Geography 2024 & 2032
- Figure 98: Australia APAC Portable X-Ray Devices Industry Volume Share (%), by Geography 2024 & 2032
- Figure 99: Australia APAC Portable X-Ray Devices Industry Revenue (Million), by Country 2024 & 2032
- Figure 100: Australia APAC Portable X-Ray Devices Industry Volume (K Unit), by Country 2024 & 2032
- Figure 101: Australia APAC Portable X-Ray Devices Industry Revenue Share (%), by Country 2024 & 2032
- Figure 102: Australia APAC Portable X-Ray Devices Industry Volume Share (%), by Country 2024 & 2032
- Figure 103: South Korea APAC Portable X-Ray Devices Industry Revenue (Million), by Technology 2024 & 2032
- Figure 104: South Korea APAC Portable X-Ray Devices Industry Volume (K Unit), by Technology 2024 & 2032
- Figure 105: South Korea APAC Portable X-Ray Devices Industry Revenue Share (%), by Technology 2024 & 2032
- Figure 106: South Korea APAC Portable X-Ray Devices Industry Volume Share (%), by Technology 2024 & 2032
- Figure 107: South Korea APAC Portable X-Ray Devices Industry Revenue (Million), by Application 2024 & 2032
- Figure 108: South Korea APAC Portable X-Ray Devices Industry Volume (K Unit), by Application 2024 & 2032
- Figure 109: South Korea APAC Portable X-Ray Devices Industry Revenue Share (%), by Application 2024 & 2032
- Figure 110: South Korea APAC Portable X-Ray Devices Industry Volume Share (%), by Application 2024 & 2032
- Figure 111: South Korea APAC Portable X-Ray Devices Industry Revenue (Million), by Modality 2024 & 2032
- Figure 112: South Korea APAC Portable X-Ray Devices Industry Volume (K Unit), by Modality 2024 & 2032
- Figure 113: South Korea APAC Portable X-Ray Devices Industry Revenue Share (%), by Modality 2024 & 2032
- Figure 114: South Korea APAC Portable X-Ray Devices Industry Volume Share (%), by Modality 2024 & 2032
- Figure 115: South Korea APAC Portable X-Ray Devices Industry Revenue (Million), by Geography 2024 & 2032
- Figure 116: South Korea APAC Portable X-Ray Devices Industry Volume (K Unit), by Geography 2024 & 2032
- Figure 117: South Korea APAC Portable X-Ray Devices Industry Revenue Share (%), by Geography 2024 & 2032
- Figure 118: South Korea APAC Portable X-Ray Devices Industry Volume Share (%), by Geography 2024 & 2032
- Figure 119: South Korea APAC Portable X-Ray Devices Industry Revenue (Million), by Country 2024 & 2032
- Figure 120: South Korea APAC Portable X-Ray Devices Industry Volume (K Unit), by Country 2024 & 2032
- Figure 121: South Korea APAC Portable X-Ray Devices Industry Revenue Share (%), by Country 2024 & 2032
- Figure 122: South Korea APAC Portable X-Ray Devices Industry Volume Share (%), by Country 2024 & 2032
- Figure 123: Rest of Asia Pacific APAC Portable X-Ray Devices Industry Revenue (Million), by Technology 2024 & 2032
- Figure 124: Rest of Asia Pacific APAC Portable X-Ray Devices Industry Volume (K Unit), by Technology 2024 & 2032
- Figure 125: Rest of Asia Pacific APAC Portable X-Ray Devices Industry Revenue Share (%), by Technology 2024 & 2032
- Figure 126: Rest of Asia Pacific APAC Portable X-Ray Devices Industry Volume Share (%), by Technology 2024 & 2032
- Figure 127: Rest of Asia Pacific APAC Portable X-Ray Devices Industry Revenue (Million), by Application 2024 & 2032
- Figure 128: Rest of Asia Pacific APAC Portable X-Ray Devices Industry Volume (K Unit), by Application 2024 & 2032
- Figure 129: Rest of Asia Pacific APAC Portable X-Ray Devices Industry Revenue Share (%), by Application 2024 & 2032
- Figure 130: Rest of Asia Pacific APAC Portable X-Ray Devices Industry Volume Share (%), by Application 2024 & 2032
- Figure 131: Rest of Asia Pacific APAC Portable X-Ray Devices Industry Revenue (Million), by Modality 2024 & 2032
- Figure 132: Rest of Asia Pacific APAC Portable X-Ray Devices Industry Volume (K Unit), by Modality 2024 & 2032
- Figure 133: Rest of Asia Pacific APAC Portable X-Ray Devices Industry Revenue Share (%), by Modality 2024 & 2032
- Figure 134: Rest of Asia Pacific APAC Portable X-Ray Devices Industry Volume Share (%), by Modality 2024 & 2032
- Figure 135: Rest of Asia Pacific APAC Portable X-Ray Devices Industry Revenue (Million), by Geography 2024 & 2032
- Figure 136: Rest of Asia Pacific APAC Portable X-Ray Devices Industry Volume (K Unit), by Geography 2024 & 2032
- Figure 137: Rest of Asia Pacific APAC Portable X-Ray Devices Industry Revenue Share (%), by Geography 2024 & 2032
- Figure 138: Rest of Asia Pacific APAC Portable X-Ray Devices Industry Volume Share (%), by Geography 2024 & 2032
- Figure 139: Rest of Asia Pacific APAC Portable X-Ray Devices Industry Revenue (Million), by Country 2024 & 2032
- Figure 140: Rest of Asia Pacific APAC Portable X-Ray Devices Industry Volume (K Unit), by Country 2024 & 2032
- Figure 141: Rest of Asia Pacific APAC Portable X-Ray Devices Industry Revenue Share (%), by Country 2024 & 2032
- Figure 142: Rest of Asia Pacific APAC Portable X-Ray Devices Industry Volume Share (%), by Country 2024 & 2032
List of Tables
- Table 1: Global APAC Portable X-Ray Devices Industry Revenue Million Forecast, by Region 2019 & 2032
- Table 2: Global APAC Portable X-Ray Devices Industry Volume K Unit Forecast, by Region 2019 & 2032
- Table 3: Global APAC Portable X-Ray Devices Industry Revenue Million Forecast, by Technology 2019 & 2032
- Table 4: Global APAC Portable X-Ray Devices Industry Volume K Unit Forecast, by Technology 2019 & 2032
- Table 5: Global APAC Portable X-Ray Devices Industry Revenue Million Forecast, by Application 2019 & 2032
- Table 6: Global APAC Portable X-Ray Devices Industry Volume K Unit Forecast, by Application 2019 & 2032
- Table 7: Global APAC Portable X-Ray Devices Industry Revenue Million Forecast, by Modality 2019 & 2032
- Table 8: Global APAC Portable X-Ray Devices Industry Volume K Unit Forecast, by Modality 2019 & 2032
- Table 9: Global APAC Portable X-Ray Devices Industry Revenue Million Forecast, by Geography 2019 & 2032
- Table 10: Global APAC Portable X-Ray Devices Industry Volume K Unit Forecast, by Geography 2019 & 2032
- Table 11: Global APAC Portable X-Ray Devices Industry Revenue Million Forecast, by Region 2019 & 2032
- Table 12: Global APAC Portable X-Ray Devices Industry Volume K Unit Forecast, by Region 2019 & 2032
- Table 13: Global APAC Portable X-Ray Devices Industry Revenue Million Forecast, by Country 2019 & 2032
- Table 14: Global APAC Portable X-Ray Devices Industry Volume K Unit Forecast, by Country 2019 & 2032
- Table 15: United States APAC Portable X-Ray Devices Industry Revenue (Million) Forecast, by Application 2019 & 2032
- Table 16: United States APAC Portable X-Ray Devices Industry Volume (K Unit) Forecast, by Application 2019 & 2032
- Table 17: Canada APAC Portable X-Ray Devices Industry Revenue (Million) Forecast, by Application 2019 & 2032
- Table 18: Canada APAC Portable X-Ray Devices Industry Volume (K Unit) Forecast, by Application 2019 & 2032
- Table 19: Mexico APAC Portable X-Ray Devices Industry Revenue (Million) Forecast, by Application 2019 & 2032
- Table 20: Mexico APAC Portable X-Ray Devices Industry Volume (K Unit) Forecast, by Application 2019 & 2032
- Table 21: Global APAC Portable X-Ray Devices Industry Revenue Million Forecast, by Country 2019 & 2032
- Table 22: Global APAC Portable X-Ray Devices Industry Volume K Unit Forecast, by Country 2019 & 2032
- Table 23: Germany APAC Portable X-Ray Devices Industry Revenue (Million) Forecast, by Application 2019 & 2032
- Table 24: Germany APAC Portable X-Ray Devices Industry Volume (K Unit) Forecast, by Application 2019 & 2032
- Table 25: United Kingdom APAC Portable X-Ray Devices Industry Revenue (Million) Forecast, by Application 2019 & 2032
- Table 26: United Kingdom APAC Portable X-Ray Devices Industry Volume (K Unit) Forecast, by Application 2019 & 2032
- Table 27: France APAC Portable X-Ray Devices Industry Revenue (Million) Forecast, by Application 2019 & 2032
- Table 28: France APAC Portable X-Ray Devices Industry Volume (K Unit) Forecast, by Application 2019 & 2032
- Table 29: Spain APAC Portable X-Ray Devices Industry Revenue (Million) Forecast, by Application 2019 & 2032
- Table 30: Spain APAC Portable X-Ray Devices Industry Volume (K Unit) Forecast, by Application 2019 & 2032
- Table 31: Italy APAC Portable X-Ray Devices Industry Revenue (Million) Forecast, by Application 2019 & 2032
- Table 32: Italy APAC Portable X-Ray Devices Industry Volume (K Unit) Forecast, by Application 2019 & 2032
- Table 33: Spain APAC Portable X-Ray Devices Industry Revenue (Million) Forecast, by Application 2019 & 2032
- Table 34: Spain APAC Portable X-Ray Devices Industry Volume (K Unit) Forecast, by Application 2019 & 2032
- Table 35: Belgium APAC Portable X-Ray Devices Industry Revenue (Million) Forecast, by Application 2019 & 2032
- Table 36: Belgium APAC Portable X-Ray Devices Industry Volume (K Unit) Forecast, by Application 2019 & 2032
- Table 37: Netherland APAC Portable X-Ray Devices Industry Revenue (Million) Forecast, by Application 2019 & 2032
- Table 38: Netherland APAC Portable X-Ray Devices Industry Volume (K Unit) Forecast, by Application 2019 & 2032
- Table 39: Nordics APAC Portable X-Ray Devices Industry Revenue (Million) Forecast, by Application 2019 & 2032
- Table 40: Nordics APAC Portable X-Ray Devices Industry Volume (K Unit) Forecast, by Application 2019 & 2032
- Table 41: Rest of Europe APAC Portable X-Ray Devices Industry Revenue (Million) Forecast, by Application 2019 & 2032
- Table 42: Rest of Europe APAC Portable X-Ray Devices Industry Volume (K Unit) Forecast, by Application 2019 & 2032
- Table 43: Global APAC Portable X-Ray Devices Industry Revenue Million Forecast, by Country 2019 & 2032
- Table 44: Global APAC Portable X-Ray Devices Industry Volume K Unit Forecast, by Country 2019 & 2032
- Table 45: China APAC Portable X-Ray Devices Industry Revenue (Million) Forecast, by Application 2019 & 2032
- Table 46: China APAC Portable X-Ray Devices Industry Volume (K Unit) Forecast, by Application 2019 & 2032
- Table 47: Japan APAC Portable X-Ray Devices Industry Revenue (Million) Forecast, by Application 2019 & 2032
- Table 48: Japan APAC Portable X-Ray Devices Industry Volume (K Unit) Forecast, by Application 2019 & 2032
- Table 49: India APAC Portable X-Ray Devices Industry Revenue (Million) Forecast, by Application 2019 & 2032
- Table 50: India APAC Portable X-Ray Devices Industry Volume (K Unit) Forecast, by Application 2019 & 2032
- Table 51: South Korea APAC Portable X-Ray Devices Industry Revenue (Million) Forecast, by Application 2019 & 2032
- Table 52: South Korea APAC Portable X-Ray Devices Industry Volume (K Unit) Forecast, by Application 2019 & 2032
- Table 53: Southeast Asia APAC Portable X-Ray Devices Industry Revenue (Million) Forecast, by Application 2019 & 2032
- Table 54: Southeast Asia APAC Portable X-Ray Devices Industry Volume (K Unit) Forecast, by Application 2019 & 2032
- Table 55: Australia APAC Portable X-Ray Devices Industry Revenue (Million) Forecast, by Application 2019 & 2032
- Table 56: Australia APAC Portable X-Ray Devices Industry Volume (K Unit) Forecast, by Application 2019 & 2032
- Table 57: Indonesia APAC Portable X-Ray Devices Industry Revenue (Million) Forecast, by Application 2019 & 2032
- Table 58: Indonesia APAC Portable X-Ray Devices Industry Volume (K Unit) Forecast, by Application 2019 & 2032
- Table 59: Phillipes APAC Portable X-Ray Devices Industry Revenue (Million) Forecast, by Application 2019 & 2032
- Table 60: Phillipes APAC Portable X-Ray Devices Industry Volume (K Unit) Forecast, by Application 2019 & 2032
- Table 61: Singapore APAC Portable X-Ray Devices Industry Revenue (Million) Forecast, by Application 2019 & 2032
- Table 62: Singapore APAC Portable X-Ray Devices Industry Volume (K Unit) Forecast, by Application 2019 & 2032
- Table 63: Thailandc APAC Portable X-Ray Devices Industry Revenue (Million) Forecast, by Application 2019 & 2032
- Table 64: Thailandc APAC Portable X-Ray Devices Industry Volume (K Unit) Forecast, by Application 2019 & 2032
- Table 65: Rest of Asia Pacific APAC Portable X-Ray Devices Industry Revenue (Million) Forecast, by Application 2019 & 2032
- Table 66: Rest of Asia Pacific APAC Portable X-Ray Devices Industry Volume (K Unit) Forecast, by Application 2019 & 2032
- Table 67: Global APAC Portable X-Ray Devices Industry Revenue Million Forecast, by Country 2019 & 2032
- Table 68: Global APAC Portable X-Ray Devices Industry Volume K Unit Forecast, by Country 2019 & 2032
- Table 69: Brazil APAC Portable X-Ray Devices Industry Revenue (Million) Forecast, by Application 2019 & 2032
- Table 70: Brazil APAC Portable X-Ray Devices Industry Volume (K Unit) Forecast, by Application 2019 & 2032
- Table 71: Argentina APAC Portable X-Ray Devices Industry Revenue (Million) Forecast, by Application 2019 & 2032
- Table 72: Argentina APAC Portable X-Ray Devices Industry Volume (K Unit) Forecast, by Application 2019 & 2032
- Table 73: Peru APAC Portable X-Ray Devices Industry Revenue (Million) Forecast, by Application 2019 & 2032
- Table 74: Peru APAC Portable X-Ray Devices Industry Volume (K Unit) Forecast, by Application 2019 & 2032
- Table 75: Chile APAC Portable X-Ray Devices Industry Revenue (Million) Forecast, by Application 2019 & 2032
- Table 76: Chile APAC Portable X-Ray Devices Industry Volume (K Unit) Forecast, by Application 2019 & 2032
- Table 77: Colombia APAC Portable X-Ray Devices Industry Revenue (Million) Forecast, by Application 2019 & 2032
- Table 78: Colombia APAC Portable X-Ray Devices Industry Volume (K Unit) Forecast, by Application 2019 & 2032
- Table 79: Ecuador APAC Portable X-Ray Devices Industry Revenue (Million) Forecast, by Application 2019 & 2032
- Table 80: Ecuador APAC Portable X-Ray Devices Industry Volume (K Unit) Forecast, by Application 2019 & 2032
- Table 81: Venezuela APAC Portable X-Ray Devices Industry Revenue (Million) Forecast, by Application 2019 & 2032
- Table 82: Venezuela APAC Portable X-Ray Devices Industry Volume (K Unit) Forecast, by Application 2019 & 2032
- Table 83: Rest of South America APAC Portable X-Ray Devices Industry Revenue (Million) Forecast, by Application 2019 & 2032
- Table 84: Rest of South America APAC Portable X-Ray Devices Industry Volume (K Unit) Forecast, by Application 2019 & 2032
- Table 85: Global APAC Portable X-Ray Devices Industry Revenue Million Forecast, by Country 2019 & 2032
- Table 86: Global APAC Portable X-Ray Devices Industry Volume K Unit Forecast, by Country 2019 & 2032
- Table 87: United Arab Emirates APAC Portable X-Ray Devices Industry Revenue (Million) Forecast, by Application 2019 & 2032
- Table 88: United Arab Emirates APAC Portable X-Ray Devices Industry Volume (K Unit) Forecast, by Application 2019 & 2032
- Table 89: Saudi Arabia APAC Portable X-Ray Devices Industry Revenue (Million) Forecast, by Application 2019 & 2032
- Table 90: Saudi Arabia APAC Portable X-Ray Devices Industry Volume (K Unit) Forecast, by Application 2019 & 2032
- Table 91: South Africa APAC Portable X-Ray Devices Industry Revenue (Million) Forecast, by Application 2019 & 2032
- Table 92: South Africa APAC Portable X-Ray Devices Industry Volume (K Unit) Forecast, by Application 2019 & 2032
- Table 93: Rest of Middle East and Africa APAC Portable X-Ray Devices Industry Revenue (Million) Forecast, by Application 2019 & 2032
- Table 94: Rest of Middle East and Africa APAC Portable X-Ray Devices Industry Volume (K Unit) Forecast, by Application 2019 & 2032
- Table 95: Global APAC Portable X-Ray Devices Industry Revenue Million Forecast, by Technology 2019 & 2032
- Table 96: Global APAC Portable X-Ray Devices Industry Volume K Unit Forecast, by Technology 2019 & 2032
- Table 97: Global APAC Portable X-Ray Devices Industry Revenue Million Forecast, by Application 2019 & 2032
- Table 98: Global APAC Portable X-Ray Devices Industry Volume K Unit Forecast, by Application 2019 & 2032
- Table 99: Global APAC Portable X-Ray Devices Industry Revenue Million Forecast, by Modality 2019 & 2032
- Table 100: Global APAC Portable X-Ray Devices Industry Volume K Unit Forecast, by Modality 2019 & 2032
- Table 101: Global APAC Portable X-Ray Devices Industry Revenue Million Forecast, by Geography 2019 & 2032
- Table 102: Global APAC Portable X-Ray Devices Industry Volume K Unit Forecast, by Geography 2019 & 2032
- Table 103: Global APAC Portable X-Ray Devices Industry Revenue Million Forecast, by Country 2019 & 2032
- Table 104: Global APAC Portable X-Ray Devices Industry Volume K Unit Forecast, by Country 2019 & 2032
- Table 105: Global APAC Portable X-Ray Devices Industry Revenue Million Forecast, by Technology 2019 & 2032
- Table 106: Global APAC Portable X-Ray Devices Industry Volume K Unit Forecast, by Technology 2019 & 2032
- Table 107: Global APAC Portable X-Ray Devices Industry Revenue Million Forecast, by Application 2019 & 2032
- Table 108: Global APAC Portable X-Ray Devices Industry Volume K Unit Forecast, by Application 2019 & 2032
- Table 109: Global APAC Portable X-Ray Devices Industry Revenue Million Forecast, by Modality 2019 & 2032
- Table 110: Global APAC Portable X-Ray Devices Industry Volume K Unit Forecast, by Modality 2019 & 2032
- Table 111: Global APAC Portable X-Ray Devices Industry Revenue Million Forecast, by Geography 2019 & 2032
- Table 112: Global APAC Portable X-Ray Devices Industry Volume K Unit Forecast, by Geography 2019 & 2032
- Table 113: Global APAC Portable X-Ray Devices Industry Revenue Million Forecast, by Country 2019 & 2032
- Table 114: Global APAC Portable X-Ray Devices Industry Volume K Unit Forecast, by Country 2019 & 2032
- Table 115: Global APAC Portable X-Ray Devices Industry Revenue Million Forecast, by Technology 2019 & 2032
- Table 116: Global APAC Portable X-Ray Devices Industry Volume K Unit Forecast, by Technology 2019 & 2032
- Table 117: Global APAC Portable X-Ray Devices Industry Revenue Million Forecast, by Application 2019 & 2032
- Table 118: Global APAC Portable X-Ray Devices Industry Volume K Unit Forecast, by Application 2019 & 2032
- Table 119: Global APAC Portable X-Ray Devices Industry Revenue Million Forecast, by Modality 2019 & 2032
- Table 120: Global APAC Portable X-Ray Devices Industry Volume K Unit Forecast, by Modality 2019 & 2032
- Table 121: Global APAC Portable X-Ray Devices Industry Revenue Million Forecast, by Geography 2019 & 2032
- Table 122: Global APAC Portable X-Ray Devices Industry Volume K Unit Forecast, by Geography 2019 & 2032
- Table 123: Global APAC Portable X-Ray Devices Industry Revenue Million Forecast, by Country 2019 & 2032
- Table 124: Global APAC Portable X-Ray Devices Industry Volume K Unit Forecast, by Country 2019 & 2032
- Table 125: Global APAC Portable X-Ray Devices Industry Revenue Million Forecast, by Technology 2019 & 2032
- Table 126: Global APAC Portable X-Ray Devices Industry Volume K Unit Forecast, by Technology 2019 & 2032
- Table 127: Global APAC Portable X-Ray Devices Industry Revenue Million Forecast, by Application 2019 & 2032
- Table 128: Global APAC Portable X-Ray Devices Industry Volume K Unit Forecast, by Application 2019 & 2032
- Table 129: Global APAC Portable X-Ray Devices Industry Revenue Million Forecast, by Modality 2019 & 2032
- Table 130: Global APAC Portable X-Ray Devices Industry Volume K Unit Forecast, by Modality 2019 & 2032
- Table 131: Global APAC Portable X-Ray Devices Industry Revenue Million Forecast, by Geography 2019 & 2032
- Table 132: Global APAC Portable X-Ray Devices Industry Volume K Unit Forecast, by Geography 2019 & 2032
- Table 133: Global APAC Portable X-Ray Devices Industry Revenue Million Forecast, by Country 2019 & 2032
- Table 134: Global APAC Portable X-Ray Devices Industry Volume K Unit Forecast, by Country 2019 & 2032
- Table 135: Global APAC Portable X-Ray Devices Industry Revenue Million Forecast, by Technology 2019 & 2032
- Table 136: Global APAC Portable X-Ray Devices Industry Volume K Unit Forecast, by Technology 2019 & 2032
- Table 137: Global APAC Portable X-Ray Devices Industry Revenue Million Forecast, by Application 2019 & 2032
- Table 138: Global APAC Portable X-Ray Devices Industry Volume K Unit Forecast, by Application 2019 & 2032
- Table 139: Global APAC Portable X-Ray Devices Industry Revenue Million Forecast, by Modality 2019 & 2032
- Table 140: Global APAC Portable X-Ray Devices Industry Volume K Unit Forecast, by Modality 2019 & 2032
- Table 141: Global APAC Portable X-Ray Devices Industry Revenue Million Forecast, by Geography 2019 & 2032
- Table 142: Global APAC Portable X-Ray Devices Industry Volume K Unit Forecast, by Geography 2019 & 2032
- Table 143: Global APAC Portable X-Ray Devices Industry Revenue Million Forecast, by Country 2019 & 2032
- Table 144: Global APAC Portable X-Ray Devices Industry Volume K Unit Forecast, by Country 2019 & 2032
- Table 145: Global APAC Portable X-Ray Devices Industry Revenue Million Forecast, by Technology 2019 & 2032
- Table 146: Global APAC Portable X-Ray Devices Industry Volume K Unit Forecast, by Technology 2019 & 2032
- Table 147: Global APAC Portable X-Ray Devices Industry Revenue Million Forecast, by Application 2019 & 2032
- Table 148: Global APAC Portable X-Ray Devices Industry Volume K Unit Forecast, by Application 2019 & 2032
- Table 149: Global APAC Portable X-Ray Devices Industry Revenue Million Forecast, by Modality 2019 & 2032
- Table 150: Global APAC Portable X-Ray Devices Industry Volume K Unit Forecast, by Modality 2019 & 2032
- Table 151: Global APAC Portable X-Ray Devices Industry Revenue Million Forecast, by Geography 2019 & 2032
- Table 152: Global APAC Portable X-Ray Devices Industry Volume K Unit Forecast, by Geography 2019 & 2032
- Table 153: Global APAC Portable X-Ray Devices Industry Revenue Million Forecast, by Country 2019 & 2032
- Table 154: Global APAC Portable X-Ray Devices Industry Volume K Unit Forecast, by Country 2019 & 2032
Frequently Asked Questions
1. What is the projected Compound Annual Growth Rate (CAGR) of the APAC Portable X-Ray Devices Industry?
The projected CAGR is approximately 10.75%.
2. Which companies are prominent players in the APAC Portable X-Ray Devices Industry?
Key companies in the market include Samsung Group, Canon Inc, Hologic Inc, Hitachi Ltd, Koninklijke Philips N V, Siemens AG, GE Healthcare, Carestream Health Inc, Shimadzu Corporation, Fujifilm Holdings Corporation.
3. What are the main segments of the APAC Portable X-Ray Devices Industry?
The market segments include Technology, Application, Modality, Geography.
4. Can you provide details about the market size?
The market size is estimated to be USD 1.54 Million as of 2022.
5. What are some drivers contributing to market growth?
Rising Burden of Diseases Requiring Diagnosis; Rising Technological Advancement of X-Ray Devices.
6. What are the notable trends driving market growth?
Mammography Segment is Expected to Grow With a Significant CAGR Over the Forecast Period of the Study.
7. Are there any restraints impacting market growth?
High Costs of Devices.
8. Can you provide examples of recent developments in the market?
February 2023: Carestream Health India launched its high-powered Carestream Motion Mobile X-ray system. The system is fully equipped to carry out a full range of general radiography examinations.
9. What pricing options are available for accessing the report?
Pricing options include single-user, multi-user, and enterprise licenses priced at USD 4750, USD 5250, and USD 8750 respectively.
10. Is the market size provided in terms of value or volume?
The market size is provided in terms of value, measured in Million and volume, measured in K Unit.
11. Are there any specific market keywords associated with the report?
Yes, the market keyword associated with the report is "APAC Portable X-Ray Devices Industry," which aids in identifying and referencing the specific market segment covered.
12. How do I determine which pricing option suits my needs best?
The pricing options vary based on user requirements and access needs. Individual users may opt for single-user licenses, while businesses requiring broader access may choose multi-user or enterprise licenses for cost-effective access to the report.
13. Are there any additional resources or data provided in the APAC Portable X-Ray Devices Industry report?
While the report offers comprehensive insights, it's advisable to review the specific contents or supplementary materials provided to ascertain if additional resources or data are available.
14. How can I stay updated on further developments or reports in the APAC Portable X-Ray Devices Industry?
To stay informed about further developments, trends, and reports in the APAC Portable X-Ray Devices Industry, consider subscribing to industry newsletters, following relevant companies and organizations, or regularly checking reputable industry news sources and publications.
Methodology
Step 1 - Identification of Relevant Samples Size from Population Database


Step 2 - Approaches for Defining Global Market Size (Value, Volume* & Price*)

Note*: In applicable scenarios
Step 3 - Data Sources
Primary Research
- Web Analytics
- Survey Reports
- Research Institute
- Latest Research Reports
- Opinion Leaders
Secondary Research
- Annual Reports
- White Paper
- Latest Press Release
- Industry Association
- Paid Database
- Investor Presentations

Step 4 - Data Triangulation
Involves using different sources of information in order to increase the validity of a study
These sources are likely to be stakeholders in a program - participants, other researchers, program staff, other community members, and so on.
Then we put all data in single framework & apply various statistical tools to find out the dynamic on the market.
During the analysis stage, feedback from the stakeholder groups would be compared to determine areas of agreement as well as areas of divergence
