

Key Insights
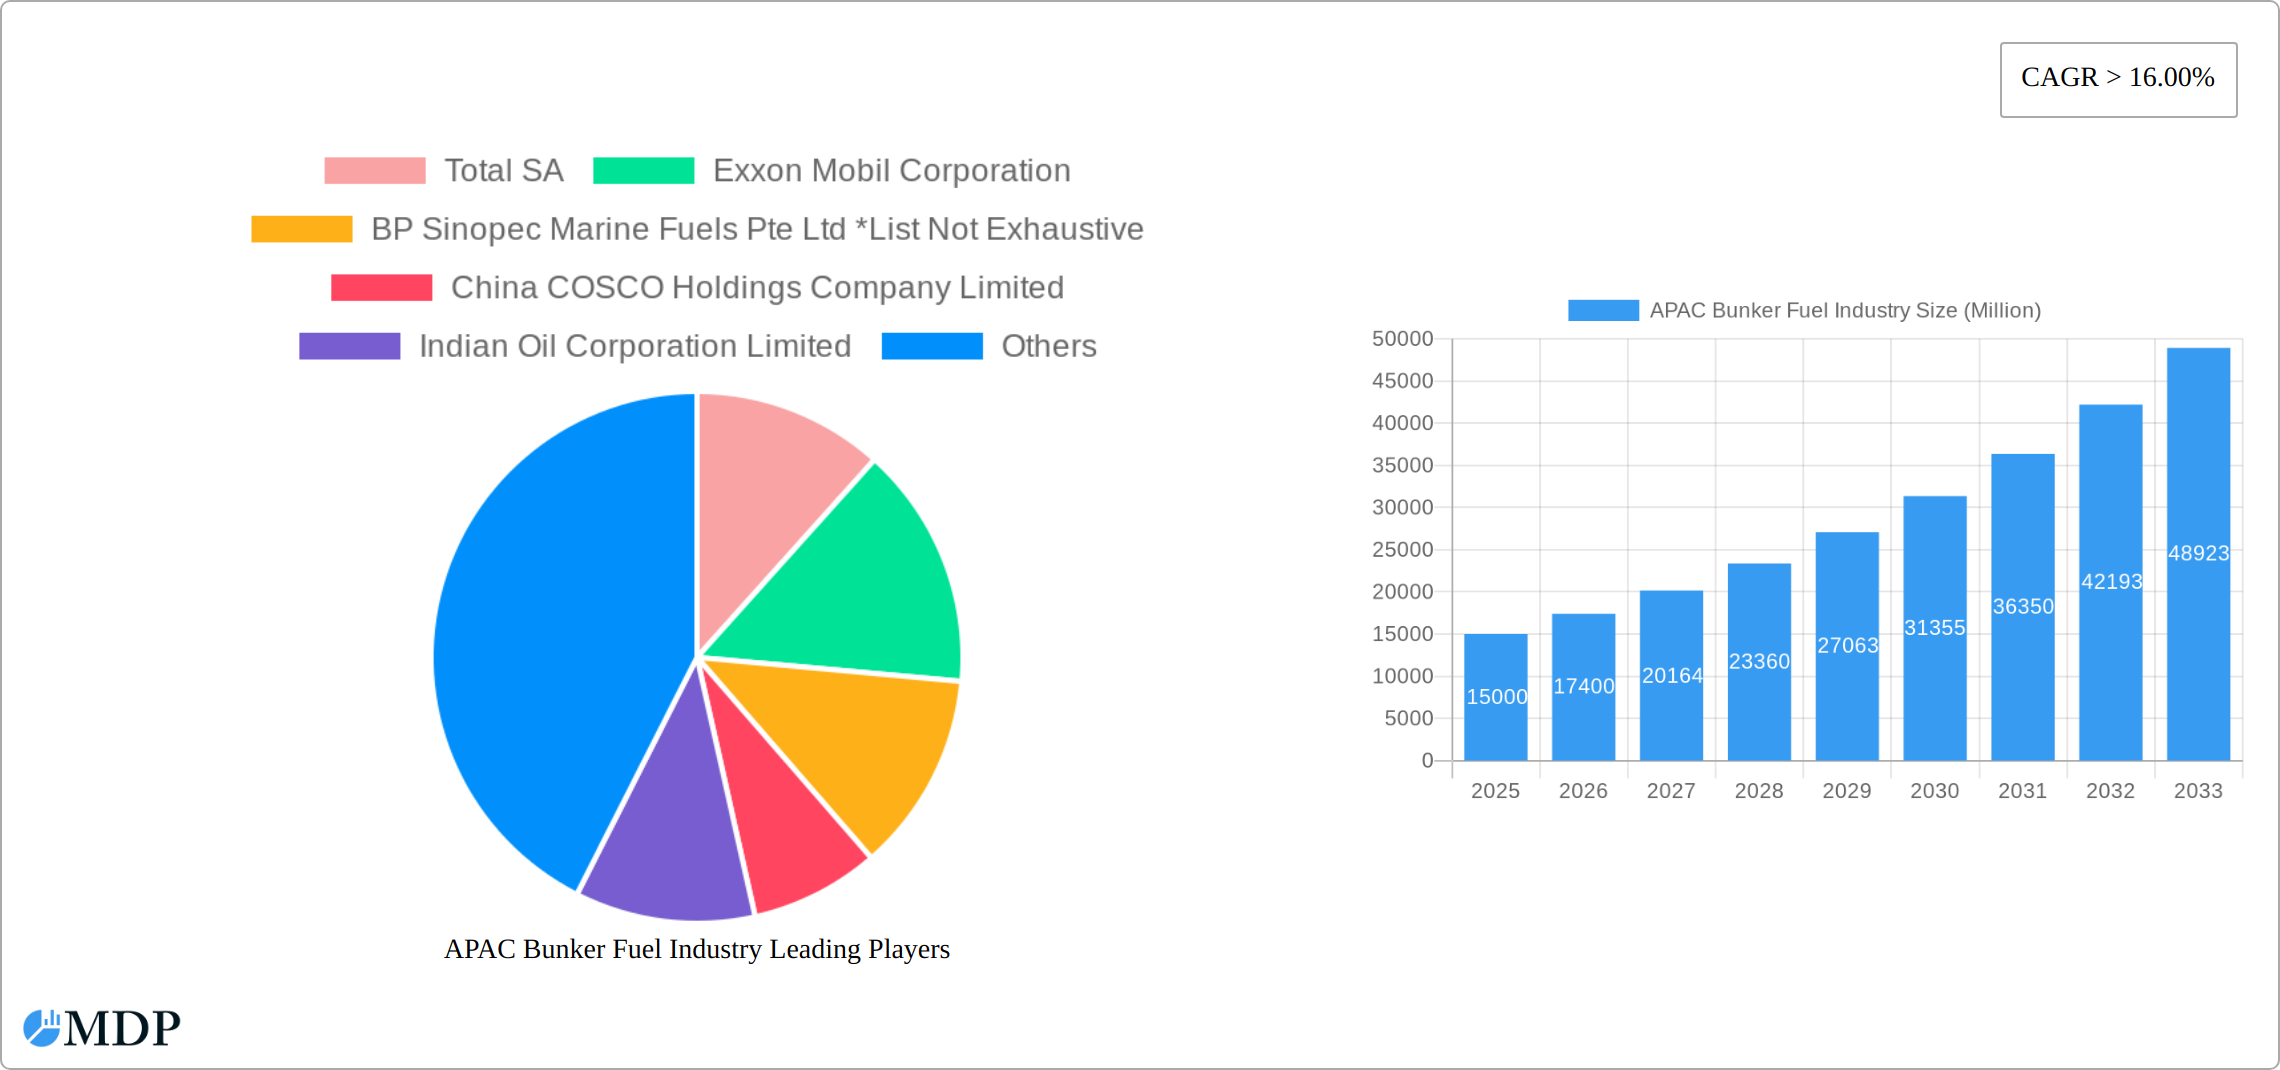
The Asia-Pacific (APAC) bunker fuel market is experiencing robust growth, driven by the region's expanding maritime trade and increasing demand for efficient and environmentally friendly fuels. The market's Compound Annual Growth Rate (CAGR) exceeding 16% indicates significant potential for expansion through 2033. Key drivers include the burgeoning economies of China, India, and Southeast Asia, which are fueling increased maritime activity and subsequently, bunker fuel consumption. The shift towards cleaner fuels like Very-Low Sulfur Fuel Oil (VLSFO) and Liquefied Natural Gas (LNG) is a prominent trend, largely driven by stricter environmental regulations aimed at reducing sulfur emissions and greenhouse gas impact. This transition is impacting the market share of traditional High Sulfur Fuel Oil (HSFO). However, the market faces restraints such as fluctuating crude oil prices, geopolitical instability impacting fuel supply chains, and the ongoing development and adoption of alternative marine fuels. The segment breakdown reveals a significant contribution from container and tanker vessels, reflecting the dominance of these vessel types in the region's trade. Major players such as Total SA, ExxonMobil, BP, and Sinopec are actively competing in this dynamic market, investing in infrastructure and supply chain optimization to cater to the growing demand. The diverse regional landscape within APAC presents both opportunities and challenges, with varying regulatory frameworks and economic growth rates influencing fuel consumption patterns across countries like China, Japan, India, and Australia. Further growth is expected as port infrastructure expands and regional trade continues its upward trajectory.
The market's future trajectory is closely linked to global economic growth, stringent environmental regulations, and the technological advancements in alternative fuels. While VLSFO currently dominates the fuel type segment, LNG adoption is expected to accelerate, particularly in larger vessels, driven by increasingly stringent emission control areas (ECAs) and incentives for cleaner technologies. The competitive landscape is intensifying, with existing players investing heavily in infrastructure and exploring new fuel supply solutions while new entrants leverage technological advancements and niche market strategies. The diverse vessel types within the APAC region create a nuanced market, with specific fuel needs varying based on vessel size, type, and operational requirements. Careful monitoring of the evolving regulatory environment, technological innovations, and geopolitical factors will be crucial for navigating this dynamic market successfully.
APAC Bunker Fuel Industry Report: 2019-2033 Forecast
Dive deep into the dynamic APAC bunker fuel market with this comprehensive report, providing actionable insights for strategic decision-making. This in-depth analysis covers the period from 2019 to 2033, with a focus on 2025, offering a detailed understanding of market dynamics, growth drivers, challenges, and opportunities. The report utilizes extensive data analysis to provide accurate projections and valuable market intelligence for industry stakeholders.
APAC Bunker Fuel Industry Market Dynamics & Concentration
This section analyzes the competitive landscape of the APAC bunker fuel market, exploring market concentration, innovation drivers, regulatory frameworks, product substitutes, end-user trends, and M&A activities. The study period spans 2019-2033, with 2025 serving as the base and estimated year.
- Market Concentration: The APAC bunker fuel market exhibits a moderately concentrated structure, with key players such as Total SA, Exxon Mobil Corporation, and BP Sinopec Marine Fuels Pte Ltd holding significant market share. However, the presence of numerous smaller players creates a dynamic competitive environment. Market share data for 2025 estimates that Total SA holds approximately 15%, ExxonMobil at 12%, and BP Sinopec at 10%, with the remaining share distributed among other companies.
- Innovation Drivers: Stringent environmental regulations, particularly concerning sulfur content in marine fuels, are driving innovation toward cleaner fuel alternatives like VLSFO and LNG. Technological advancements in fuel efficiency and emission control systems also contribute to market dynamism.
- Regulatory Frameworks: The International Maritime Organization (IMO) 2020 sulfur cap significantly impacted the market, accelerating the shift from HSFO to VLSFO. Regional regulations further shape the market landscape.
- Product Substitutes: The increasing adoption of LNG as a marine fuel presents a significant challenge to traditional bunker fuels. The development and deployment of alternative fuels such as biofuels and hydrogen also pose potential future disruption.
- End-User Trends: The growth of container shipping and the expansion of trade within the APAC region are key factors influencing bunker fuel demand. Fuel consumption patterns vary across vessel types, with larger vessels like tankers and bulk carriers consuming significantly more fuel.
- M&A Activities: The number of M&A deals within the APAC bunker fuel industry has averaged xx per year during the historical period (2019-2024). Consolidation is expected to continue, driven by the need for economies of scale and access to new technologies.
APAC Bunker Fuel Industry Industry Trends & Analysis
This section delves into the key trends shaping the APAC bunker fuel market. We analyze market growth drivers, technological disruptions, consumer preferences, and competitive dynamics. The data analyzed spans the study period 2019-2033, with a detailed focus on the forecast period 2025-2033.
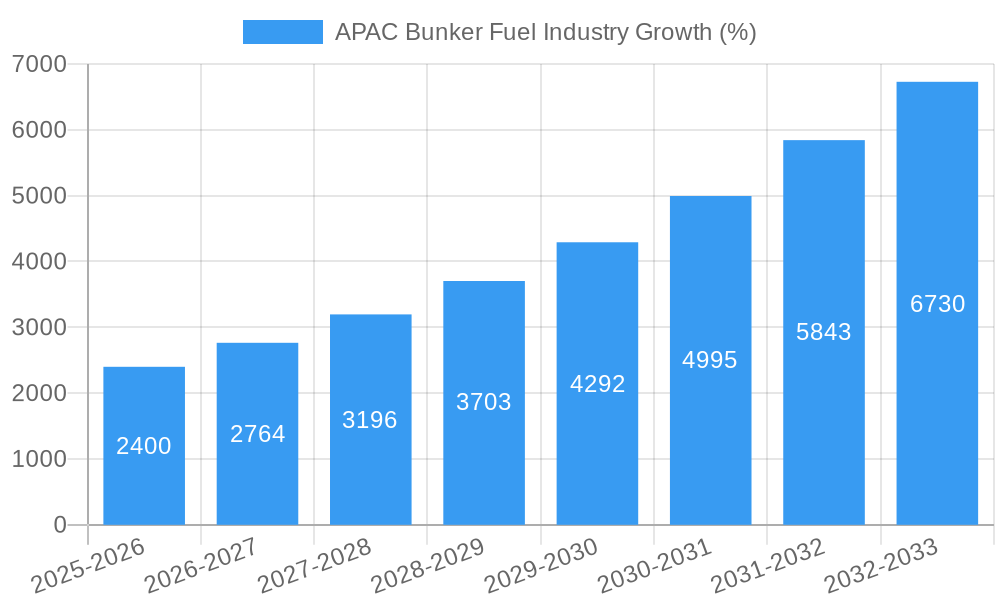
The APAC bunker fuel market is projected to experience robust growth, driven by increasing global trade, particularly within the region. The rising demand for maritime transport, coupled with expanding port infrastructure, is a significant growth catalyst. The compound annual growth rate (CAGR) for the forecast period (2025-2033) is estimated at xx%. Technological advancements in fuel efficiency and emission reduction technologies are also contributing to market expansion, albeit with varied market penetration rates among different vessel types. The shift toward cleaner fuels, mandated by stringent environmental regulations, is creating opportunities for new players and technologies. Increased investments in renewable energy sources will influence the industry's shift towards cleaner energy solutions, though the transition rate varies across regional markets.
Leading Markets & Segments in APAC Bunker Fuel Industry
This section identifies the dominant regions, countries, and segments within the APAC bunker fuel market, analyzing key drivers such as economic policies and infrastructure development. The analysis covers both fuel types (HSFO, VLSFO, MGO, LNG, Others) and vessel types (Containers, Tankers, General Cargo, Bulk Carriers, Others).
Dominant Segments:
- Fuel Type: VLSFO is the dominant fuel type, driven by the IMO 2020 sulfur cap. However, LNG is rapidly gaining traction due to its environmental benefits. MGO continues to hold a significant market share, particularly among smaller vessels.
- Vessel Type: Tankers and bulk carriers constitute the largest consumers of bunker fuel, owing to their size and extensive operational range. Container ships also account for a substantial share of fuel consumption due to the booming global trade.
Key Drivers:
- Strong Economic Growth: The robust economic growth of many APAC countries fuels trade and maritime activity, increasing demand for bunker fuels.
- Expanding Port Infrastructure: Continued investment in port infrastructure enhances shipping capacity and trade efficiency, positively impacting bunker fuel demand.
- Government Initiatives: Government policies promoting maritime trade and sustainable shipping practices shape the bunker fuel market dynamics.
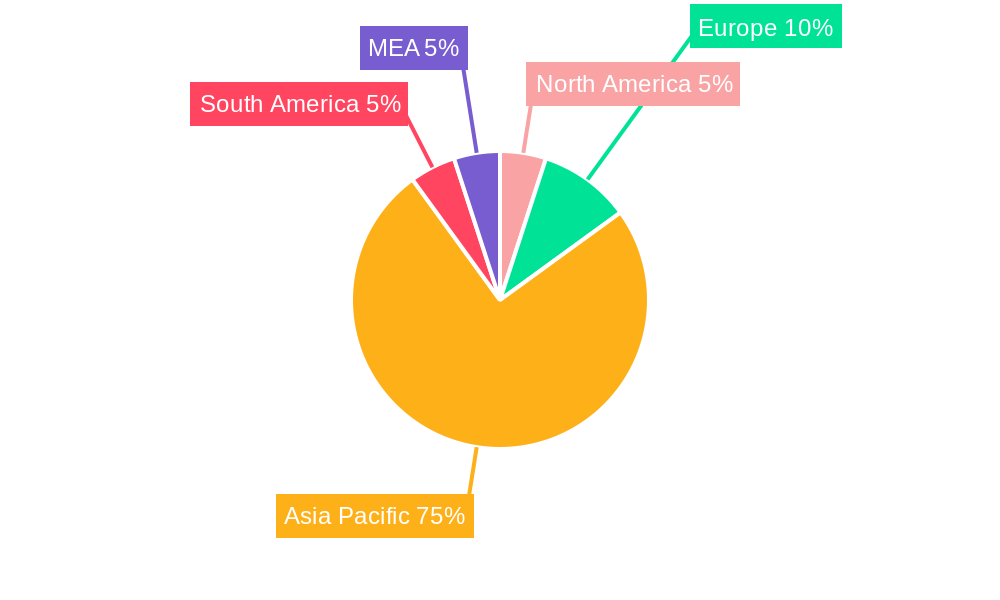
China and Singapore stand out as leading markets, reflecting their significance as major shipping hubs and trading centers. The market's dominance varies slightly depending on the fuel type and vessel category.
APAC Bunker Fuel Industry Product Developments
Recent product innovations focus on cleaner and more efficient fuels, particularly VLSFO and LNG. Technological advancements in fuel blends and additives aim to optimize engine performance and reduce emissions. Companies are investing in R&D to develop alternative fuels such as biofuels and hydrogen, though their market penetration remains limited at present. These product developments aim to meet evolving regulatory requirements and cater to increasing environmental concerns.
Key Drivers of APAC Bunker Fuel Industry Growth
Several factors are driving the growth of the APAC bunker fuel industry. The expansion of global trade, particularly within the APAC region, is a major driver. Economic growth in several APAC countries is increasing demand for maritime transport. Stringent environmental regulations and the global shift toward cleaner fuels are also creating significant growth opportunities. Finally, ongoing investments in port infrastructure and improved logistics are supporting the industry's expansion.
Challenges in the APAC Bunker Fuel Industry Market
The APAC bunker fuel industry faces several challenges. Fluctuating oil prices create price volatility, impacting profitability. Stricter environmental regulations necessitate expensive upgrades and transitions to cleaner fuels, posing a financial burden on some operators. Competition from new entrants and the potential for alternative fuels such as LNG and biofuels also present significant challenges. Supply chain disruptions due to geopolitical events can impact fuel availability and pricing. These factors may hinder market growth in the short term.
Emerging Opportunities in APAC Bunker Fuel Industry
The APAC bunker fuel industry presents several exciting opportunities. The growing adoption of LNG as a marine fuel offers significant potential. Technological advancements in fuel efficiency and emission reduction technologies present opportunities for innovation. Strategic partnerships between fuel suppliers and shipping companies can lead to optimized fuel procurement and supply chain management. Expansion into new markets and diversification of fuel sources will facilitate sustainable growth.
Leading Players in the APAC Bunker Fuel Industry Sector
- Total SA
- Exxon Mobil Corporation
- BP Sinopec Marine Fuels Pte Ltd
- China COSCO Holdings Company Limited
- Indian Oil Corporation Limited
- Royal Dutch Shell PLC
- Ocean Network Express PTE Ltd
- Chimbusco Pan Nation Petro-Chemical Co Ltd
Key Milestones in APAC Bunker Fuel Industry Industry
- 2019: IMO 2020 sulfur cap comes into effect, significantly impacting the bunker fuel market.
- 2020: Several major players invest heavily in LNG bunkering infrastructure.
- 2021: Several new VLSFO blends are introduced, improving efficiency and emission control.
- 2022: Increased focus on biofuels and other alternative fuels for maritime transport begins.
- 2023: Several strategic partnerships are formed for the development and deployment of cleaner fuel solutions. (Further milestones for 2024 and beyond will be included in the final report).
Strategic Outlook for APAC Bunker Fuel Industry Market
The APAC bunker fuel market is poised for continued growth, driven by increasing regional trade and a gradual shift towards cleaner fuels. Strategic opportunities lie in investments in LNG bunkering infrastructure and alternative fuel development. Partnerships focused on optimizing fuel efficiency and reducing emissions will play a crucial role. The market is expected to witness both consolidation among existing players and the emergence of new entrants offering innovative fuel solutions. The long-term outlook is positive, contingent on sustained economic growth and proactive environmental policy implementation.
APAC Bunker Fuel Industry Segmentation
-
1. Fuel Type
- 1.1. High Sulfur Fuel Oil (HSFO)
- 1.2. Very-Low Sulfur Fuel Oil (VLSFO)
- 1.3. Marine Gas Oil (MGO)
- 1.4. Liquefied Natural Gas (MGO)
- 1.5. Others
-
2. Vessel Type
- 2.1. Containers
- 2.2. Tankers
- 2.3. General Cargo
- 2.4. Bulk Carrier
- 2.5. Others
-
3. Geography
- 3.1. China
- 3.2. India
- 3.3. Singapore
- 3.4. Rest of Asia-Pacific
APAC Bunker Fuel Industry Segmentation By Geography
- 1. China
- 2. India
- 3. Singapore
- 4. Rest of Asia Pacific
APAC Bunker Fuel Industry REPORT HIGHLIGHTS
| Aspects | Details |
|---|---|
| Study Period | 2019-2033 |
| Base Year | 2024 |
| Estimated Year | 2025 |
| Forecast Period | 2025-2033 |
| Historical Period | 2019-2024 |
| Growth Rate | CAGR of > 16.00% from 2019-2033 |
| Segmentation |
|
Table of Contents
- 1. Introduction
- 1.1. Research Scope
- 1.2. Market Segmentation
- 1.3. Research Methodology
- 1.4. Definitions and Assumptions
- 2. Executive Summary
- 2.1. Introduction
- 3. Market Dynamics
- 3.1. Introduction
- 3.2. Market Drivers
- 3.2.1. Increasing Demand for Oil and Gas4.; Presence of Proven Oil and Gas Reserves
- 3.3. Market Restrains
- 3.3.1. Volatile Oil and Gas Prices
- 3.4. Market Trends
- 3.4.1. VLSFO to Witness Significant Growth
- 4. Market Factor Analysis
- 4.1. Porters Five Forces
- 4.2. Supply/Value Chain
- 4.3. PESTEL analysis
- 4.4. Market Entropy
- 4.5. Patent/Trademark Analysis
- 5. Global APAC Bunker Fuel Industry Analysis, Insights and Forecast, 2019-2031
- 5.1. Market Analysis, Insights and Forecast - by Fuel Type
- 5.1.1. High Sulfur Fuel Oil (HSFO)
- 5.1.2. Very-Low Sulfur Fuel Oil (VLSFO)
- 5.1.3. Marine Gas Oil (MGO)
- 5.1.4. Liquefied Natural Gas (MGO)
- 5.1.5. Others
- 5.2. Market Analysis, Insights and Forecast - by Vessel Type
- 5.2.1. Containers
- 5.2.2. Tankers
- 5.2.3. General Cargo
- 5.2.4. Bulk Carrier
- 5.2.5. Others
- 5.3. Market Analysis, Insights and Forecast - by Geography
- 5.3.1. China
- 5.3.2. India
- 5.3.3. Singapore
- 5.3.4. Rest of Asia-Pacific
- 5.4. Market Analysis, Insights and Forecast - by Region
- 5.4.1. China
- 5.4.2. India
- 5.4.3. Singapore
- 5.4.4. Rest of Asia Pacific
- 5.1. Market Analysis, Insights and Forecast - by Fuel Type
- 6. China APAC Bunker Fuel Industry Analysis, Insights and Forecast, 2019-2031
- 6.1. Market Analysis, Insights and Forecast - by Fuel Type
- 6.1.1. High Sulfur Fuel Oil (HSFO)
- 6.1.2. Very-Low Sulfur Fuel Oil (VLSFO)
- 6.1.3. Marine Gas Oil (MGO)
- 6.1.4. Liquefied Natural Gas (MGO)
- 6.1.5. Others
- 6.2. Market Analysis, Insights and Forecast - by Vessel Type
- 6.2.1. Containers
- 6.2.2. Tankers
- 6.2.3. General Cargo
- 6.2.4. Bulk Carrier
- 6.2.5. Others
- 6.3. Market Analysis, Insights and Forecast - by Geography
- 6.3.1. China
- 6.3.2. India
- 6.3.3. Singapore
- 6.3.4. Rest of Asia-Pacific
- 6.1. Market Analysis, Insights and Forecast - by Fuel Type
- 7. India APAC Bunker Fuel Industry Analysis, Insights and Forecast, 2019-2031
- 7.1. Market Analysis, Insights and Forecast - by Fuel Type
- 7.1.1. High Sulfur Fuel Oil (HSFO)
- 7.1.2. Very-Low Sulfur Fuel Oil (VLSFO)
- 7.1.3. Marine Gas Oil (MGO)
- 7.1.4. Liquefied Natural Gas (MGO)
- 7.1.5. Others
- 7.2. Market Analysis, Insights and Forecast - by Vessel Type
- 7.2.1. Containers
- 7.2.2. Tankers
- 7.2.3. General Cargo
- 7.2.4. Bulk Carrier
- 7.2.5. Others
- 7.3. Market Analysis, Insights and Forecast - by Geography
- 7.3.1. China
- 7.3.2. India
- 7.3.3. Singapore
- 7.3.4. Rest of Asia-Pacific
- 7.1. Market Analysis, Insights and Forecast - by Fuel Type
- 8. Singapore APAC Bunker Fuel Industry Analysis, Insights and Forecast, 2019-2031
- 8.1. Market Analysis, Insights and Forecast - by Fuel Type
- 8.1.1. High Sulfur Fuel Oil (HSFO)
- 8.1.2. Very-Low Sulfur Fuel Oil (VLSFO)
- 8.1.3. Marine Gas Oil (MGO)
- 8.1.4. Liquefied Natural Gas (MGO)
- 8.1.5. Others
- 8.2. Market Analysis, Insights and Forecast - by Vessel Type
- 8.2.1. Containers
- 8.2.2. Tankers
- 8.2.3. General Cargo
- 8.2.4. Bulk Carrier
- 8.2.5. Others
- 8.3. Market Analysis, Insights and Forecast - by Geography
- 8.3.1. China
- 8.3.2. India
- 8.3.3. Singapore
- 8.3.4. Rest of Asia-Pacific
- 8.1. Market Analysis, Insights and Forecast - by Fuel Type
- 9. Rest of Asia Pacific APAC Bunker Fuel Industry Analysis, Insights and Forecast, 2019-2031
- 9.1. Market Analysis, Insights and Forecast - by Fuel Type
- 9.1.1. High Sulfur Fuel Oil (HSFO)
- 9.1.2. Very-Low Sulfur Fuel Oil (VLSFO)
- 9.1.3. Marine Gas Oil (MGO)
- 9.1.4. Liquefied Natural Gas (MGO)
- 9.1.5. Others
- 9.2. Market Analysis, Insights and Forecast - by Vessel Type
- 9.2.1. Containers
- 9.2.2. Tankers
- 9.2.3. General Cargo
- 9.2.4. Bulk Carrier
- 9.2.5. Others
- 9.3. Market Analysis, Insights and Forecast - by Geography
- 9.3.1. China
- 9.3.2. India
- 9.3.3. Singapore
- 9.3.4. Rest of Asia-Pacific
- 9.1. Market Analysis, Insights and Forecast - by Fuel Type
- 10. North America APAC Bunker Fuel Industry Analysis, Insights and Forecast, 2019-2031
- 10.1. Market Analysis, Insights and Forecast - By Country/Sub-region
- 10.1.1 United States
- 10.1.2 Canada
- 10.1.3 Mexico
- 11. Europe APAC Bunker Fuel Industry Analysis, Insights and Forecast, 2019-2031
- 11.1. Market Analysis, Insights and Forecast - By Country/Sub-region
- 11.1.1 Germany
- 11.1.2 United Kingdom
- 11.1.3 France
- 11.1.4 Spain
- 11.1.5 Italy
- 11.1.6 Spain
- 11.1.7 Belgium
- 11.1.8 Netherland
- 11.1.9 Nordics
- 11.1.10 Rest of Europe
- 12. Asia Pacific APAC Bunker Fuel Industry Analysis, Insights and Forecast, 2019-2031
- 12.1. Market Analysis, Insights and Forecast - By Country/Sub-region
- 12.1.1 China
- 12.1.2 Japan
- 12.1.3 India
- 12.1.4 South Korea
- 12.1.5 Southeast Asia
- 12.1.6 Australia
- 12.1.7 Indonesia
- 12.1.8 Phillipes
- 12.1.9 Singapore
- 12.1.10 Thailandc
- 12.1.11 Rest of Asia Pacific
- 13. South America APAC Bunker Fuel Industry Analysis, Insights and Forecast, 2019-2031
- 13.1. Market Analysis, Insights and Forecast - By Country/Sub-region
- 13.1.1 Brazil
- 13.1.2 Argentina
- 13.1.3 Peru
- 13.1.4 Chile
- 13.1.5 Colombia
- 13.1.6 Ecuador
- 13.1.7 Venezuela
- 13.1.8 Rest of South America
- 14. North America APAC Bunker Fuel Industry Analysis, Insights and Forecast, 2019-2031
- 14.1. Market Analysis, Insights and Forecast - By Country/Sub-region
- 14.1.1 United States
- 14.1.2 Canada
- 14.1.3 Mexico
- 15. MEA APAC Bunker Fuel Industry Analysis, Insights and Forecast, 2019-2031
- 15.1. Market Analysis, Insights and Forecast - By Country/Sub-region
- 15.1.1 United Arab Emirates
- 15.1.2 Saudi Arabia
- 15.1.3 South Africa
- 15.1.4 Rest of Middle East and Africa
- 16. Competitive Analysis
- 16.1. Global Market Share Analysis 2024
- 16.2. Company Profiles
- 16.2.1 Total SA
- 16.2.1.1. Overview
- 16.2.1.2. Products
- 16.2.1.3. SWOT Analysis
- 16.2.1.4. Recent Developments
- 16.2.1.5. Financials (Based on Availability)
- 16.2.2 Exxon Mobil Corporation
- 16.2.2.1. Overview
- 16.2.2.2. Products
- 16.2.2.3. SWOT Analysis
- 16.2.2.4. Recent Developments
- 16.2.2.5. Financials (Based on Availability)
- 16.2.3 BP Sinopec Marine Fuels Pte Ltd *List Not Exhaustive
- 16.2.3.1. Overview
- 16.2.3.2. Products
- 16.2.3.3. SWOT Analysis
- 16.2.3.4. Recent Developments
- 16.2.3.5. Financials (Based on Availability)
- 16.2.4 China COSCO Holdings Company Limited
- 16.2.4.1. Overview
- 16.2.4.2. Products
- 16.2.4.3. SWOT Analysis
- 16.2.4.4. Recent Developments
- 16.2.4.5. Financials (Based on Availability)
- 16.2.5 Indian Oil Corporation Limited
- 16.2.5.1. Overview
- 16.2.5.2. Products
- 16.2.5.3. SWOT Analysis
- 16.2.5.4. Recent Developments
- 16.2.5.5. Financials (Based on Availability)
- 16.2.6 Royal Dutch Shell PLC
- 16.2.6.1. Overview
- 16.2.6.2. Products
- 16.2.6.3. SWOT Analysis
- 16.2.6.4. Recent Developments
- 16.2.6.5. Financials (Based on Availability)
- 16.2.7 Ocean Network Express PTE Ltd
- 16.2.7.1. Overview
- 16.2.7.2. Products
- 16.2.7.3. SWOT Analysis
- 16.2.7.4. Recent Developments
- 16.2.7.5. Financials (Based on Availability)
- 16.2.8 Chimbusco Pan Nation Petro-Chemical Co Ltd
- 16.2.8.1. Overview
- 16.2.8.2. Products
- 16.2.8.3. SWOT Analysis
- 16.2.8.4. Recent Developments
- 16.2.8.5. Financials (Based on Availability)
- 16.2.1 Total SA
List of Figures
- Figure 1: Global APAC Bunker Fuel Industry Revenue Breakdown (Million, %) by Region 2024 & 2032
- Figure 2: North America APAC Bunker Fuel Industry Revenue (Million), by Country 2024 & 2032
- Figure 3: North America APAC Bunker Fuel Industry Revenue Share (%), by Country 2024 & 2032
- Figure 4: Europe APAC Bunker Fuel Industry Revenue (Million), by Country 2024 & 2032
- Figure 5: Europe APAC Bunker Fuel Industry Revenue Share (%), by Country 2024 & 2032
- Figure 6: Asia Pacific APAC Bunker Fuel Industry Revenue (Million), by Country 2024 & 2032
- Figure 7: Asia Pacific APAC Bunker Fuel Industry Revenue Share (%), by Country 2024 & 2032
- Figure 8: South America APAC Bunker Fuel Industry Revenue (Million), by Country 2024 & 2032
- Figure 9: South America APAC Bunker Fuel Industry Revenue Share (%), by Country 2024 & 2032
- Figure 10: North America APAC Bunker Fuel Industry Revenue (Million), by Country 2024 & 2032
- Figure 11: North America APAC Bunker Fuel Industry Revenue Share (%), by Country 2024 & 2032
- Figure 12: MEA APAC Bunker Fuel Industry Revenue (Million), by Country 2024 & 2032
- Figure 13: MEA APAC Bunker Fuel Industry Revenue Share (%), by Country 2024 & 2032
- Figure 14: China APAC Bunker Fuel Industry Revenue (Million), by Fuel Type 2024 & 2032
- Figure 15: China APAC Bunker Fuel Industry Revenue Share (%), by Fuel Type 2024 & 2032
- Figure 16: China APAC Bunker Fuel Industry Revenue (Million), by Vessel Type 2024 & 2032
- Figure 17: China APAC Bunker Fuel Industry Revenue Share (%), by Vessel Type 2024 & 2032
- Figure 18: China APAC Bunker Fuel Industry Revenue (Million), by Geography 2024 & 2032
- Figure 19: China APAC Bunker Fuel Industry Revenue Share (%), by Geography 2024 & 2032
- Figure 20: China APAC Bunker Fuel Industry Revenue (Million), by Country 2024 & 2032
- Figure 21: China APAC Bunker Fuel Industry Revenue Share (%), by Country 2024 & 2032
- Figure 22: India APAC Bunker Fuel Industry Revenue (Million), by Fuel Type 2024 & 2032
- Figure 23: India APAC Bunker Fuel Industry Revenue Share (%), by Fuel Type 2024 & 2032
- Figure 24: India APAC Bunker Fuel Industry Revenue (Million), by Vessel Type 2024 & 2032
- Figure 25: India APAC Bunker Fuel Industry Revenue Share (%), by Vessel Type 2024 & 2032
- Figure 26: India APAC Bunker Fuel Industry Revenue (Million), by Geography 2024 & 2032
- Figure 27: India APAC Bunker Fuel Industry Revenue Share (%), by Geography 2024 & 2032
- Figure 28: India APAC Bunker Fuel Industry Revenue (Million), by Country 2024 & 2032
- Figure 29: India APAC Bunker Fuel Industry Revenue Share (%), by Country 2024 & 2032
- Figure 30: Singapore APAC Bunker Fuel Industry Revenue (Million), by Fuel Type 2024 & 2032
- Figure 31: Singapore APAC Bunker Fuel Industry Revenue Share (%), by Fuel Type 2024 & 2032
- Figure 32: Singapore APAC Bunker Fuel Industry Revenue (Million), by Vessel Type 2024 & 2032
- Figure 33: Singapore APAC Bunker Fuel Industry Revenue Share (%), by Vessel Type 2024 & 2032
- Figure 34: Singapore APAC Bunker Fuel Industry Revenue (Million), by Geography 2024 & 2032
- Figure 35: Singapore APAC Bunker Fuel Industry Revenue Share (%), by Geography 2024 & 2032
- Figure 36: Singapore APAC Bunker Fuel Industry Revenue (Million), by Country 2024 & 2032
- Figure 37: Singapore APAC Bunker Fuel Industry Revenue Share (%), by Country 2024 & 2032
- Figure 38: Rest of Asia Pacific APAC Bunker Fuel Industry Revenue (Million), by Fuel Type 2024 & 2032
- Figure 39: Rest of Asia Pacific APAC Bunker Fuel Industry Revenue Share (%), by Fuel Type 2024 & 2032
- Figure 40: Rest of Asia Pacific APAC Bunker Fuel Industry Revenue (Million), by Vessel Type 2024 & 2032
- Figure 41: Rest of Asia Pacific APAC Bunker Fuel Industry Revenue Share (%), by Vessel Type 2024 & 2032
- Figure 42: Rest of Asia Pacific APAC Bunker Fuel Industry Revenue (Million), by Geography 2024 & 2032
- Figure 43: Rest of Asia Pacific APAC Bunker Fuel Industry Revenue Share (%), by Geography 2024 & 2032
- Figure 44: Rest of Asia Pacific APAC Bunker Fuel Industry Revenue (Million), by Country 2024 & 2032
- Figure 45: Rest of Asia Pacific APAC Bunker Fuel Industry Revenue Share (%), by Country 2024 & 2032
List of Tables
- Table 1: Global APAC Bunker Fuel Industry Revenue Million Forecast, by Region 2019 & 2032
- Table 2: Global APAC Bunker Fuel Industry Revenue Million Forecast, by Fuel Type 2019 & 2032
- Table 3: Global APAC Bunker Fuel Industry Revenue Million Forecast, by Vessel Type 2019 & 2032
- Table 4: Global APAC Bunker Fuel Industry Revenue Million Forecast, by Geography 2019 & 2032
- Table 5: Global APAC Bunker Fuel Industry Revenue Million Forecast, by Region 2019 & 2032
- Table 6: Global APAC Bunker Fuel Industry Revenue Million Forecast, by Country 2019 & 2032
- Table 7: United States APAC Bunker Fuel Industry Revenue (Million) Forecast, by Application 2019 & 2032
- Table 8: Canada APAC Bunker Fuel Industry Revenue (Million) Forecast, by Application 2019 & 2032
- Table 9: Mexico APAC Bunker Fuel Industry Revenue (Million) Forecast, by Application 2019 & 2032
- Table 10: Global APAC Bunker Fuel Industry Revenue Million Forecast, by Country 2019 & 2032
- Table 11: Germany APAC Bunker Fuel Industry Revenue (Million) Forecast, by Application 2019 & 2032
- Table 12: United Kingdom APAC Bunker Fuel Industry Revenue (Million) Forecast, by Application 2019 & 2032
- Table 13: France APAC Bunker Fuel Industry Revenue (Million) Forecast, by Application 2019 & 2032
- Table 14: Spain APAC Bunker Fuel Industry Revenue (Million) Forecast, by Application 2019 & 2032
- Table 15: Italy APAC Bunker Fuel Industry Revenue (Million) Forecast, by Application 2019 & 2032
- Table 16: Spain APAC Bunker Fuel Industry Revenue (Million) Forecast, by Application 2019 & 2032
- Table 17: Belgium APAC Bunker Fuel Industry Revenue (Million) Forecast, by Application 2019 & 2032
- Table 18: Netherland APAC Bunker Fuel Industry Revenue (Million) Forecast, by Application 2019 & 2032
- Table 19: Nordics APAC Bunker Fuel Industry Revenue (Million) Forecast, by Application 2019 & 2032
- Table 20: Rest of Europe APAC Bunker Fuel Industry Revenue (Million) Forecast, by Application 2019 & 2032
- Table 21: Global APAC Bunker Fuel Industry Revenue Million Forecast, by Country 2019 & 2032
- Table 22: China APAC Bunker Fuel Industry Revenue (Million) Forecast, by Application 2019 & 2032
- Table 23: Japan APAC Bunker Fuel Industry Revenue (Million) Forecast, by Application 2019 & 2032
- Table 24: India APAC Bunker Fuel Industry Revenue (Million) Forecast, by Application 2019 & 2032
- Table 25: South Korea APAC Bunker Fuel Industry Revenue (Million) Forecast, by Application 2019 & 2032
- Table 26: Southeast Asia APAC Bunker Fuel Industry Revenue (Million) Forecast, by Application 2019 & 2032
- Table 27: Australia APAC Bunker Fuel Industry Revenue (Million) Forecast, by Application 2019 & 2032
- Table 28: Indonesia APAC Bunker Fuel Industry Revenue (Million) Forecast, by Application 2019 & 2032
- Table 29: Phillipes APAC Bunker Fuel Industry Revenue (Million) Forecast, by Application 2019 & 2032
- Table 30: Singapore APAC Bunker Fuel Industry Revenue (Million) Forecast, by Application 2019 & 2032
- Table 31: Thailandc APAC Bunker Fuel Industry Revenue (Million) Forecast, by Application 2019 & 2032
- Table 32: Rest of Asia Pacific APAC Bunker Fuel Industry Revenue (Million) Forecast, by Application 2019 & 2032
- Table 33: Global APAC Bunker Fuel Industry Revenue Million Forecast, by Country 2019 & 2032
- Table 34: Brazil APAC Bunker Fuel Industry Revenue (Million) Forecast, by Application 2019 & 2032
- Table 35: Argentina APAC Bunker Fuel Industry Revenue (Million) Forecast, by Application 2019 & 2032
- Table 36: Peru APAC Bunker Fuel Industry Revenue (Million) Forecast, by Application 2019 & 2032
- Table 37: Chile APAC Bunker Fuel Industry Revenue (Million) Forecast, by Application 2019 & 2032
- Table 38: Colombia APAC Bunker Fuel Industry Revenue (Million) Forecast, by Application 2019 & 2032
- Table 39: Ecuador APAC Bunker Fuel Industry Revenue (Million) Forecast, by Application 2019 & 2032
- Table 40: Venezuela APAC Bunker Fuel Industry Revenue (Million) Forecast, by Application 2019 & 2032
- Table 41: Rest of South America APAC Bunker Fuel Industry Revenue (Million) Forecast, by Application 2019 & 2032
- Table 42: Global APAC Bunker Fuel Industry Revenue Million Forecast, by Country 2019 & 2032
- Table 43: United States APAC Bunker Fuel Industry Revenue (Million) Forecast, by Application 2019 & 2032
- Table 44: Canada APAC Bunker Fuel Industry Revenue (Million) Forecast, by Application 2019 & 2032
- Table 45: Mexico APAC Bunker Fuel Industry Revenue (Million) Forecast, by Application 2019 & 2032
- Table 46: Global APAC Bunker Fuel Industry Revenue Million Forecast, by Country 2019 & 2032
- Table 47: United Arab Emirates APAC Bunker Fuel Industry Revenue (Million) Forecast, by Application 2019 & 2032
- Table 48: Saudi Arabia APAC Bunker Fuel Industry Revenue (Million) Forecast, by Application 2019 & 2032
- Table 49: South Africa APAC Bunker Fuel Industry Revenue (Million) Forecast, by Application 2019 & 2032
- Table 50: Rest of Middle East and Africa APAC Bunker Fuel Industry Revenue (Million) Forecast, by Application 2019 & 2032
- Table 51: Global APAC Bunker Fuel Industry Revenue Million Forecast, by Fuel Type 2019 & 2032
- Table 52: Global APAC Bunker Fuel Industry Revenue Million Forecast, by Vessel Type 2019 & 2032
- Table 53: Global APAC Bunker Fuel Industry Revenue Million Forecast, by Geography 2019 & 2032
- Table 54: Global APAC Bunker Fuel Industry Revenue Million Forecast, by Country 2019 & 2032
- Table 55: Global APAC Bunker Fuel Industry Revenue Million Forecast, by Fuel Type 2019 & 2032
- Table 56: Global APAC Bunker Fuel Industry Revenue Million Forecast, by Vessel Type 2019 & 2032
- Table 57: Global APAC Bunker Fuel Industry Revenue Million Forecast, by Geography 2019 & 2032
- Table 58: Global APAC Bunker Fuel Industry Revenue Million Forecast, by Country 2019 & 2032
- Table 59: Global APAC Bunker Fuel Industry Revenue Million Forecast, by Fuel Type 2019 & 2032
- Table 60: Global APAC Bunker Fuel Industry Revenue Million Forecast, by Vessel Type 2019 & 2032
- Table 61: Global APAC Bunker Fuel Industry Revenue Million Forecast, by Geography 2019 & 2032
- Table 62: Global APAC Bunker Fuel Industry Revenue Million Forecast, by Country 2019 & 2032
- Table 63: Global APAC Bunker Fuel Industry Revenue Million Forecast, by Fuel Type 2019 & 2032
- Table 64: Global APAC Bunker Fuel Industry Revenue Million Forecast, by Vessel Type 2019 & 2032
- Table 65: Global APAC Bunker Fuel Industry Revenue Million Forecast, by Geography 2019 & 2032
- Table 66: Global APAC Bunker Fuel Industry Revenue Million Forecast, by Country 2019 & 2032
Frequently Asked Questions
1. What is the projected Compound Annual Growth Rate (CAGR) of the APAC Bunker Fuel Industry?
The projected CAGR is approximately > 16.00%.
2. Which companies are prominent players in the APAC Bunker Fuel Industry?
Key companies in the market include Total SA, Exxon Mobil Corporation, BP Sinopec Marine Fuels Pte Ltd *List Not Exhaustive, China COSCO Holdings Company Limited, Indian Oil Corporation Limited, Royal Dutch Shell PLC, Ocean Network Express PTE Ltd, Chimbusco Pan Nation Petro-Chemical Co Ltd.
3. What are the main segments of the APAC Bunker Fuel Industry?
The market segments include Fuel Type, Vessel Type, Geography.
4. Can you provide details about the market size?
The market size is estimated to be USD XX Million as of 2022.
5. What are some drivers contributing to market growth?
Increasing Demand for Oil and Gas4.; Presence of Proven Oil and Gas Reserves.
6. What are the notable trends driving market growth?
VLSFO to Witness Significant Growth.
7. Are there any restraints impacting market growth?
Volatile Oil and Gas Prices.
8. Can you provide examples of recent developments in the market?
N/A
9. What pricing options are available for accessing the report?
Pricing options include single-user, multi-user, and enterprise licenses priced at USD 4750, USD 5250, and USD 8750 respectively.
10. Is the market size provided in terms of value or volume?
The market size is provided in terms of value, measured in Million.
11. Are there any specific market keywords associated with the report?
Yes, the market keyword associated with the report is "APAC Bunker Fuel Industry," which aids in identifying and referencing the specific market segment covered.
12. How do I determine which pricing option suits my needs best?
The pricing options vary based on user requirements and access needs. Individual users may opt for single-user licenses, while businesses requiring broader access may choose multi-user or enterprise licenses for cost-effective access to the report.
13. Are there any additional resources or data provided in the APAC Bunker Fuel Industry report?
While the report offers comprehensive insights, it's advisable to review the specific contents or supplementary materials provided to ascertain if additional resources or data are available.
14. How can I stay updated on further developments or reports in the APAC Bunker Fuel Industry?
To stay informed about further developments, trends, and reports in the APAC Bunker Fuel Industry, consider subscribing to industry newsletters, following relevant companies and organizations, or regularly checking reputable industry news sources and publications.
Methodology
Step 1 - Identification of Relevant Samples Size from Population Database


Step 2 - Approaches for Defining Global Market Size (Value, Volume* & Price*)

Note*: In applicable scenarios
Step 3 - Data Sources
Primary Research
- Web Analytics
- Survey Reports
- Research Institute
- Latest Research Reports
- Opinion Leaders
Secondary Research
- Annual Reports
- White Paper
- Latest Press Release
- Industry Association
- Paid Database
- Investor Presentations

Step 4 - Data Triangulation
Involves using different sources of information in order to increase the validity of a study
These sources are likely to be stakeholders in a program - participants, other researchers, program staff, other community members, and so on.
Then we put all data in single framework & apply various statistical tools to find out the dynamic on the market.
During the analysis stage, feedback from the stakeholder groups would be compared to determine areas of agreement as well as areas of divergence
