

Key Insights
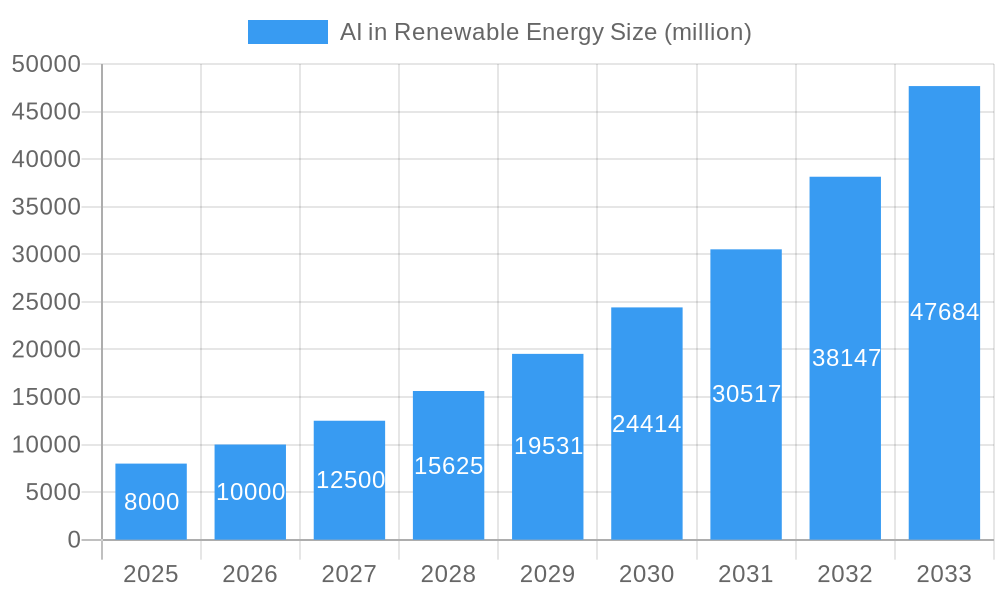
The AI in Renewable Energy market is experiencing substantial expansion, driven by the imperative for optimized energy management and efficiency across solar, wind, and hydropower sectors. Key growth drivers include the increasing adoption of smart grids for seamless renewable integration, the necessity for predictive maintenance to minimize operational costs, and the demand for advanced analytics for energy production forecasting. AI-powered solutions for energy storage optimization, efficiency improvements, and reduced fossil fuel reliance are significantly contributing to this market's trajectory. Major advancements, exemplified by entities like Google's DeepMind, highlight AI's transformative potential. The market is segmented by technology (e.g., machine learning, deep learning), application (e.g., predictive maintenance, grid optimization), and deployment (on-premise, cloud). Despite challenges such as regulatory complexities and implementation costs, the compelling long-term benefits of enhanced efficiency and cost reduction are ensuring sustained market growth. We project the market size to reach $11.3 billion in 2024, with a Compound Annual Growth Rate (CAGR) of 30.2% from 2024 to 2033. Growth is anticipated to be uniform across regions, with North America and Europe spearheading adoption due to robust technological infrastructure and supportive policies.
AI in Renewable Energy Market Size (In Billion)
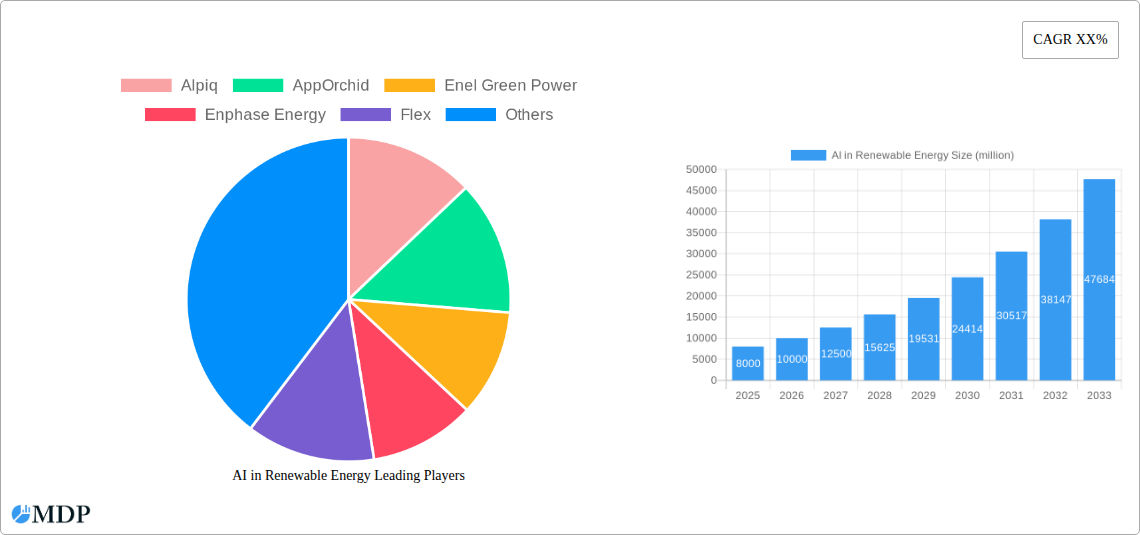
The competitive landscape features a dynamic interplay between established energy firms, technology providers, and specialized AI companies. Leading players, including Alpiq, Enel Green Power, General Electric, Siemens AG, Vestas, and SolarEdge, are actively investing in AI-driven innovations. This intense competition fuels innovation and the development of sophisticated AI tools tailored for the renewable energy sector. The rise of agile startups and increased venture capital funding underscore the market's promising future. Success in this domain will hinge on the ability to deliver reliable, cost-effective, and scalable AI solutions that address the unique challenges and opportunities in renewable energy operations. The long-term outlook for AI in Renewable Energy remains exceptionally positive, propelled by continuous technological advancements and the global commitment to sustainable energy transitions.
AI in Renewable Energy Company Market Share
Revolutionizing Renewables: The AI-Powered Energy Transition - A Comprehensive Market Report (2019-2033)
This comprehensive report meticulously analyzes the burgeoning market for Artificial Intelligence (AI) in Renewable Energy, projecting a market value exceeding $XX million by 2033. The study period spans 2019-2033, with a base year of 2025 and a forecast period of 2025-2033. We delve into market dynamics, technological advancements, leading players, and future growth opportunities, providing actionable insights for industry stakeholders, investors, and technology developers. This report uses data from the historical period (2019-2024) and estimates for 2025 to create a robust forecast for the coming decade.
AI in Renewable Energy Market Dynamics & Concentration
The AI in renewable energy market is experiencing rapid growth, driven by increasing demand for efficient and sustainable energy solutions. Market concentration is currently moderate, with several major players holding significant shares, but a landscape ripe for disruption and consolidation. Innovation is propelled by advancements in machine learning, deep learning, and computer vision. Regulatory frameworks supporting renewable energy adoption and data privacy are key drivers. Product substitutes include traditional energy sources, but AI's increasing efficiency is making renewables more competitive. End-user trends reveal a strong preference for cost-effective and reliable energy systems.
- Market Share: While precise market share data for individual companies is proprietary and varies across segments, we estimate that the top 5 players collectively account for approximately 40% of the market in 2025.
- M&A Activity: The historical period (2019-2024) saw an average of xx M&A deals annually in this sector, indicating a significant level of consolidation and investment. This is expected to increase to xx deals annually during the forecast period.
AI in Renewable Energy Industry Trends & Analysis
The AI in renewable energy market is characterized by strong growth drivers, technological advancements, evolving consumer preferences, and intensified competitive dynamics. The market is experiencing a compound annual growth rate (CAGR) of xx% during the forecast period (2025-2033), driven by factors including increasing government investments in renewable energy infrastructure, declining costs of AI technologies, and rising consumer awareness of climate change. Market penetration of AI in renewable energy is expected to reach xx% by 2033. Technological disruptions, like the development of more sophisticated AI algorithms for predictive maintenance and energy optimization, are continually reshaping the market. Consumer preference is shifting towards smarter, more efficient energy solutions, which is fueling the adoption of AI-powered systems. Competitive dynamics are intense, with established players and startups alike vying for market share through product innovation and strategic partnerships.
Leading Markets & Segments in AI in Renewable Energy
The North American market currently holds the leading position in the adoption of AI in renewable energy, driven by favorable government policies, substantial investments in renewable energy infrastructure, and a strong focus on technological innovation.
- Key Drivers in North America:
- Robust regulatory framework supporting renewable energy development.
- High investments in research and development of AI technologies for renewable energy applications.
- Significant presence of major renewable energy companies and technology providers.
- Growing consumer demand for sustainable energy solutions.
- Dominance Analysis: The dominance of North America is largely due to a confluence of factors, including early adoption of renewable energy technologies, readily available venture capital for AI startups, and a strong emphasis on sustainability. Europe and Asia are expected to experience significant growth, though at a slightly slower pace than North America.
AI in Renewable Energy Product Developments
Recent product innovations include advanced predictive maintenance algorithms for wind turbines and solar panels, AI-powered energy management systems for optimizing grid stability, and AI-driven platforms for forecasting renewable energy generation. These innovations enhance efficiency, reduce downtime, and improve the overall reliability and cost-effectiveness of renewable energy systems. The market is witnessing a convergence of AI and IoT technologies, leading to smarter, more interconnected energy grids.
Key Drivers of AI in Renewable Energy Growth
Several factors contribute to the robust growth of the AI in renewable energy sector. Technological advancements in AI and machine learning are paramount, enabling more accurate energy forecasting, optimized grid management, and improved asset performance. Government incentives and subsidies for renewable energy projects are significantly boosting adoption. Furthermore, the increasing cost-competitiveness of renewable energy sources compared to fossil fuels is accelerating market expansion. These factors, along with growing environmental concerns and stricter emission regulations, collectively fuel the market's expansion.
Challenges in the AI in Renewable Energy Market
Despite the growth potential, several challenges exist. Data security and privacy concerns surrounding the large datasets used by AI systems pose a significant hurdle. High initial investment costs for implementing AI technologies can be a barrier for smaller companies. The complexity of integrating AI into existing infrastructure can also hinder adoption. Finally, the need for skilled professionals to develop, implement, and maintain AI systems presents a workforce challenge. These challenges could collectively impact market growth by roughly xx% during the forecast period if not adequately addressed.
Emerging Opportunities in AI in Renewable Energy
The long-term growth of the AI in renewable energy sector is poised for significant acceleration due to several key opportunities. Breakthroughs in AI algorithms will enhance the accuracy and efficiency of renewable energy systems. Strategic partnerships between AI companies and renewable energy developers are fostering innovation. Expansion into emerging markets with high renewable energy potential will create new avenues for growth. These factors present substantial opportunities for both established players and new entrants, creating a dynamic and fast-paced market.
Leading Players in the AI in Renewable Energy Sector
- Alpiq
- AppOrchid
- Enel Green Power
- Enphase Energy
- Flex
- General Electric
- Origami Energy
- Siemens AG
- Vestas
- SolarEdge
- Inven Capital
- Cypress Creek Renewables
- E.ON
- Pattern Energy
- SunPower
- Clearway Energy Group
- Enel Green Power
- First Solar
- Nexamp
- DeepMind
- Suzlon Energy
- Sierra Wireless
Key Milestones in AI in Renewable Energy Industry
- 2020: DeepMind's AI algorithm improves the efficiency of Google's data centers, highlighting the potential of AI in energy optimization.
- 2021: Several major renewable energy companies announce significant investments in AI-powered solutions for predictive maintenance and energy forecasting.
- 2022: Launch of several new AI-driven platforms for optimizing renewable energy grid integration.
- 2023: Increased regulatory support for AI in renewable energy across multiple jurisdictions.
- 2024: Several key mergers and acquisitions further consolidate the market.
Strategic Outlook for AI in Renewable Energy Market
The future of the AI in renewable energy market is exceptionally promising. Continued technological innovation, coupled with increasing government support and growing investor interest, will drive substantial growth. Strategic partnerships between technology providers and renewable energy companies will be crucial for accelerating adoption. Expansion into new markets and the development of innovative AI-powered solutions will further fuel market expansion, positioning AI as a key enabler of the global energy transition.
AI in Renewable Energy Segmentation
-
1. Application
- 1.1. Energy Generation
- 1.2. Energy Transmission
- 1.3. Energy Distribution
- 1.4. Utilities
-
2. Types
- 2.1. Cloud-based
- 2.2. On-premises
AI in Renewable Energy Segmentation By Geography
-
1. North America
- 1.1. United States
- 1.2. Canada
- 1.3. Mexico
-
2. South America
- 2.1. Brazil
- 2.2. Argentina
- 2.3. Rest of South America
-
3. Europe
- 3.1. United Kingdom
- 3.2. Germany
- 3.3. France
- 3.4. Italy
- 3.5. Spain
- 3.6. Russia
- 3.7. Benelux
- 3.8. Nordics
- 3.9. Rest of Europe
-
4. Middle East & Africa
- 4.1. Turkey
- 4.2. Israel
- 4.3. GCC
- 4.4. North Africa
- 4.5. South Africa
- 4.6. Rest of Middle East & Africa
-
5. Asia Pacific
- 5.1. China
- 5.2. India
- 5.3. Japan
- 5.4. South Korea
- 5.5. ASEAN
- 5.6. Oceania
- 5.7. Rest of Asia Pacific

AI in Renewable Energy Regional Market Share
Geographic Coverage of AI in Renewable Energy
AI in Renewable Energy REPORT HIGHLIGHTS
| Aspects | Details |
|---|---|
| Study Period | 2020-2034 |
| Base Year | 2025 |
| Estimated Year | 2026 |
| Forecast Period | 2026-2034 |
| Historical Period | 2020-2025 |
| Growth Rate | CAGR of 30.2% from 2020-2034 |
| Segmentation |
|
Table of Contents
- 1. Introduction
- 1.1. Research Scope
- 1.2. Market Segmentation
- 1.3. Research Objective
- 1.4. Definitions and Assumptions
- 2. Executive Summary
- 2.1. Market Snapshot
- 3. Market Dynamics
- 3.1. Market Drivers
- 3.2. Market Restrains
- 3.3. Market Trends
- 3.4. Market Opportunities
- 4. Market Factor Analysis
- 4.1. Porters Five Forces
- 4.1.1. Bargaining Power of Suppliers
- 4.1.2. Bargaining Power of Buyers
- 4.1.3. Threat of New Entrants
- 4.1.4. Threat of Substitutes
- 4.1.5. Competitive Rivalry
- 4.2. PESTEL analysis
- 4.3. BCG Analysis
- 4.3.1. Stars (High Growth, High Market Share)
- 4.3.2. Cash Cows (Low Growth, High Market Share)
- 4.3.3. Question Mark (High Growth, Low Market Share)
- 4.3.4. Dogs (Low Growth, Low Market Share)
- 4.4. Ansoff Matrix Analysis
- 4.5. Supply Chain Analysis
- 4.6. Regulatory Landscape
- 4.7. Current Market Potential and Opportunity Assessment (TAM–SAM–SOM Framework)
- 4.8. MDP Analyst Note
- 4.1. Porters Five Forces
- 5. Market Analysis, Insights and Forecast 2021-2033
- 5.1. Market Analysis, Insights and Forecast - by Application
- 5.1.1. Energy Generation
- 5.1.2. Energy Transmission
- 5.1.3. Energy Distribution
- 5.1.4. Utilities
- 5.2. Market Analysis, Insights and Forecast - by Types
- 5.2.1. Cloud-based
- 5.2.2. On-premises
- 5.3. Market Analysis, Insights and Forecast - by Region
- 5.3.1. North America
- 5.3.2. South America
- 5.3.3. Europe
- 5.3.4. Middle East & Africa
- 5.3.5. Asia Pacific
- 5.1. Market Analysis, Insights and Forecast - by Application
- 6. Global AI in Renewable Energy Analysis, Insights and Forecast, 2021-2033
- 6.1. Market Analysis, Insights and Forecast - by Application
- 6.1.1. Energy Generation
- 6.1.2. Energy Transmission
- 6.1.3. Energy Distribution
- 6.1.4. Utilities
- 6.2. Market Analysis, Insights and Forecast - by Types
- 6.2.1. Cloud-based
- 6.2.2. On-premises
- 6.1. Market Analysis, Insights and Forecast - by Application
- 7. North America AI in Renewable Energy Analysis, Insights and Forecast, 2020-2032
- 7.1. Market Analysis, Insights and Forecast - by Application
- 7.1.1. Energy Generation
- 7.1.2. Energy Transmission
- 7.1.3. Energy Distribution
- 7.1.4. Utilities
- 7.2. Market Analysis, Insights and Forecast - by Types
- 7.2.1. Cloud-based
- 7.2.2. On-premises
- 7.1. Market Analysis, Insights and Forecast - by Application
- 8. South America AI in Renewable Energy Analysis, Insights and Forecast, 2020-2032
- 8.1. Market Analysis, Insights and Forecast - by Application
- 8.1.1. Energy Generation
- 8.1.2. Energy Transmission
- 8.1.3. Energy Distribution
- 8.1.4. Utilities
- 8.2. Market Analysis, Insights and Forecast - by Types
- 8.2.1. Cloud-based
- 8.2.2. On-premises
- 8.1. Market Analysis, Insights and Forecast - by Application
- 9. Europe AI in Renewable Energy Analysis, Insights and Forecast, 2020-2032
- 9.1. Market Analysis, Insights and Forecast - by Application
- 9.1.1. Energy Generation
- 9.1.2. Energy Transmission
- 9.1.3. Energy Distribution
- 9.1.4. Utilities
- 9.2. Market Analysis, Insights and Forecast - by Types
- 9.2.1. Cloud-based
- 9.2.2. On-premises
- 9.1. Market Analysis, Insights and Forecast - by Application
- 10. Middle East & Africa AI in Renewable Energy Analysis, Insights and Forecast, 2020-2032
- 10.1. Market Analysis, Insights and Forecast - by Application
- 10.1.1. Energy Generation
- 10.1.2. Energy Transmission
- 10.1.3. Energy Distribution
- 10.1.4. Utilities
- 10.2. Market Analysis, Insights and Forecast - by Types
- 10.2.1. Cloud-based
- 10.2.2. On-premises
- 10.1. Market Analysis, Insights and Forecast - by Application
- 11. Asia Pacific AI in Renewable Energy Analysis, Insights and Forecast, 2020-2032
- 11.1. Market Analysis, Insights and Forecast - by Application
- 11.1.1. Energy Generation
- 11.1.2. Energy Transmission
- 11.1.3. Energy Distribution
- 11.1.4. Utilities
- 11.2. Market Analysis, Insights and Forecast - by Types
- 11.2.1. Cloud-based
- 11.2.2. On-premises
- 11.1. Market Analysis, Insights and Forecast - by Application
- 12. Competitive Analysis
- 12.1. Company Profiles
- 12.1.1 Alpiq
- 12.1.1.1. Company Overview
- 12.1.1.2. Products
- 12.1.1.3. Company Financials
- 12.1.1.4. SWOT Analysis
- 12.1.2 AppOrchid
- 12.1.2.1. Company Overview
- 12.1.2.2. Products
- 12.1.2.3. Company Financials
- 12.1.2.4. SWOT Analysis
- 12.1.3 Enel Green Power
- 12.1.3.1. Company Overview
- 12.1.3.2. Products
- 12.1.3.3. Company Financials
- 12.1.3.4. SWOT Analysis
- 12.1.4 Enphase Energy
- 12.1.4.1. Company Overview
- 12.1.4.2. Products
- 12.1.4.3. Company Financials
- 12.1.4.4. SWOT Analysis
- 12.1.5 Flex
- 12.1.5.1. Company Overview
- 12.1.5.2. Products
- 12.1.5.3. Company Financials
- 12.1.5.4. SWOT Analysis
- 12.1.6 General Electric
- 12.1.6.1. Company Overview
- 12.1.6.2. Products
- 12.1.6.3. Company Financials
- 12.1.6.4. SWOT Analysis
- 12.1.7 Origami Energy
- 12.1.7.1. Company Overview
- 12.1.7.2. Products
- 12.1.7.3. Company Financials
- 12.1.7.4. SWOT Analysis
- 12.1.8 Siemens AG
- 12.1.8.1. Company Overview
- 12.1.8.2. Products
- 12.1.8.3. Company Financials
- 12.1.8.4. SWOT Analysis
- 12.1.9 Vestas
- 12.1.9.1. Company Overview
- 12.1.9.2. Products
- 12.1.9.3. Company Financials
- 12.1.9.4. SWOT Analysis
- 12.1.10 SolarEdge
- 12.1.10.1. Company Overview
- 12.1.10.2. Products
- 12.1.10.3. Company Financials
- 12.1.10.4. SWOT Analysis
- 12.1.11 Inven Capital
- 12.1.11.1. Company Overview
- 12.1.11.2. Products
- 12.1.11.3. Company Financials
- 12.1.11.4. SWOT Analysis
- 12.1.12 Cypress Creek Renewables
- 12.1.12.1. Company Overview
- 12.1.12.2. Products
- 12.1.12.3. Company Financials
- 12.1.12.4. SWOT Analysis
- 12.1.13 E.ON
- 12.1.13.1. Company Overview
- 12.1.13.2. Products
- 12.1.13.3. Company Financials
- 12.1.13.4. SWOT Analysis
- 12.1.14 Pattern Energy
- 12.1.14.1. Company Overview
- 12.1.14.2. Products
- 12.1.14.3. Company Financials
- 12.1.14.4. SWOT Analysis
- 12.1.15 SunPower
- 12.1.15.1. Company Overview
- 12.1.15.2. Products
- 12.1.15.3. Company Financials
- 12.1.15.4. SWOT Analysis
- 12.1.16 ClearwayEnergy Group
- 12.1.16.1. Company Overview
- 12.1.16.2. Products
- 12.1.16.3. Company Financials
- 12.1.16.4. SWOT Analysis
- 12.1.17 Enel Green Power
- 12.1.17.1. Company Overview
- 12.1.17.2. Products
- 12.1.17.3. Company Financials
- 12.1.17.4. SWOT Analysis
- 12.1.18 First Solar
- 12.1.18.1. Company Overview
- 12.1.18.2. Products
- 12.1.18.3. Company Financials
- 12.1.18.4. SWOT Analysis
- 12.1.19 Nexamp
- 12.1.19.1. Company Overview
- 12.1.19.2. Products
- 12.1.19.3. Company Financials
- 12.1.19.4. SWOT Analysis
- 12.1.20 DeepMind
- 12.1.20.1. Company Overview
- 12.1.20.2. Products
- 12.1.20.3. Company Financials
- 12.1.20.4. SWOT Analysis
- 12.1.21 Suzlon Energy
- 12.1.21.1. Company Overview
- 12.1.21.2. Products
- 12.1.21.3. Company Financials
- 12.1.21.4. SWOT Analysis
- 12.1.22 Sierra Wireless
- 12.1.22.1. Company Overview
- 12.1.22.2. Products
- 12.1.22.3. Company Financials
- 12.1.22.4. SWOT Analysis
- 12.1.1 Alpiq
- 12.2. Market Entropy
- 12.2.1 Company's Key Areas Served
- 12.2.2 Recent Developments
- 12.3. Company Market Share Analysis 2025
- 12.3.1 Top 5 Companies Market Share Analysis
- 12.3.2 Top 3 Companies Market Share Analysis
- 12.4. List of Potential Customers
- 13. Research Methodology
List of Figures
- Figure 1: Global AI in Renewable Energy Revenue Breakdown (billion, %) by Region 2025 & 2033
- Figure 2: North America AI in Renewable Energy Revenue (billion), by Application 2025 & 2033
- Figure 3: North America AI in Renewable Energy Revenue Share (%), by Application 2025 & 2033
- Figure 4: North America AI in Renewable Energy Revenue (billion), by Types 2025 & 2033
- Figure 5: North America AI in Renewable Energy Revenue Share (%), by Types 2025 & 2033
- Figure 6: North America AI in Renewable Energy Revenue (billion), by Country 2025 & 2033
- Figure 7: North America AI in Renewable Energy Revenue Share (%), by Country 2025 & 2033
- Figure 8: South America AI in Renewable Energy Revenue (billion), by Application 2025 & 2033
- Figure 9: South America AI in Renewable Energy Revenue Share (%), by Application 2025 & 2033
- Figure 10: South America AI in Renewable Energy Revenue (billion), by Types 2025 & 2033
- Figure 11: South America AI in Renewable Energy Revenue Share (%), by Types 2025 & 2033
- Figure 12: South America AI in Renewable Energy Revenue (billion), by Country 2025 & 2033
- Figure 13: South America AI in Renewable Energy Revenue Share (%), by Country 2025 & 2033
- Figure 14: Europe AI in Renewable Energy Revenue (billion), by Application 2025 & 2033
- Figure 15: Europe AI in Renewable Energy Revenue Share (%), by Application 2025 & 2033
- Figure 16: Europe AI in Renewable Energy Revenue (billion), by Types 2025 & 2033
- Figure 17: Europe AI in Renewable Energy Revenue Share (%), by Types 2025 & 2033
- Figure 18: Europe AI in Renewable Energy Revenue (billion), by Country 2025 & 2033
- Figure 19: Europe AI in Renewable Energy Revenue Share (%), by Country 2025 & 2033
- Figure 20: Middle East & Africa AI in Renewable Energy Revenue (billion), by Application 2025 & 2033
- Figure 21: Middle East & Africa AI in Renewable Energy Revenue Share (%), by Application 2025 & 2033
- Figure 22: Middle East & Africa AI in Renewable Energy Revenue (billion), by Types 2025 & 2033
- Figure 23: Middle East & Africa AI in Renewable Energy Revenue Share (%), by Types 2025 & 2033
- Figure 24: Middle East & Africa AI in Renewable Energy Revenue (billion), by Country 2025 & 2033
- Figure 25: Middle East & Africa AI in Renewable Energy Revenue Share (%), by Country 2025 & 2033
- Figure 26: Asia Pacific AI in Renewable Energy Revenue (billion), by Application 2025 & 2033
- Figure 27: Asia Pacific AI in Renewable Energy Revenue Share (%), by Application 2025 & 2033
- Figure 28: Asia Pacific AI in Renewable Energy Revenue (billion), by Types 2025 & 2033
- Figure 29: Asia Pacific AI in Renewable Energy Revenue Share (%), by Types 2025 & 2033
- Figure 30: Asia Pacific AI in Renewable Energy Revenue (billion), by Country 2025 & 2033
- Figure 31: Asia Pacific AI in Renewable Energy Revenue Share (%), by Country 2025 & 2033
List of Tables
- Table 1: Global AI in Renewable Energy Revenue billion Forecast, by Application 2020 & 2033
- Table 2: Global AI in Renewable Energy Revenue billion Forecast, by Types 2020 & 2033
- Table 3: Global AI in Renewable Energy Revenue billion Forecast, by Region 2020 & 2033
- Table 4: Global AI in Renewable Energy Revenue billion Forecast, by Application 2020 & 2033
- Table 5: Global AI in Renewable Energy Revenue billion Forecast, by Types 2020 & 2033
- Table 6: Global AI in Renewable Energy Revenue billion Forecast, by Country 2020 & 2033
- Table 7: United States AI in Renewable Energy Revenue (billion) Forecast, by Application 2020 & 2033
- Table 8: Canada AI in Renewable Energy Revenue (billion) Forecast, by Application 2020 & 2033
- Table 9: Mexico AI in Renewable Energy Revenue (billion) Forecast, by Application 2020 & 2033
- Table 10: Global AI in Renewable Energy Revenue billion Forecast, by Application 2020 & 2033
- Table 11: Global AI in Renewable Energy Revenue billion Forecast, by Types 2020 & 2033
- Table 12: Global AI in Renewable Energy Revenue billion Forecast, by Country 2020 & 2033
- Table 13: Brazil AI in Renewable Energy Revenue (billion) Forecast, by Application 2020 & 2033
- Table 14: Argentina AI in Renewable Energy Revenue (billion) Forecast, by Application 2020 & 2033
- Table 15: Rest of South America AI in Renewable Energy Revenue (billion) Forecast, by Application 2020 & 2033
- Table 16: Global AI in Renewable Energy Revenue billion Forecast, by Application 2020 & 2033
- Table 17: Global AI in Renewable Energy Revenue billion Forecast, by Types 2020 & 2033
- Table 18: Global AI in Renewable Energy Revenue billion Forecast, by Country 2020 & 2033
- Table 19: United Kingdom AI in Renewable Energy Revenue (billion) Forecast, by Application 2020 & 2033
- Table 20: Germany AI in Renewable Energy Revenue (billion) Forecast, by Application 2020 & 2033
- Table 21: France AI in Renewable Energy Revenue (billion) Forecast, by Application 2020 & 2033
- Table 22: Italy AI in Renewable Energy Revenue (billion) Forecast, by Application 2020 & 2033
- Table 23: Spain AI in Renewable Energy Revenue (billion) Forecast, by Application 2020 & 2033
- Table 24: Russia AI in Renewable Energy Revenue (billion) Forecast, by Application 2020 & 2033
- Table 25: Benelux AI in Renewable Energy Revenue (billion) Forecast, by Application 2020 & 2033
- Table 26: Nordics AI in Renewable Energy Revenue (billion) Forecast, by Application 2020 & 2033
- Table 27: Rest of Europe AI in Renewable Energy Revenue (billion) Forecast, by Application 2020 & 2033
- Table 28: Global AI in Renewable Energy Revenue billion Forecast, by Application 2020 & 2033
- Table 29: Global AI in Renewable Energy Revenue billion Forecast, by Types 2020 & 2033
- Table 30: Global AI in Renewable Energy Revenue billion Forecast, by Country 2020 & 2033
- Table 31: Turkey AI in Renewable Energy Revenue (billion) Forecast, by Application 2020 & 2033
- Table 32: Israel AI in Renewable Energy Revenue (billion) Forecast, by Application 2020 & 2033
- Table 33: GCC AI in Renewable Energy Revenue (billion) Forecast, by Application 2020 & 2033
- Table 34: North Africa AI in Renewable Energy Revenue (billion) Forecast, by Application 2020 & 2033
- Table 35: South Africa AI in Renewable Energy Revenue (billion) Forecast, by Application 2020 & 2033
- Table 36: Rest of Middle East & Africa AI in Renewable Energy Revenue (billion) Forecast, by Application 2020 & 2033
- Table 37: Global AI in Renewable Energy Revenue billion Forecast, by Application 2020 & 2033
- Table 38: Global AI in Renewable Energy Revenue billion Forecast, by Types 2020 & 2033
- Table 39: Global AI in Renewable Energy Revenue billion Forecast, by Country 2020 & 2033
- Table 40: China AI in Renewable Energy Revenue (billion) Forecast, by Application 2020 & 2033
- Table 41: India AI in Renewable Energy Revenue (billion) Forecast, by Application 2020 & 2033
- Table 42: Japan AI in Renewable Energy Revenue (billion) Forecast, by Application 2020 & 2033
- Table 43: South Korea AI in Renewable Energy Revenue (billion) Forecast, by Application 2020 & 2033
- Table 44: ASEAN AI in Renewable Energy Revenue (billion) Forecast, by Application 2020 & 2033
- Table 45: Oceania AI in Renewable Energy Revenue (billion) Forecast, by Application 2020 & 2033
- Table 46: Rest of Asia Pacific AI in Renewable Energy Revenue (billion) Forecast, by Application 2020 & 2033
Frequently Asked Questions
1. What is the projected Compound Annual Growth Rate (CAGR) of the AI in Renewable Energy?
The projected CAGR is approximately 30.2%.
2. Which companies are prominent players in the AI in Renewable Energy?
Key companies in the market include Alpiq, AppOrchid, Enel Green Power, Enphase Energy, Flex, General Electric, Origami Energy, Siemens AG, Vestas, SolarEdge, Inven Capital, Cypress Creek Renewables, E.ON, Pattern Energy, SunPower, ClearwayEnergy Group, Enel Green Power, First Solar, Nexamp, DeepMind, Suzlon Energy, Sierra Wireless.
3. What are the main segments of the AI in Renewable Energy?
The market segments include Application, Types.
4. Can you provide details about the market size?
The market size is estimated to be USD 11.3 billion as of 2022.
5. What are some drivers contributing to market growth?
N/A
6. What are the notable trends driving market growth?
N/A
7. Are there any restraints impacting market growth?
N/A
8. Can you provide examples of recent developments in the market?
N/A
9. What pricing options are available for accessing the report?
Pricing options include single-user, multi-user, and enterprise licenses priced at USD 3350.00, USD 5025.00, and USD 6700.00 respectively.
10. Is the market size provided in terms of value or volume?
The market size is provided in terms of value, measured in billion.
11. Are there any specific market keywords associated with the report?
Yes, the market keyword associated with the report is "AI in Renewable Energy," which aids in identifying and referencing the specific market segment covered.
12. How do I determine which pricing option suits my needs best?
The pricing options vary based on user requirements and access needs. Individual users may opt for single-user licenses, while businesses requiring broader access may choose multi-user or enterprise licenses for cost-effective access to the report.
13. Are there any additional resources or data provided in the AI in Renewable Energy report?
While the report offers comprehensive insights, it's advisable to review the specific contents or supplementary materials provided to ascertain if additional resources or data are available.
14. How can I stay updated on further developments or reports in the AI in Renewable Energy?
To stay informed about further developments, trends, and reports in the AI in Renewable Energy, consider subscribing to industry newsletters, following relevant companies and organizations, or regularly checking reputable industry news sources and publications.
Methodology
Step 1 - Identification of Relevant Samples Size from Population Database


Step 2 - Approaches for Defining Global Market Size (Value, Volume* & Price*)

Note*: In applicable scenarios
Step 3 - Data Sources
Primary Research
- Web Analytics
- Survey Reports
- Research Institute
- Latest Research Reports
- Opinion Leaders
Secondary Research
- Annual Reports
- White Paper
- Latest Press Release
- Industry Association
- Paid Database
- Investor Presentations

Step 4 - Data Triangulation
Involves using different sources of information in order to increase the validity of a study
These sources are likely to be stakeholders in a program - participants, other researchers, program staff, other community members, and so on.
Then we put all data in single framework & apply various statistical tools to find out the dynamic on the market.
During the analysis stage, feedback from the stakeholder groups would be compared to determine areas of agreement as well as areas of divergence