

Key Insights
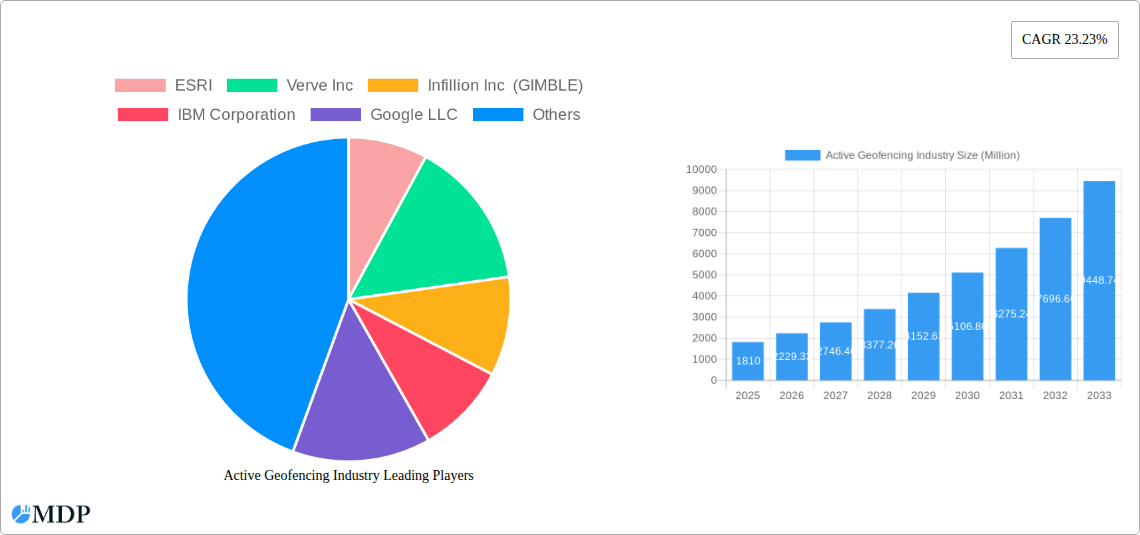
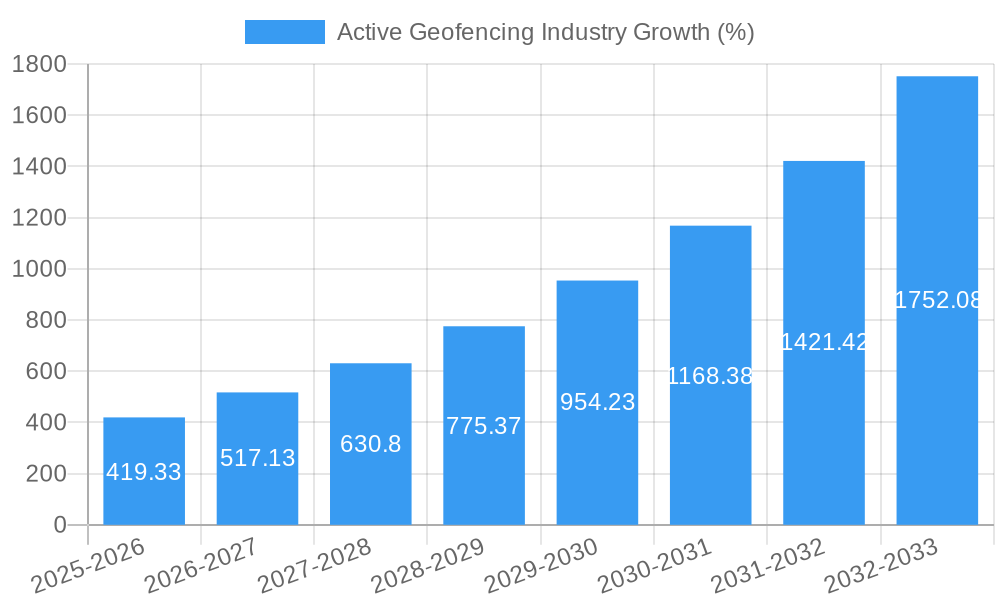
The Active Geofencing market is experiencing robust growth, projected to reach \$1.81 billion in 2025 and maintain a Compound Annual Growth Rate (CAGR) of 23.23% from 2025 to 2033. This expansion is driven by several key factors. The increasing adoption of location-based services across various industries, including retail, banking, and transportation and logistics, fuels demand for precise and dynamic geofencing solutions. Businesses leverage active geofencing to enhance operational efficiency, improve customer engagement through targeted marketing campaigns, and strengthen security measures. Furthermore, advancements in technologies such as GPS, IoT, and AI are enabling more sophisticated and accurate geofencing applications, further accelerating market growth. The rising need for real-time location tracking and automated alerts across sectors like asset management and fleet tracking also contribute significantly. Large-scale businesses currently dominate the market due to their greater resources and higher adoption rates, but the small and medium-scale businesses segment is expected to witness significant growth in the forecast period driven by the affordability and accessibility of cloud-based active geofencing solutions.
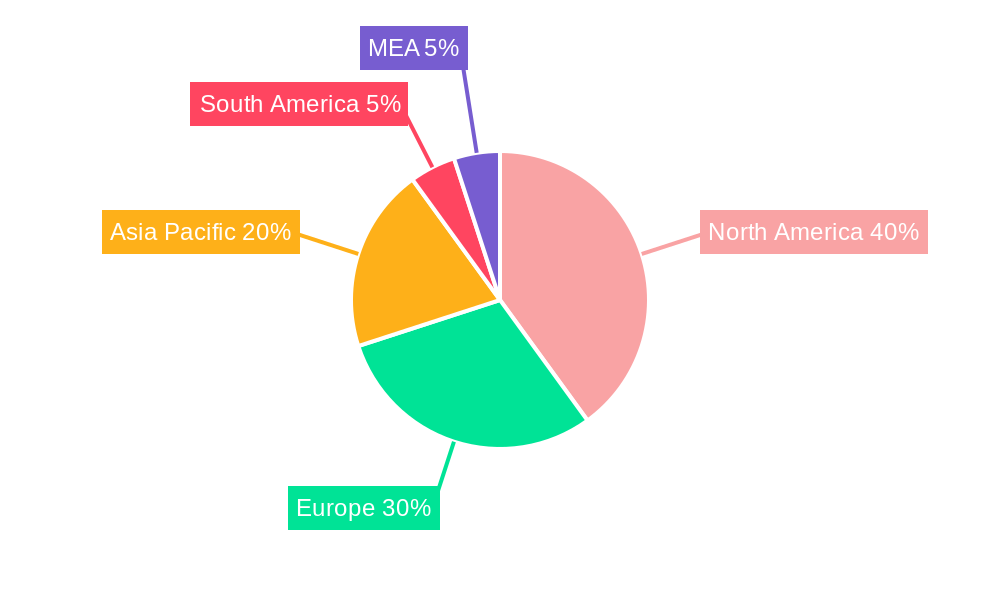
Geographical distribution reveals a strong presence in North America and Europe, fueled by early adoption and advanced technological infrastructure. However, the Asia-Pacific region is poised for substantial growth, driven by rapid digitalization and increasing smartphone penetration. The market faces certain challenges, including concerns about data privacy and security, which necessitates robust security measures and transparent data handling practices. Despite these hurdles, the overall market outlook remains positive, with continued technological innovation and expanding applications promising sustained growth throughout the forecast period. Competition is intense, with major players like ESRI, IBM, Google, and others vying for market share through strategic partnerships, technological advancements, and expansion into new geographies.
Active Geofencing Industry Market Report: 2019-2033
This comprehensive report provides an in-depth analysis of the active geofencing industry, projecting a market value exceeding $XX Million by 2033. It covers market dynamics, leading players, technological advancements, and future growth opportunities, offering invaluable insights for stakeholders across the industry. The report utilizes data from the historical period (2019-2024), base year (2025), and forecast period (2025-2033), providing a complete picture of this rapidly evolving sector.
Active Geofencing Industry Market Dynamics & Concentration
The active geofencing market is characterized by a moderately concentrated landscape, with key players like ESRI, Verve Inc, Infillion Inc (GIMBLE), IBM Corporation, Google LLC, SZ DJI Technology Co, Samsung Electronics Co, LocationSmart, Microsoft Corporation, Radar Labs Inc, Bluedot Innovation Pty Ltd, and Apple Inc vying for market share. Market concentration is expected to remain relatively stable in the near term, with a potential for increased consolidation through mergers and acquisitions (M&A) in the long term. The combined market share of the top five players in 2025 is estimated at xx%. Innovation, particularly in areas such as AI-powered geofencing and improved accuracy, is a major driver. Regulatory frameworks surrounding data privacy and location tracking significantly impact market growth and adoption. The existence of alternative technologies, such as RFID and Bluetooth beacons, presents competitive pressures, though geofencing's scalability and cost-effectiveness maintain its edge. Recent M&A activity in the sector, totaling approximately xx deals between 2019 and 2024, reflects a trend of consolidation and expansion. End-user trends, such as increased demand for location-based services across various industries, further fuel market expansion.
Active Geofencing Industry Industry Trends & Analysis
The active geofencing industry is experiencing robust growth, with a projected Compound Annual Growth Rate (CAGR) of xx% during the forecast period (2025-2033). This growth is driven by several factors including the increasing adoption of smartphones and IoT devices, advancements in location-based technologies like GPS and Bluetooth, and the rising demand for location-aware services across diverse sectors. Technological disruptions, particularly the integration of AI and machine learning, enhance geofencing's accuracy and capabilities, attracting new users and applications. Consumer preferences are shifting towards personalized experiences, driving the adoption of geofencing for targeted marketing and location-based services. The competitive landscape is dynamic, with established players continuously innovating and new entrants emerging, fostering a highly competitive yet innovative environment. Market penetration is expected to increase significantly, reaching xx% by 2033.
Leading Markets & Segments in Active Geofencing Industry
The North American market currently holds the dominant position in the global active geofencing industry, followed by Europe and Asia Pacific. This dominance is attributed to factors such as higher technological adoption rates, advanced infrastructure, and robust regulatory frameworks.
Key Drivers by Segment:
By Organization Size:
- Large-Scale Businesses: Higher budgets for technological investments and a greater need for sophisticated location tracking solutions drive market growth in this segment.
- Small-Scale and Medium-Scale Businesses: Increasing affordability of geofencing solutions and the rising awareness of its benefits are driving adoption among SMBs.
By End-user Industry:
- Retail: Personalized marketing campaigns, inventory management, and improved customer experience are key drivers.
- Transportation and Logistics: Real-time tracking of goods, optimized delivery routes, and enhanced fleet management are driving adoption.
- Banking, Financial Services, and Insurance: Fraud prevention, risk management, and targeted advertising are significant drivers.
- Other End-user Industries: The increasing demand for location-based services across various industries, including healthcare, manufacturing, and government, is contributing to market growth.
Detailed analysis reveals that the Retail sector holds the largest market share (xx%), driven by the high adoption rate of targeted advertising and improved customer engagement strategies.
Active Geofencing Industry Product Developments
Recent advancements include the integration of AI and machine learning for improved accuracy and real-time location tracking, as well as the development of hybrid geofencing systems that combine multiple technologies for more robust solutions. The development of advanced analytics capabilities allows businesses to extract valuable insights from geofencing data, improving decision-making and enhancing operational efficiency. These innovations enhance the value proposition of geofencing, expanding its applicability across various sectors. The market fit for these advanced technologies is high, driven by the increasing demand for real-time data and accurate location intelligence.
Key Drivers of Active Geofencing Industry Growth
The active geofencing market's growth is fueled by several key factors: technological advancements (e.g., improved GPS accuracy, AI integration), increasing smartphone penetration and IoT adoption, and supportive regulatory environments in many regions that encourage location-based services. The rising demand for location-based services across various industries, such as retail, logistics, and healthcare, also significantly contributes to the growth. Economic factors, such as increased investment in digital infrastructure and technological innovation, further boost the market.
Challenges in the Active Geofencing Industry Market
The active geofencing industry faces several challenges, including data privacy concerns, which lead to regulatory hurdles and restrictions. Supply chain disruptions, particularly in the procurement of hardware components like GPS chips, can also impact market growth. The competitive landscape is fierce, with numerous players vying for market share, creating pricing pressure and reducing profit margins. These challenges collectively reduce the overall growth potential by an estimated xx% annually.
Emerging Opportunities in Active Geofencing Industry
The integration of 5G technology promises to significantly enhance geofencing accuracy and real-time capabilities, opening new opportunities. Strategic partnerships between technology providers and end-user industries are creating innovative applications. The expanding adoption of geofencing in emerging markets presents a vast potential for market expansion, representing a substantial growth opportunity in the future.
Leading Players in the Active Geofencing Industry Sector
- ESRI
- Verve Inc
- Infillion Inc (GIMBLE)
- IBM Corporation
- Google LLC
- SZ DJI Technology Co
- Samsung Electronics Co
- LocationSmart
- Microsoft Corporation
- Radar Labs Inc
- Bluedot Innovation Pty Ltd
- Apple Inc
Key Milestones in Active Geofencing Industry Industry
- July 2023: Radar Labs Inc. launched the Routr Matching API, enhancing location tracking accuracy. This improved the precision of location data, a key factor in geofencing applications, potentially driving broader adoption and market growth.
- December 2023: McDonald's expanded its Ready on Arrival pilot program utilizing geofencing technology. This successful trial demonstrates the technology's value in optimizing restaurant operations, likely encouraging further adoption by other quick-service restaurants and potentially expanding the market size.
Strategic Outlook for Active Geofencing Industry Market
The active geofencing market holds significant long-term growth potential, driven by ongoing technological advancements, increased demand for location-based services, and expansion into new markets. Strategic partnerships and collaborations across industries will further accelerate market growth. Focusing on solutions that address data privacy concerns and deliver enhanced accuracy will be critical for sustained success in this competitive landscape. The market's future hinges on continuous innovation and strategic adaptations to evolving technological and regulatory environments.
Active Geofencing Industry Segmentation
-
1. Organization Size
- 1.1. Small-Scale and Medium-Scale Businesses
- 1.2. Large-Scale Businesses
-
2. End-user Industry
- 2.1. Banking, Financial Services, and Insurance
- 2.2. Retail
- 2.3. Defense, Government, and Military
- 2.4. Healthcare
- 2.5. Industrial Manufacturing
- 2.6. Transportation and Logistics
- 2.7. Other End-user Industries
Active Geofencing Industry Segmentation By Geography
- 1. North America
- 2. Europe
- 3. Asia Pacific
- 4. Latin America
- 5. Middle East and Africa
Active Geofencing Industry REPORT HIGHLIGHTS
| Aspects | Details |
|---|---|
| Study Period | 2019-2033 |
| Base Year | 2024 |
| Estimated Year | 2025 |
| Forecast Period | 2025-2033 |
| Historical Period | 2019-2024 |
| Growth Rate | CAGR of 23.23% from 2019-2033 |
| Segmentation |
|
Table of Contents
- 1. Introduction
- 1.1. Research Scope
- 1.2. Market Segmentation
- 1.3. Research Methodology
- 1.4. Definitions and Assumptions
- 2. Executive Summary
- 2.1. Introduction
- 3. Market Dynamics
- 3.1. Introduction
- 3.2. Market Drivers
- 3.2.1. Increased Use of Spatial Data and Improved Real-time Location Technology; Higher Adoption of Location-based Application among Consumers
- 3.3. Market Restrains
- 3.3.1. Rising Awareness Regarding Safety and Security among Consumers of Location Tracking
- 3.4. Market Trends
- 3.4.1. Retail Segment to Witness Significant Growth
- 4. Market Factor Analysis
- 4.1. Porters Five Forces
- 4.2. Supply/Value Chain
- 4.3. PESTEL analysis
- 4.4. Market Entropy
- 4.5. Patent/Trademark Analysis
- 5. Global Active Geofencing Industry Analysis, Insights and Forecast, 2019-2031
- 5.1. Market Analysis, Insights and Forecast - by Organization Size
- 5.1.1. Small-Scale and Medium-Scale Businesses
- 5.1.2. Large-Scale Businesses
- 5.2. Market Analysis, Insights and Forecast - by End-user Industry
- 5.2.1. Banking, Financial Services, and Insurance
- 5.2.2. Retail
- 5.2.3. Defense, Government, and Military
- 5.2.4. Healthcare
- 5.2.5. Industrial Manufacturing
- 5.2.6. Transportation and Logistics
- 5.2.7. Other End-user Industries
- 5.3. Market Analysis, Insights and Forecast - by Region
- 5.3.1. North America
- 5.3.2. Europe
- 5.3.3. Asia Pacific
- 5.3.4. Latin America
- 5.3.5. Middle East and Africa
- 5.1. Market Analysis, Insights and Forecast - by Organization Size
- 6. North America Active Geofencing Industry Analysis, Insights and Forecast, 2019-2031
- 6.1. Market Analysis, Insights and Forecast - by Organization Size
- 6.1.1. Small-Scale and Medium-Scale Businesses
- 6.1.2. Large-Scale Businesses
- 6.2. Market Analysis, Insights and Forecast - by End-user Industry
- 6.2.1. Banking, Financial Services, and Insurance
- 6.2.2. Retail
- 6.2.3. Defense, Government, and Military
- 6.2.4. Healthcare
- 6.2.5. Industrial Manufacturing
- 6.2.6. Transportation and Logistics
- 6.2.7. Other End-user Industries
- 6.1. Market Analysis, Insights and Forecast - by Organization Size
- 7. Europe Active Geofencing Industry Analysis, Insights and Forecast, 2019-2031
- 7.1. Market Analysis, Insights and Forecast - by Organization Size
- 7.1.1. Small-Scale and Medium-Scale Businesses
- 7.1.2. Large-Scale Businesses
- 7.2. Market Analysis, Insights and Forecast - by End-user Industry
- 7.2.1. Banking, Financial Services, and Insurance
- 7.2.2. Retail
- 7.2.3. Defense, Government, and Military
- 7.2.4. Healthcare
- 7.2.5. Industrial Manufacturing
- 7.2.6. Transportation and Logistics
- 7.2.7. Other End-user Industries
- 7.1. Market Analysis, Insights and Forecast - by Organization Size
- 8. Asia Pacific Active Geofencing Industry Analysis, Insights and Forecast, 2019-2031
- 8.1. Market Analysis, Insights and Forecast - by Organization Size
- 8.1.1. Small-Scale and Medium-Scale Businesses
- 8.1.2. Large-Scale Businesses
- 8.2. Market Analysis, Insights and Forecast - by End-user Industry
- 8.2.1. Banking, Financial Services, and Insurance
- 8.2.2. Retail
- 8.2.3. Defense, Government, and Military
- 8.2.4. Healthcare
- 8.2.5. Industrial Manufacturing
- 8.2.6. Transportation and Logistics
- 8.2.7. Other End-user Industries
- 8.1. Market Analysis, Insights and Forecast - by Organization Size
- 9. Latin America Active Geofencing Industry Analysis, Insights and Forecast, 2019-2031
- 9.1. Market Analysis, Insights and Forecast - by Organization Size
- 9.1.1. Small-Scale and Medium-Scale Businesses
- 9.1.2. Large-Scale Businesses
- 9.2. Market Analysis, Insights and Forecast - by End-user Industry
- 9.2.1. Banking, Financial Services, and Insurance
- 9.2.2. Retail
- 9.2.3. Defense, Government, and Military
- 9.2.4. Healthcare
- 9.2.5. Industrial Manufacturing
- 9.2.6. Transportation and Logistics
- 9.2.7. Other End-user Industries
- 9.1. Market Analysis, Insights and Forecast - by Organization Size
- 10. Middle East and Africa Active Geofencing Industry Analysis, Insights and Forecast, 2019-2031
- 10.1. Market Analysis, Insights and Forecast - by Organization Size
- 10.1.1. Small-Scale and Medium-Scale Businesses
- 10.1.2. Large-Scale Businesses
- 10.2. Market Analysis, Insights and Forecast - by End-user Industry
- 10.2.1. Banking, Financial Services, and Insurance
- 10.2.2. Retail
- 10.2.3. Defense, Government, and Military
- 10.2.4. Healthcare
- 10.2.5. Industrial Manufacturing
- 10.2.6. Transportation and Logistics
- 10.2.7. Other End-user Industries
- 10.1. Market Analysis, Insights and Forecast - by Organization Size
- 11. North America Active Geofencing Industry Analysis, Insights and Forecast, 2019-2031
- 11.1. Market Analysis, Insights and Forecast - By Country/Sub-region
- 11.1.1 United States
- 11.1.2 Canada
- 11.1.3 Mexico
- 12. Europe Active Geofencing Industry Analysis, Insights and Forecast, 2019-2031
- 12.1. Market Analysis, Insights and Forecast - By Country/Sub-region
- 12.1.1 Germany
- 12.1.2 United Kingdom
- 12.1.3 France
- 12.1.4 Spain
- 12.1.5 Italy
- 12.1.6 Spain
- 12.1.7 Belgium
- 12.1.8 Netherland
- 12.1.9 Nordics
- 12.1.10 Rest of Europe
- 13. Asia Pacific Active Geofencing Industry Analysis, Insights and Forecast, 2019-2031
- 13.1. Market Analysis, Insights and Forecast - By Country/Sub-region
- 13.1.1 China
- 13.1.2 Japan
- 13.1.3 India
- 13.1.4 South Korea
- 13.1.5 Southeast Asia
- 13.1.6 Australia
- 13.1.7 Indonesia
- 13.1.8 Phillipes
- 13.1.9 Singapore
- 13.1.10 Thailandc
- 13.1.11 Rest of Asia Pacific
- 14. South America Active Geofencing Industry Analysis, Insights and Forecast, 2019-2031
- 14.1. Market Analysis, Insights and Forecast - By Country/Sub-region
- 14.1.1 Brazil
- 14.1.2 Argentina
- 14.1.3 Peru
- 14.1.4 Chile
- 14.1.5 Colombia
- 14.1.6 Ecuador
- 14.1.7 Venezuela
- 14.1.8 Rest of South America
- 15. North America Active Geofencing Industry Analysis, Insights and Forecast, 2019-2031
- 15.1. Market Analysis, Insights and Forecast - By Country/Sub-region
- 15.1.1 United States
- 15.1.2 Canada
- 15.1.3 Mexico
- 16. MEA Active Geofencing Industry Analysis, Insights and Forecast, 2019-2031
- 16.1. Market Analysis, Insights and Forecast - By Country/Sub-region
- 16.1.1 United Arab Emirates
- 16.1.2 Saudi Arabia
- 16.1.3 South Africa
- 16.1.4 Rest of Middle East and Africa
- 17. Competitive Analysis
- 17.1. Global Market Share Analysis 2024
- 17.2. Company Profiles
- 17.2.1 ESRI
- 17.2.1.1. Overview
- 17.2.1.2. Products
- 17.2.1.3. SWOT Analysis
- 17.2.1.4. Recent Developments
- 17.2.1.5. Financials (Based on Availability)
- 17.2.2 Verve Inc
- 17.2.2.1. Overview
- 17.2.2.2. Products
- 17.2.2.3. SWOT Analysis
- 17.2.2.4. Recent Developments
- 17.2.2.5. Financials (Based on Availability)
- 17.2.3 Infillion Inc (GIMBLE)
- 17.2.3.1. Overview
- 17.2.3.2. Products
- 17.2.3.3. SWOT Analysis
- 17.2.3.4. Recent Developments
- 17.2.3.5. Financials (Based on Availability)
- 17.2.4 IBM Corporation
- 17.2.4.1. Overview
- 17.2.4.2. Products
- 17.2.4.3. SWOT Analysis
- 17.2.4.4. Recent Developments
- 17.2.4.5. Financials (Based on Availability)
- 17.2.5 Google LLC
- 17.2.5.1. Overview
- 17.2.5.2. Products
- 17.2.5.3. SWOT Analysis
- 17.2.5.4. Recent Developments
- 17.2.5.5. Financials (Based on Availability)
- 17.2.6 SZ DJI Technology Co
- 17.2.6.1. Overview
- 17.2.6.2. Products
- 17.2.6.3. SWOT Analysis
- 17.2.6.4. Recent Developments
- 17.2.6.5. Financials (Based on Availability)
- 17.2.7 Samsung Electronics Co
- 17.2.7.1. Overview
- 17.2.7.2. Products
- 17.2.7.3. SWOT Analysis
- 17.2.7.4. Recent Developments
- 17.2.7.5. Financials (Based on Availability)
- 17.2.8 LocationSmart
- 17.2.8.1. Overview
- 17.2.8.2. Products
- 17.2.8.3. SWOT Analysis
- 17.2.8.4. Recent Developments
- 17.2.8.5. Financials (Based on Availability)
- 17.2.9 Microsoft Corporation
- 17.2.9.1. Overview
- 17.2.9.2. Products
- 17.2.9.3. SWOT Analysis
- 17.2.9.4. Recent Developments
- 17.2.9.5. Financials (Based on Availability)
- 17.2.10 Radar Labs Inc
- 17.2.10.1. Overview
- 17.2.10.2. Products
- 17.2.10.3. SWOT Analysis
- 17.2.10.4. Recent Developments
- 17.2.10.5. Financials (Based on Availability)
- 17.2.11 Bluedot Innovation Pty Ltd
- 17.2.11.1. Overview
- 17.2.11.2. Products
- 17.2.11.3. SWOT Analysis
- 17.2.11.4. Recent Developments
- 17.2.11.5. Financials (Based on Availability)
- 17.2.12 Apple Inc
- 17.2.12.1. Overview
- 17.2.12.2. Products
- 17.2.12.3. SWOT Analysis
- 17.2.12.4. Recent Developments
- 17.2.12.5. Financials (Based on Availability)
- 17.2.1 ESRI
List of Figures
- Figure 1: Global Active Geofencing Industry Revenue Breakdown (Million, %) by Region 2024 & 2032
- Figure 2: North America Active Geofencing Industry Revenue (Million), by Country 2024 & 2032
- Figure 3: North America Active Geofencing Industry Revenue Share (%), by Country 2024 & 2032
- Figure 4: Europe Active Geofencing Industry Revenue (Million), by Country 2024 & 2032
- Figure 5: Europe Active Geofencing Industry Revenue Share (%), by Country 2024 & 2032
- Figure 6: Asia Pacific Active Geofencing Industry Revenue (Million), by Country 2024 & 2032
- Figure 7: Asia Pacific Active Geofencing Industry Revenue Share (%), by Country 2024 & 2032
- Figure 8: South America Active Geofencing Industry Revenue (Million), by Country 2024 & 2032
- Figure 9: South America Active Geofencing Industry Revenue Share (%), by Country 2024 & 2032
- Figure 10: North America Active Geofencing Industry Revenue (Million), by Country 2024 & 2032
- Figure 11: North America Active Geofencing Industry Revenue Share (%), by Country 2024 & 2032
- Figure 12: MEA Active Geofencing Industry Revenue (Million), by Country 2024 & 2032
- Figure 13: MEA Active Geofencing Industry Revenue Share (%), by Country 2024 & 2032
- Figure 14: North America Active Geofencing Industry Revenue (Million), by Organization Size 2024 & 2032
- Figure 15: North America Active Geofencing Industry Revenue Share (%), by Organization Size 2024 & 2032
- Figure 16: North America Active Geofencing Industry Revenue (Million), by End-user Industry 2024 & 2032
- Figure 17: North America Active Geofencing Industry Revenue Share (%), by End-user Industry 2024 & 2032
- Figure 18: North America Active Geofencing Industry Revenue (Million), by Country 2024 & 2032
- Figure 19: North America Active Geofencing Industry Revenue Share (%), by Country 2024 & 2032
- Figure 20: Europe Active Geofencing Industry Revenue (Million), by Organization Size 2024 & 2032
- Figure 21: Europe Active Geofencing Industry Revenue Share (%), by Organization Size 2024 & 2032
- Figure 22: Europe Active Geofencing Industry Revenue (Million), by End-user Industry 2024 & 2032
- Figure 23: Europe Active Geofencing Industry Revenue Share (%), by End-user Industry 2024 & 2032
- Figure 24: Europe Active Geofencing Industry Revenue (Million), by Country 2024 & 2032
- Figure 25: Europe Active Geofencing Industry Revenue Share (%), by Country 2024 & 2032
- Figure 26: Asia Pacific Active Geofencing Industry Revenue (Million), by Organization Size 2024 & 2032
- Figure 27: Asia Pacific Active Geofencing Industry Revenue Share (%), by Organization Size 2024 & 2032
- Figure 28: Asia Pacific Active Geofencing Industry Revenue (Million), by End-user Industry 2024 & 2032
- Figure 29: Asia Pacific Active Geofencing Industry Revenue Share (%), by End-user Industry 2024 & 2032
- Figure 30: Asia Pacific Active Geofencing Industry Revenue (Million), by Country 2024 & 2032
- Figure 31: Asia Pacific Active Geofencing Industry Revenue Share (%), by Country 2024 & 2032
- Figure 32: Latin America Active Geofencing Industry Revenue (Million), by Organization Size 2024 & 2032
- Figure 33: Latin America Active Geofencing Industry Revenue Share (%), by Organization Size 2024 & 2032
- Figure 34: Latin America Active Geofencing Industry Revenue (Million), by End-user Industry 2024 & 2032
- Figure 35: Latin America Active Geofencing Industry Revenue Share (%), by End-user Industry 2024 & 2032
- Figure 36: Latin America Active Geofencing Industry Revenue (Million), by Country 2024 & 2032
- Figure 37: Latin America Active Geofencing Industry Revenue Share (%), by Country 2024 & 2032
- Figure 38: Middle East and Africa Active Geofencing Industry Revenue (Million), by Organization Size 2024 & 2032
- Figure 39: Middle East and Africa Active Geofencing Industry Revenue Share (%), by Organization Size 2024 & 2032
- Figure 40: Middle East and Africa Active Geofencing Industry Revenue (Million), by End-user Industry 2024 & 2032
- Figure 41: Middle East and Africa Active Geofencing Industry Revenue Share (%), by End-user Industry 2024 & 2032
- Figure 42: Middle East and Africa Active Geofencing Industry Revenue (Million), by Country 2024 & 2032
- Figure 43: Middle East and Africa Active Geofencing Industry Revenue Share (%), by Country 2024 & 2032
List of Tables
- Table 1: Global Active Geofencing Industry Revenue Million Forecast, by Region 2019 & 2032
- Table 2: Global Active Geofencing Industry Revenue Million Forecast, by Organization Size 2019 & 2032
- Table 3: Global Active Geofencing Industry Revenue Million Forecast, by End-user Industry 2019 & 2032
- Table 4: Global Active Geofencing Industry Revenue Million Forecast, by Region 2019 & 2032
- Table 5: Global Active Geofencing Industry Revenue Million Forecast, by Country 2019 & 2032
- Table 6: United States Active Geofencing Industry Revenue (Million) Forecast, by Application 2019 & 2032
- Table 7: Canada Active Geofencing Industry Revenue (Million) Forecast, by Application 2019 & 2032
- Table 8: Mexico Active Geofencing Industry Revenue (Million) Forecast, by Application 2019 & 2032
- Table 9: Global Active Geofencing Industry Revenue Million Forecast, by Country 2019 & 2032
- Table 10: Germany Active Geofencing Industry Revenue (Million) Forecast, by Application 2019 & 2032
- Table 11: United Kingdom Active Geofencing Industry Revenue (Million) Forecast, by Application 2019 & 2032
- Table 12: France Active Geofencing Industry Revenue (Million) Forecast, by Application 2019 & 2032
- Table 13: Spain Active Geofencing Industry Revenue (Million) Forecast, by Application 2019 & 2032
- Table 14: Italy Active Geofencing Industry Revenue (Million) Forecast, by Application 2019 & 2032
- Table 15: Spain Active Geofencing Industry Revenue (Million) Forecast, by Application 2019 & 2032
- Table 16: Belgium Active Geofencing Industry Revenue (Million) Forecast, by Application 2019 & 2032
- Table 17: Netherland Active Geofencing Industry Revenue (Million) Forecast, by Application 2019 & 2032
- Table 18: Nordics Active Geofencing Industry Revenue (Million) Forecast, by Application 2019 & 2032
- Table 19: Rest of Europe Active Geofencing Industry Revenue (Million) Forecast, by Application 2019 & 2032
- Table 20: Global Active Geofencing Industry Revenue Million Forecast, by Country 2019 & 2032
- Table 21: China Active Geofencing Industry Revenue (Million) Forecast, by Application 2019 & 2032
- Table 22: Japan Active Geofencing Industry Revenue (Million) Forecast, by Application 2019 & 2032
- Table 23: India Active Geofencing Industry Revenue (Million) Forecast, by Application 2019 & 2032
- Table 24: South Korea Active Geofencing Industry Revenue (Million) Forecast, by Application 2019 & 2032
- Table 25: Southeast Asia Active Geofencing Industry Revenue (Million) Forecast, by Application 2019 & 2032
- Table 26: Australia Active Geofencing Industry Revenue (Million) Forecast, by Application 2019 & 2032
- Table 27: Indonesia Active Geofencing Industry Revenue (Million) Forecast, by Application 2019 & 2032
- Table 28: Phillipes Active Geofencing Industry Revenue (Million) Forecast, by Application 2019 & 2032
- Table 29: Singapore Active Geofencing Industry Revenue (Million) Forecast, by Application 2019 & 2032
- Table 30: Thailandc Active Geofencing Industry Revenue (Million) Forecast, by Application 2019 & 2032
- Table 31: Rest of Asia Pacific Active Geofencing Industry Revenue (Million) Forecast, by Application 2019 & 2032
- Table 32: Global Active Geofencing Industry Revenue Million Forecast, by Country 2019 & 2032
- Table 33: Brazil Active Geofencing Industry Revenue (Million) Forecast, by Application 2019 & 2032
- Table 34: Argentina Active Geofencing Industry Revenue (Million) Forecast, by Application 2019 & 2032
- Table 35: Peru Active Geofencing Industry Revenue (Million) Forecast, by Application 2019 & 2032
- Table 36: Chile Active Geofencing Industry Revenue (Million) Forecast, by Application 2019 & 2032
- Table 37: Colombia Active Geofencing Industry Revenue (Million) Forecast, by Application 2019 & 2032
- Table 38: Ecuador Active Geofencing Industry Revenue (Million) Forecast, by Application 2019 & 2032
- Table 39: Venezuela Active Geofencing Industry Revenue (Million) Forecast, by Application 2019 & 2032
- Table 40: Rest of South America Active Geofencing Industry Revenue (Million) Forecast, by Application 2019 & 2032
- Table 41: Global Active Geofencing Industry Revenue Million Forecast, by Country 2019 & 2032
- Table 42: United States Active Geofencing Industry Revenue (Million) Forecast, by Application 2019 & 2032
- Table 43: Canada Active Geofencing Industry Revenue (Million) Forecast, by Application 2019 & 2032
- Table 44: Mexico Active Geofencing Industry Revenue (Million) Forecast, by Application 2019 & 2032
- Table 45: Global Active Geofencing Industry Revenue Million Forecast, by Country 2019 & 2032
- Table 46: United Arab Emirates Active Geofencing Industry Revenue (Million) Forecast, by Application 2019 & 2032
- Table 47: Saudi Arabia Active Geofencing Industry Revenue (Million) Forecast, by Application 2019 & 2032
- Table 48: South Africa Active Geofencing Industry Revenue (Million) Forecast, by Application 2019 & 2032
- Table 49: Rest of Middle East and Africa Active Geofencing Industry Revenue (Million) Forecast, by Application 2019 & 2032
- Table 50: Global Active Geofencing Industry Revenue Million Forecast, by Organization Size 2019 & 2032
- Table 51: Global Active Geofencing Industry Revenue Million Forecast, by End-user Industry 2019 & 2032
- Table 52: Global Active Geofencing Industry Revenue Million Forecast, by Country 2019 & 2032
- Table 53: Global Active Geofencing Industry Revenue Million Forecast, by Organization Size 2019 & 2032
- Table 54: Global Active Geofencing Industry Revenue Million Forecast, by End-user Industry 2019 & 2032
- Table 55: Global Active Geofencing Industry Revenue Million Forecast, by Country 2019 & 2032
- Table 56: Global Active Geofencing Industry Revenue Million Forecast, by Organization Size 2019 & 2032
- Table 57: Global Active Geofencing Industry Revenue Million Forecast, by End-user Industry 2019 & 2032
- Table 58: Global Active Geofencing Industry Revenue Million Forecast, by Country 2019 & 2032
- Table 59: Global Active Geofencing Industry Revenue Million Forecast, by Organization Size 2019 & 2032
- Table 60: Global Active Geofencing Industry Revenue Million Forecast, by End-user Industry 2019 & 2032
- Table 61: Global Active Geofencing Industry Revenue Million Forecast, by Country 2019 & 2032
- Table 62: Global Active Geofencing Industry Revenue Million Forecast, by Organization Size 2019 & 2032
- Table 63: Global Active Geofencing Industry Revenue Million Forecast, by End-user Industry 2019 & 2032
- Table 64: Global Active Geofencing Industry Revenue Million Forecast, by Country 2019 & 2032
Frequently Asked Questions
1. What is the projected Compound Annual Growth Rate (CAGR) of the Active Geofencing Industry?
The projected CAGR is approximately 23.23%.
2. Which companies are prominent players in the Active Geofencing Industry?
Key companies in the market include ESRI, Verve Inc, Infillion Inc (GIMBLE), IBM Corporation, Google LLC, SZ DJI Technology Co, Samsung Electronics Co, LocationSmart, Microsoft Corporation, Radar Labs Inc, Bluedot Innovation Pty Ltd, Apple Inc.
3. What are the main segments of the Active Geofencing Industry?
The market segments include Organization Size, End-user Industry.
4. Can you provide details about the market size?
The market size is estimated to be USD 1.81 Million as of 2022.
5. What are some drivers contributing to market growth?
Increased Use of Spatial Data and Improved Real-time Location Technology; Higher Adoption of Location-based Application among Consumers.
6. What are the notable trends driving market growth?
Retail Segment to Witness Significant Growth.
7. Are there any restraints impacting market growth?
Rising Awareness Regarding Safety and Security among Consumers of Location Tracking.
8. Can you provide examples of recent developments in the market?
December 2023 : McDonald’s has announced the expanding its Ready on Arrival pilot which uses geofencing to alert employees when a mobile order customer is nearing the restaurant so they can get the customer’s food ready to its top six markets by 2025
9. What pricing options are available for accessing the report?
Pricing options include single-user, multi-user, and enterprise licenses priced at USD 4750, USD 5250, and USD 8750 respectively.
10. Is the market size provided in terms of value or volume?
The market size is provided in terms of value, measured in Million.
11. Are there any specific market keywords associated with the report?
Yes, the market keyword associated with the report is "Active Geofencing Industry," which aids in identifying and referencing the specific market segment covered.
12. How do I determine which pricing option suits my needs best?
The pricing options vary based on user requirements and access needs. Individual users may opt for single-user licenses, while businesses requiring broader access may choose multi-user or enterprise licenses for cost-effective access to the report.
13. Are there any additional resources or data provided in the Active Geofencing Industry report?
While the report offers comprehensive insights, it's advisable to review the specific contents or supplementary materials provided to ascertain if additional resources or data are available.
14. How can I stay updated on further developments or reports in the Active Geofencing Industry?
To stay informed about further developments, trends, and reports in the Active Geofencing Industry, consider subscribing to industry newsletters, following relevant companies and organizations, or regularly checking reputable industry news sources and publications.
Methodology
Step 1 - Identification of Relevant Samples Size from Population Database


Step 2 - Approaches for Defining Global Market Size (Value, Volume* & Price*)

Note*: In applicable scenarios
Step 3 - Data Sources
Primary Research
- Web Analytics
- Survey Reports
- Research Institute
- Latest Research Reports
- Opinion Leaders
Secondary Research
- Annual Reports
- White Paper
- Latest Press Release
- Industry Association
- Paid Database
- Investor Presentations

Step 4 - Data Triangulation
Involves using different sources of information in order to increase the validity of a study
These sources are likely to be stakeholders in a program - participants, other researchers, program staff, other community members, and so on.
Then we put all data in single framework & apply various statistical tools to find out the dynamic on the market.
During the analysis stage, feedback from the stakeholder groups would be compared to determine areas of agreement as well as areas of divergence
