

Key Insights
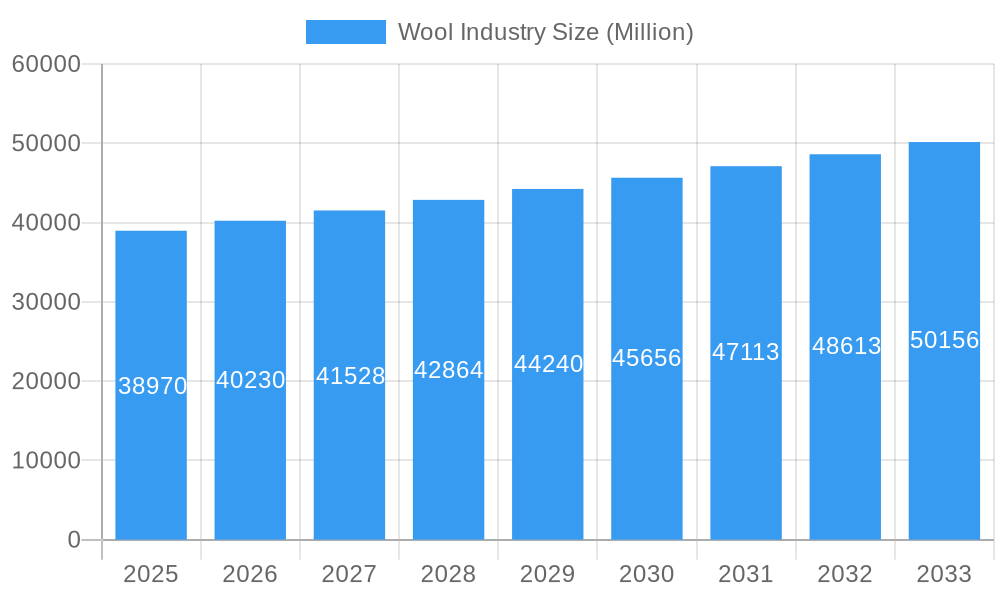
The global wool industry, valued at $38.97 billion in 2025, is projected to experience steady growth, exhibiting a Compound Annual Growth Rate (CAGR) of 3.20% from 2025 to 2033. This growth is fueled by several key factors. The increasing demand for sustainable and eco-friendly materials in the textile and apparel industry is a significant driver, with consumers increasingly seeking natural fibers like wool for its breathability, warmth, and durability. The resurgence of interest in traditional crafts and handcrafted items further boosts demand for high-quality wool products. Growth is also being seen in the home furnishings sector, where wool’s inherent properties make it ideal for carpets, rugs, and upholstery. While the industry faces challenges like fluctuating raw material prices and competition from synthetic fibers, ongoing innovations in wool processing and the development of new wool-based products are mitigating these restraints. The industry is segmented by product type (knitwear yarn, woven fabrics) and end-use industry (textile and apparel, home furnishings, industrial), with the textile and apparel sector currently dominating market share. Geographic distribution shows robust markets in North America and Europe, with significant growth potential in the Asia-Pacific region, driven by increasing disposable incomes and a burgeoning middle class in countries like China and India.
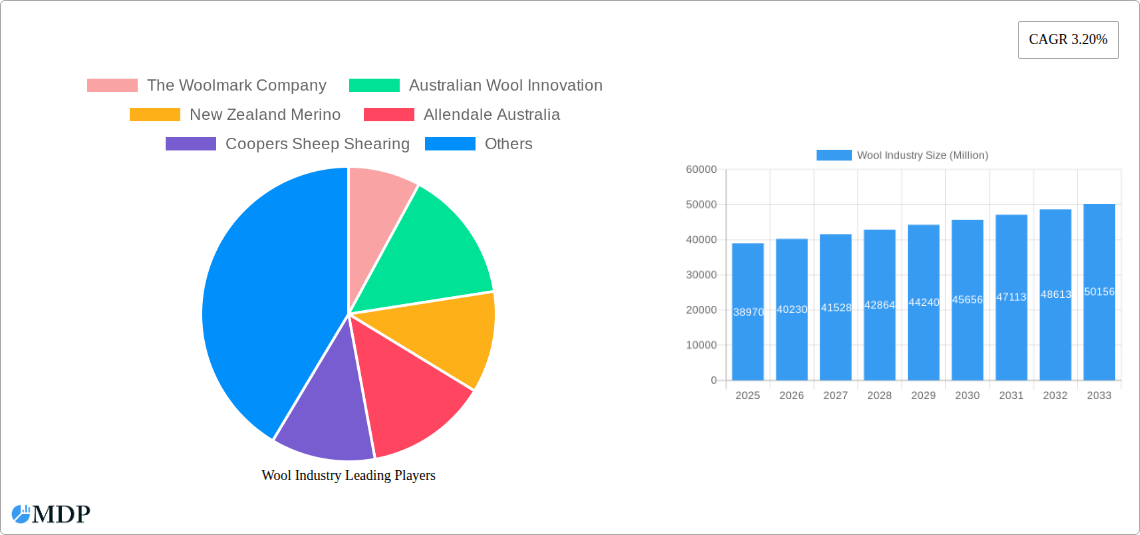
Wool Industry Market Size (In Billion)
The competitive landscape is characterized by a mix of established players like The Woolmark Company, Australian Wool Innovation, and New Zealand Merino, alongside smaller regional producers. These companies are increasingly focusing on branding, marketing, and technological advancements to enhance wool's appeal and cater to evolving consumer preferences. Strategic partnerships and collaborations across the value chain are also becoming increasingly common, facilitating better traceability, supply chain management, and sustainable sourcing practices. Looking ahead, the wool industry's success hinges on its ability to effectively communicate its unique value proposition—sustainability, quality, and versatility—to a wider consumer base, while also addressing the challenges of fluctuating prices and maintaining ethical and sustainable sourcing practices throughout the supply chain. Continued innovation in product development and processing techniques will be crucial in ensuring the industry's continued growth and competitiveness in the global marketplace.
Wool Industry Company Market Share
Unlocking the Future of Wool: A Comprehensive Market Report (2019-2033)
This comprehensive report provides an in-depth analysis of the global wool industry, projecting a market value exceeding $XX Million by 2033. Leveraging a robust methodology combining historical data (2019-2024), a base year of 2025, and a forecast period spanning 2025-2033, this report offers invaluable insights for industry stakeholders, investors, and strategic decision-makers. We delve into market dynamics, leading players like The Woolmark Company, Australian Wool Innovation, and New Zealand Merino, and emerging trends shaping the future of this resilient and versatile material. Download now to gain a competitive edge.
Wool Industry Market Dynamics & Concentration
The global wool market, valued at $XX Million in 2025, exhibits a moderately concentrated landscape. Key players such as The Woolmark Company, Australian Wool Innovation, and New Zealand Merino hold significant market share, estimated at a combined xx% in 2025. However, the presence of numerous smaller players, particularly in yarn and fabric production, ensures a dynamic competitive environment. Innovation, driven by advancements in fiber processing and sustainable practices, is a major growth driver. Stringent environmental regulations globally are influencing production methods, pushing for eco-friendly alternatives. The market faces competition from synthetic fibers, necessitating continuous product diversification and value-added offerings. Mergers and acquisitions (M&A) activity in the sector remains moderate, with xx deals recorded between 2019 and 2024, mostly focused on consolidating smaller players within specific segments.
- Market Concentration: Moderately concentrated, with top three players holding xx% market share (2025).
- Innovation Drivers: Sustainable practices, advanced fiber processing technologies.
- Regulatory Frameworks: Increasingly stringent environmental regulations impacting production methods.
- Product Substitutes: Synthetic fibers (e.g., polyester, acrylic) pose a competitive threat.
- End-User Trends: Growing demand for sustainable and ethically sourced materials.
- M&A Activity: Moderate activity (xx deals between 2019-2024), primarily consolidating smaller companies.
Wool Industry Industry Trends & Analysis
The global wool market is projected to experience a CAGR of xx% during the forecast period (2025-2033), driven primarily by the resurgence of interest in natural fibers and the growing demand for sustainable apparel and home furnishings. Technological advancements in fiber processing, such as the development of finer, softer, and more durable wool products, contribute to the market growth. Consumer preferences are shifting towards premium, ethically sourced wool, creating opportunities for brands emphasizing transparency and sustainability. Competitive dynamics are intensifying, with both established players and new entrants vying for market share. The market penetration of merino wool, known for its superior softness and performance, is steadily increasing, particularly in premium apparel segments.
Leading Markets & Segments in Wool Industry
China remains the dominant market for wool, driven by its large textile and apparel industry and robust domestic consumption. The knitwear segment within product types holds the largest market share, fueled by the popularity of wool sweaters, scarves, and other knitted garments. Within the end-use industry, the textile and apparel sector is the primary driver of wool demand.
- Key Drivers in China: Strong domestic demand, large manufacturing base, supportive government policies.
- Knitwear Segment Dominance: High consumer preference for comfort, versatility, and warmth.
- Textile and Apparel Sector: Major consumer of wool for clothing and accessories.
- Dominance Analysis: China's strong textile industry coupled with global demand for high-quality knitwear drives market leadership.
Wool Industry Product Developments
Recent product innovations focus on developing high-performance wool fabrics with enhanced durability, water resistance, and wrinkle resistance. Technological advancements in spinning and weaving processes allow for the creation of more lightweight and breathable wool fabrics. These innovations improve the market fit by expanding wool's applications beyond traditional uses, catering to diverse consumer preferences and end-use industries. This includes high-performance sportswear, functional outdoor apparel, and innovative home textiles.
Key Drivers of Wool Industry Growth
Technological advancements in fiber processing enhance wool's performance characteristics, improving its appeal to consumers. Growing consumer awareness of sustainability and ethical sourcing fuels demand for natural fibers like wool. Favorable government policies in key markets support the wool industry’s growth. For example, the Australian government's investment in wool research and development strengthens the industry's competitiveness.
Challenges in the Wool Industry Market
Fluctuations in raw material prices and supply chain disruptions due to climate change and geopolitical events pose significant challenges. Competition from synthetic alternatives and the rising cost of production put pressure on profitability. Regulatory hurdles related to environmental standards and labor practices increase the cost of doing business for wool producers. The impact of these challenges is reflected in pricing volatility and reduced margins for some industry players. These issues have collectively caused a xx% reduction in overall profitability in 2024 compared to 2019.
Emerging Opportunities in Wool Industry
Technological breakthroughs in wool processing, such as the development of innovative blends and finishes, create opportunities for enhancing product performance and expanding market applications. Strategic partnerships between wool producers and fashion brands help promote sustainable and ethical wool sourcing. Market expansion into new regions and segments, particularly in developing economies with increasing disposable incomes, presents significant growth potential.
Leading Players in the Wool Industry Sector
- The Woolmark Company
- Australian Wool Innovation
- New Zealand Merino
- Allendale Australia
- Coopers Sheep Shearing
Key Milestones in Wool Industry Industry
- 2020: Launch of a new range of sustainable wool fabrics by The Woolmark Company.
- 2021: Australian Wool Innovation invests in research to improve wool's resilience and performance.
- 2022: New Zealand Merino partners with a major fashion brand to promote ethical wool sourcing.
- 2023: Allendale Australia implements new technology to reduce water consumption in wool processing.
- 2024: Coopers Sheep Shearing invests in automation to improve shearing efficiency and reduce labor costs.
Strategic Outlook for Wool Industry Market
The future of the wool industry is bright, driven by increasing consumer preference for sustainable and high-quality natural fibers. Strategic investments in innovation, sustainability, and ethical sourcing will drive long-term growth. Expanding into new markets and leveraging technological advancements will further enhance the industry's competitiveness. The projected market growth presents significant opportunities for both established players and new entrants to capitalize on the growing demand for premium wool products.
Wool Industry Segmentation
- 1. Production Analysis
- 2. Consumption Analysis
- 3. Import Market Analysis (Value & Volume)
- 4. Export Market Analysis (Value & Volume)
- 5. Price Trend Analysis
Wool Industry Segmentation By Geography
-
1. North America
- 1.1. United States
- 1.2. Mexico
-
2. Europe
- 2.1. Germany
- 2.2. Belgium
- 2.3. United Kingdom
- 2.4. Italy
- 2.5. Netherlands
- 2.6. Turkey
-
3. Asia Pacific
- 3.1. China
- 3.2. India
- 3.3. Japan
- 3.4. Australia
- 3.5. New Zealand
-
4. South America
- 4.1. Brazil
- 4.2. Argentina
-
5. Middle East and Africa
- 5.1. UAE
- 5.2. Saudi Arabia
- 5.3. Oman
- 5.4. Morocco
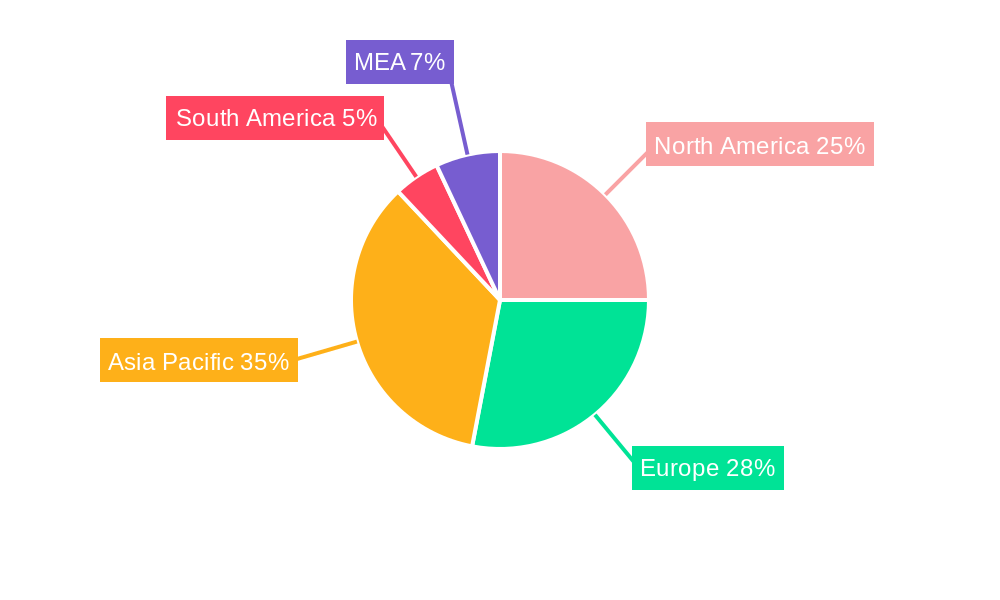
Wool Industry Regional Market Share
Geographic Coverage of Wool Industry
Wool Industry REPORT HIGHLIGHTS
| Aspects | Details |
|---|---|
| Study Period | 2020-2034 |
| Base Year | 2025 |
| Estimated Year | 2026 |
| Forecast Period | 2026-2034 |
| Historical Period | 2020-2025 |
| Growth Rate | CAGR of 3.20% from 2020-2034 |
| Segmentation |
|
Table of Contents
- 1. Introduction
- 1.1. Research Scope
- 1.2. Market Segmentation
- 1.3. Research Methodology
- 1.4. Definitions and Assumptions
- 2. Executive Summary
- 2.1. Introduction
- 3. Market Dynamics
- 3.1. Introduction
- 3.2. Market Drivers
- 3.2.1. ; Awareness About Health Benefits Associated With Pecan Consumption; Wide Application of Pecan
- 3.3. Market Restrains
- 3.3.1. ; Volatility in the Prices; Adverse Weather Conditions Affecting Yield
- 3.4. Market Trends
- 3.4.1. Institutional Initiatives Ensuring the Quality is Driving the Production
- 4. Market Factor Analysis
- 4.1. Porters Five Forces
- 4.2. Supply/Value Chain
- 4.3. PESTEL analysis
- 4.4. Market Entropy
- 4.5. Patent/Trademark Analysis
- 5. Global Wool Industry Analysis, Insights and Forecast, 2020-2032
- 5.1. Market Analysis, Insights and Forecast - by Production Analysis
- 5.2. Market Analysis, Insights and Forecast - by Consumption Analysis
- 5.3. Market Analysis, Insights and Forecast - by Import Market Analysis (Value & Volume)
- 5.4. Market Analysis, Insights and Forecast - by Export Market Analysis (Value & Volume)
- 5.5. Market Analysis, Insights and Forecast - by Price Trend Analysis
- 5.6. Market Analysis, Insights and Forecast - by Region
- 5.6.1. North America
- 5.6.2. Europe
- 5.6.3. Asia Pacific
- 5.6.4. South America
- 5.6.5. Middle East and Africa
- 5.1. Market Analysis, Insights and Forecast - by Production Analysis
- 6. North America Wool Industry Analysis, Insights and Forecast, 2020-2032
- 6.1. Market Analysis, Insights and Forecast - by Production Analysis
- 6.2. Market Analysis, Insights and Forecast - by Consumption Analysis
- 6.3. Market Analysis, Insights and Forecast - by Import Market Analysis (Value & Volume)
- 6.4. Market Analysis, Insights and Forecast - by Export Market Analysis (Value & Volume)
- 6.5. Market Analysis, Insights and Forecast - by Price Trend Analysis
- 6.1. Market Analysis, Insights and Forecast - by Production Analysis
- 7. Europe Wool Industry Analysis, Insights and Forecast, 2020-2032
- 7.1. Market Analysis, Insights and Forecast - by Production Analysis
- 7.2. Market Analysis, Insights and Forecast - by Consumption Analysis
- 7.3. Market Analysis, Insights and Forecast - by Import Market Analysis (Value & Volume)
- 7.4. Market Analysis, Insights and Forecast - by Export Market Analysis (Value & Volume)
- 7.5. Market Analysis, Insights and Forecast - by Price Trend Analysis
- 7.1. Market Analysis, Insights and Forecast - by Production Analysis
- 8. Asia Pacific Wool Industry Analysis, Insights and Forecast, 2020-2032
- 8.1. Market Analysis, Insights and Forecast - by Production Analysis
- 8.2. Market Analysis, Insights and Forecast - by Consumption Analysis
- 8.3. Market Analysis, Insights and Forecast - by Import Market Analysis (Value & Volume)
- 8.4. Market Analysis, Insights and Forecast - by Export Market Analysis (Value & Volume)
- 8.5. Market Analysis, Insights and Forecast - by Price Trend Analysis
- 8.1. Market Analysis, Insights and Forecast - by Production Analysis
- 9. South America Wool Industry Analysis, Insights and Forecast, 2020-2032
- 9.1. Market Analysis, Insights and Forecast - by Production Analysis
- 9.2. Market Analysis, Insights and Forecast - by Consumption Analysis
- 9.3. Market Analysis, Insights and Forecast - by Import Market Analysis (Value & Volume)
- 9.4. Market Analysis, Insights and Forecast - by Export Market Analysis (Value & Volume)
- 9.5. Market Analysis, Insights and Forecast - by Price Trend Analysis
- 9.1. Market Analysis, Insights and Forecast - by Production Analysis
- 10. Middle East and Africa Wool Industry Analysis, Insights and Forecast, 2020-2032
- 10.1. Market Analysis, Insights and Forecast - by Production Analysis
- 10.2. Market Analysis, Insights and Forecast - by Consumption Analysis
- 10.3. Market Analysis, Insights and Forecast - by Import Market Analysis (Value & Volume)
- 10.4. Market Analysis, Insights and Forecast - by Export Market Analysis (Value & Volume)
- 10.5. Market Analysis, Insights and Forecast - by Price Trend Analysis
- 10.1. Market Analysis, Insights and Forecast - by Production Analysis
- 11. Competitive Analysis
- 11.1. Global Market Share Analysis 2025
- 11.2. Company Profiles
- 11.2.1 The Woolmark Company
- 11.2.1.1. Overview
- 11.2.1.2. Products
- 11.2.1.3. SWOT Analysis
- 11.2.1.4. Recent Developments
- 11.2.1.5. Financials (Based on Availability)
- 11.2.2 Australian Wool Innovation
- 11.2.2.1. Overview
- 11.2.2.2. Products
- 11.2.2.3. SWOT Analysis
- 11.2.2.4. Recent Developments
- 11.2.2.5. Financials (Based on Availability)
- 11.2.3 New Zealand Merino
- 11.2.3.1. Overview
- 11.2.3.2. Products
- 11.2.3.3. SWOT Analysis
- 11.2.3.4. Recent Developments
- 11.2.3.5. Financials (Based on Availability)
- 11.2.4 Allendale Australia
- 11.2.4.1. Overview
- 11.2.4.2. Products
- 11.2.4.3. SWOT Analysis
- 11.2.4.4. Recent Developments
- 11.2.4.5. Financials (Based on Availability)
- 11.2.5 Coopers Sheep Shearing
- 11.2.5.1. Overview
- 11.2.5.2. Products
- 11.2.5.3. SWOT Analysis
- 11.2.5.4. Recent Developments
- 11.2.5.5. Financials (Based on Availability)
- 11.2.1 The Woolmark Company
List of Figures
- Figure 1: Global Wool Industry Revenue Breakdown (Million, %) by Region 2025 & 2033
- Figure 2: North America Wool Industry Revenue (Million), by Production Analysis 2025 & 2033
- Figure 3: North America Wool Industry Revenue Share (%), by Production Analysis 2025 & 2033
- Figure 4: North America Wool Industry Revenue (Million), by Consumption Analysis 2025 & 2033
- Figure 5: North America Wool Industry Revenue Share (%), by Consumption Analysis 2025 & 2033
- Figure 6: North America Wool Industry Revenue (Million), by Import Market Analysis (Value & Volume) 2025 & 2033
- Figure 7: North America Wool Industry Revenue Share (%), by Import Market Analysis (Value & Volume) 2025 & 2033
- Figure 8: North America Wool Industry Revenue (Million), by Export Market Analysis (Value & Volume) 2025 & 2033
- Figure 9: North America Wool Industry Revenue Share (%), by Export Market Analysis (Value & Volume) 2025 & 2033
- Figure 10: North America Wool Industry Revenue (Million), by Price Trend Analysis 2025 & 2033
- Figure 11: North America Wool Industry Revenue Share (%), by Price Trend Analysis 2025 & 2033
- Figure 12: North America Wool Industry Revenue (Million), by Country 2025 & 2033
- Figure 13: North America Wool Industry Revenue Share (%), by Country 2025 & 2033
- Figure 14: Europe Wool Industry Revenue (Million), by Production Analysis 2025 & 2033
- Figure 15: Europe Wool Industry Revenue Share (%), by Production Analysis 2025 & 2033
- Figure 16: Europe Wool Industry Revenue (Million), by Consumption Analysis 2025 & 2033
- Figure 17: Europe Wool Industry Revenue Share (%), by Consumption Analysis 2025 & 2033
- Figure 18: Europe Wool Industry Revenue (Million), by Import Market Analysis (Value & Volume) 2025 & 2033
- Figure 19: Europe Wool Industry Revenue Share (%), by Import Market Analysis (Value & Volume) 2025 & 2033
- Figure 20: Europe Wool Industry Revenue (Million), by Export Market Analysis (Value & Volume) 2025 & 2033
- Figure 21: Europe Wool Industry Revenue Share (%), by Export Market Analysis (Value & Volume) 2025 & 2033
- Figure 22: Europe Wool Industry Revenue (Million), by Price Trend Analysis 2025 & 2033
- Figure 23: Europe Wool Industry Revenue Share (%), by Price Trend Analysis 2025 & 2033
- Figure 24: Europe Wool Industry Revenue (Million), by Country 2025 & 2033
- Figure 25: Europe Wool Industry Revenue Share (%), by Country 2025 & 2033
- Figure 26: Asia Pacific Wool Industry Revenue (Million), by Production Analysis 2025 & 2033
- Figure 27: Asia Pacific Wool Industry Revenue Share (%), by Production Analysis 2025 & 2033
- Figure 28: Asia Pacific Wool Industry Revenue (Million), by Consumption Analysis 2025 & 2033
- Figure 29: Asia Pacific Wool Industry Revenue Share (%), by Consumption Analysis 2025 & 2033
- Figure 30: Asia Pacific Wool Industry Revenue (Million), by Import Market Analysis (Value & Volume) 2025 & 2033
- Figure 31: Asia Pacific Wool Industry Revenue Share (%), by Import Market Analysis (Value & Volume) 2025 & 2033
- Figure 32: Asia Pacific Wool Industry Revenue (Million), by Export Market Analysis (Value & Volume) 2025 & 2033
- Figure 33: Asia Pacific Wool Industry Revenue Share (%), by Export Market Analysis (Value & Volume) 2025 & 2033
- Figure 34: Asia Pacific Wool Industry Revenue (Million), by Price Trend Analysis 2025 & 2033
- Figure 35: Asia Pacific Wool Industry Revenue Share (%), by Price Trend Analysis 2025 & 2033
- Figure 36: Asia Pacific Wool Industry Revenue (Million), by Country 2025 & 2033
- Figure 37: Asia Pacific Wool Industry Revenue Share (%), by Country 2025 & 2033
- Figure 38: South America Wool Industry Revenue (Million), by Production Analysis 2025 & 2033
- Figure 39: South America Wool Industry Revenue Share (%), by Production Analysis 2025 & 2033
- Figure 40: South America Wool Industry Revenue (Million), by Consumption Analysis 2025 & 2033
- Figure 41: South America Wool Industry Revenue Share (%), by Consumption Analysis 2025 & 2033
- Figure 42: South America Wool Industry Revenue (Million), by Import Market Analysis (Value & Volume) 2025 & 2033
- Figure 43: South America Wool Industry Revenue Share (%), by Import Market Analysis (Value & Volume) 2025 & 2033
- Figure 44: South America Wool Industry Revenue (Million), by Export Market Analysis (Value & Volume) 2025 & 2033
- Figure 45: South America Wool Industry Revenue Share (%), by Export Market Analysis (Value & Volume) 2025 & 2033
- Figure 46: South America Wool Industry Revenue (Million), by Price Trend Analysis 2025 & 2033
- Figure 47: South America Wool Industry Revenue Share (%), by Price Trend Analysis 2025 & 2033
- Figure 48: South America Wool Industry Revenue (Million), by Country 2025 & 2033
- Figure 49: South America Wool Industry Revenue Share (%), by Country 2025 & 2033
- Figure 50: Middle East and Africa Wool Industry Revenue (Million), by Production Analysis 2025 & 2033
- Figure 51: Middle East and Africa Wool Industry Revenue Share (%), by Production Analysis 2025 & 2033
- Figure 52: Middle East and Africa Wool Industry Revenue (Million), by Consumption Analysis 2025 & 2033
- Figure 53: Middle East and Africa Wool Industry Revenue Share (%), by Consumption Analysis 2025 & 2033
- Figure 54: Middle East and Africa Wool Industry Revenue (Million), by Import Market Analysis (Value & Volume) 2025 & 2033
- Figure 55: Middle East and Africa Wool Industry Revenue Share (%), by Import Market Analysis (Value & Volume) 2025 & 2033
- Figure 56: Middle East and Africa Wool Industry Revenue (Million), by Export Market Analysis (Value & Volume) 2025 & 2033
- Figure 57: Middle East and Africa Wool Industry Revenue Share (%), by Export Market Analysis (Value & Volume) 2025 & 2033
- Figure 58: Middle East and Africa Wool Industry Revenue (Million), by Price Trend Analysis 2025 & 2033
- Figure 59: Middle East and Africa Wool Industry Revenue Share (%), by Price Trend Analysis 2025 & 2033
- Figure 60: Middle East and Africa Wool Industry Revenue (Million), by Country 2025 & 2033
- Figure 61: Middle East and Africa Wool Industry Revenue Share (%), by Country 2025 & 2033
List of Tables
- Table 1: Global Wool Industry Revenue Million Forecast, by Production Analysis 2020 & 2033
- Table 2: Global Wool Industry Revenue Million Forecast, by Consumption Analysis 2020 & 2033
- Table 3: Global Wool Industry Revenue Million Forecast, by Import Market Analysis (Value & Volume) 2020 & 2033
- Table 4: Global Wool Industry Revenue Million Forecast, by Export Market Analysis (Value & Volume) 2020 & 2033
- Table 5: Global Wool Industry Revenue Million Forecast, by Price Trend Analysis 2020 & 2033
- Table 6: Global Wool Industry Revenue Million Forecast, by Region 2020 & 2033
- Table 7: Global Wool Industry Revenue Million Forecast, by Production Analysis 2020 & 2033
- Table 8: Global Wool Industry Revenue Million Forecast, by Consumption Analysis 2020 & 2033
- Table 9: Global Wool Industry Revenue Million Forecast, by Import Market Analysis (Value & Volume) 2020 & 2033
- Table 10: Global Wool Industry Revenue Million Forecast, by Export Market Analysis (Value & Volume) 2020 & 2033
- Table 11: Global Wool Industry Revenue Million Forecast, by Price Trend Analysis 2020 & 2033
- Table 12: Global Wool Industry Revenue Million Forecast, by Country 2020 & 2033
- Table 13: United States Wool Industry Revenue (Million) Forecast, by Application 2020 & 2033
- Table 14: Mexico Wool Industry Revenue (Million) Forecast, by Application 2020 & 2033
- Table 15: Global Wool Industry Revenue Million Forecast, by Production Analysis 2020 & 2033
- Table 16: Global Wool Industry Revenue Million Forecast, by Consumption Analysis 2020 & 2033
- Table 17: Global Wool Industry Revenue Million Forecast, by Import Market Analysis (Value & Volume) 2020 & 2033
- Table 18: Global Wool Industry Revenue Million Forecast, by Export Market Analysis (Value & Volume) 2020 & 2033
- Table 19: Global Wool Industry Revenue Million Forecast, by Price Trend Analysis 2020 & 2033
- Table 20: Global Wool Industry Revenue Million Forecast, by Country 2020 & 2033
- Table 21: Germany Wool Industry Revenue (Million) Forecast, by Application 2020 & 2033
- Table 22: Belgium Wool Industry Revenue (Million) Forecast, by Application 2020 & 2033
- Table 23: United Kingdom Wool Industry Revenue (Million) Forecast, by Application 2020 & 2033
- Table 24: Italy Wool Industry Revenue (Million) Forecast, by Application 2020 & 2033
- Table 25: Netherlands Wool Industry Revenue (Million) Forecast, by Application 2020 & 2033
- Table 26: Turkey Wool Industry Revenue (Million) Forecast, by Application 2020 & 2033
- Table 27: Global Wool Industry Revenue Million Forecast, by Production Analysis 2020 & 2033
- Table 28: Global Wool Industry Revenue Million Forecast, by Consumption Analysis 2020 & 2033
- Table 29: Global Wool Industry Revenue Million Forecast, by Import Market Analysis (Value & Volume) 2020 & 2033
- Table 30: Global Wool Industry Revenue Million Forecast, by Export Market Analysis (Value & Volume) 2020 & 2033
- Table 31: Global Wool Industry Revenue Million Forecast, by Price Trend Analysis 2020 & 2033
- Table 32: Global Wool Industry Revenue Million Forecast, by Country 2020 & 2033
- Table 33: China Wool Industry Revenue (Million) Forecast, by Application 2020 & 2033
- Table 34: India Wool Industry Revenue (Million) Forecast, by Application 2020 & 2033
- Table 35: Japan Wool Industry Revenue (Million) Forecast, by Application 2020 & 2033
- Table 36: Australia Wool Industry Revenue (Million) Forecast, by Application 2020 & 2033
- Table 37: New Zealand Wool Industry Revenue (Million) Forecast, by Application 2020 & 2033
- Table 38: Global Wool Industry Revenue Million Forecast, by Production Analysis 2020 & 2033
- Table 39: Global Wool Industry Revenue Million Forecast, by Consumption Analysis 2020 & 2033
- Table 40: Global Wool Industry Revenue Million Forecast, by Import Market Analysis (Value & Volume) 2020 & 2033
- Table 41: Global Wool Industry Revenue Million Forecast, by Export Market Analysis (Value & Volume) 2020 & 2033
- Table 42: Global Wool Industry Revenue Million Forecast, by Price Trend Analysis 2020 & 2033
- Table 43: Global Wool Industry Revenue Million Forecast, by Country 2020 & 2033
- Table 44: Brazil Wool Industry Revenue (Million) Forecast, by Application 2020 & 2033
- Table 45: Argentina Wool Industry Revenue (Million) Forecast, by Application 2020 & 2033
- Table 46: Global Wool Industry Revenue Million Forecast, by Production Analysis 2020 & 2033
- Table 47: Global Wool Industry Revenue Million Forecast, by Consumption Analysis 2020 & 2033
- Table 48: Global Wool Industry Revenue Million Forecast, by Import Market Analysis (Value & Volume) 2020 & 2033
- Table 49: Global Wool Industry Revenue Million Forecast, by Export Market Analysis (Value & Volume) 2020 & 2033
- Table 50: Global Wool Industry Revenue Million Forecast, by Price Trend Analysis 2020 & 2033
- Table 51: Global Wool Industry Revenue Million Forecast, by Country 2020 & 2033
- Table 52: UAE Wool Industry Revenue (Million) Forecast, by Application 2020 & 2033
- Table 53: Saudi Arabia Wool Industry Revenue (Million) Forecast, by Application 2020 & 2033
- Table 54: Oman Wool Industry Revenue (Million) Forecast, by Application 2020 & 2033
- Table 55: Morocco Wool Industry Revenue (Million) Forecast, by Application 2020 & 2033
Frequently Asked Questions
1. What is the projected Compound Annual Growth Rate (CAGR) of the Wool Industry?
The projected CAGR is approximately 3.20%.
2. Which companies are prominent players in the Wool Industry?
Key companies in the market include The Woolmark Company , Australian Wool Innovation , New Zealand Merino , Allendale Australia , Coopers Sheep Shearing.
3. What are the main segments of the Wool Industry?
The market segments include Production Analysis, Consumption Analysis, Import Market Analysis (Value & Volume), Export Market Analysis (Value & Volume), Price Trend Analysis.
4. Can you provide details about the market size?
The market size is estimated to be USD 38.97 Million as of 2022.
5. What are some drivers contributing to market growth?
; Awareness About Health Benefits Associated With Pecan Consumption; Wide Application of Pecan.
6. What are the notable trends driving market growth?
Institutional Initiatives Ensuring the Quality is Driving the Production.
7. Are there any restraints impacting market growth?
; Volatility in the Prices; Adverse Weather Conditions Affecting Yield.
8. Can you provide examples of recent developments in the market?
N/A
9. What pricing options are available for accessing the report?
Pricing options include single-user, multi-user, and enterprise licenses priced at USD 4750, USD 5250, and USD 8750 respectively.
10. Is the market size provided in terms of value or volume?
The market size is provided in terms of value, measured in Million.
11. Are there any specific market keywords associated with the report?
Yes, the market keyword associated with the report is "Wool Industry," which aids in identifying and referencing the specific market segment covered.
12. How do I determine which pricing option suits my needs best?
The pricing options vary based on user requirements and access needs. Individual users may opt for single-user licenses, while businesses requiring broader access may choose multi-user or enterprise licenses for cost-effective access to the report.
13. Are there any additional resources or data provided in the Wool Industry report?
While the report offers comprehensive insights, it's advisable to review the specific contents or supplementary materials provided to ascertain if additional resources or data are available.
14. How can I stay updated on further developments or reports in the Wool Industry?
To stay informed about further developments, trends, and reports in the Wool Industry, consider subscribing to industry newsletters, following relevant companies and organizations, or regularly checking reputable industry news sources and publications.
Methodology
Step 1 - Identification of Relevant Samples Size from Population Database


Step 2 - Approaches for Defining Global Market Size (Value, Volume* & Price*)

Note*: In applicable scenarios
Step 3 - Data Sources
Primary Research
- Web Analytics
- Survey Reports
- Research Institute
- Latest Research Reports
- Opinion Leaders
Secondary Research
- Annual Reports
- White Paper
- Latest Press Release
- Industry Association
- Paid Database
- Investor Presentations

Step 4 - Data Triangulation
Involves using different sources of information in order to increase the validity of a study
These sources are likely to be stakeholders in a program - participants, other researchers, program staff, other community members, and so on.
Then we put all data in single framework & apply various statistical tools to find out the dynamic on the market.
During the analysis stage, feedback from the stakeholder groups would be compared to determine areas of agreement as well as areas of divergence