

Key Insights
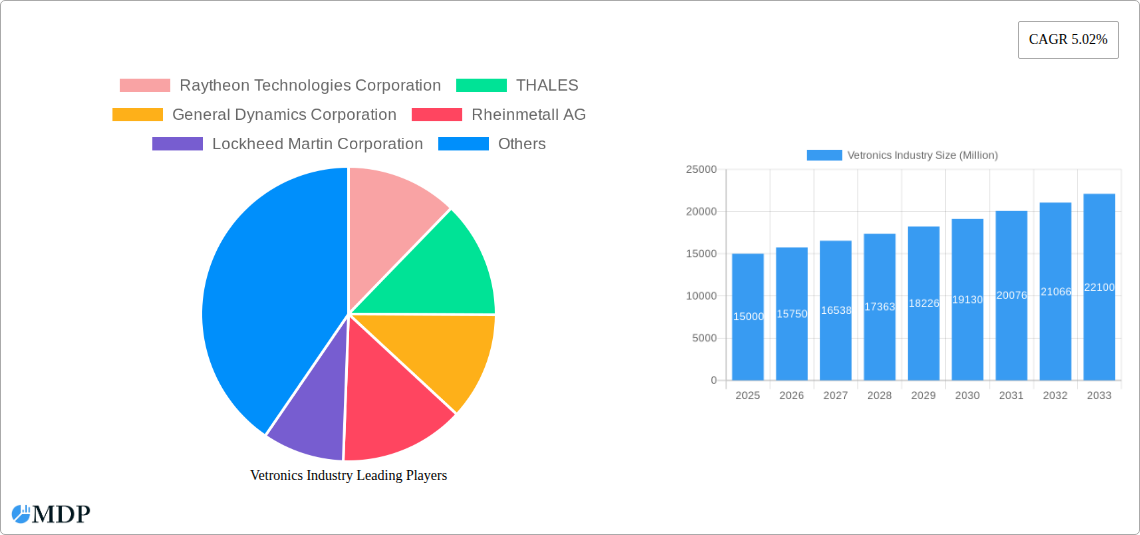
The global Vetronics market, encompassing integrated vehicle electronic systems for military vehicles, is experiencing robust growth, projected at a 5.02% CAGR from 2019 to 2033. This expansion is driven by several key factors. Firstly, the increasing demand for enhanced situational awareness and improved combat effectiveness among armed forces globally is fueling the adoption of advanced vetronics systems. Modernization initiatives within defense budgets across major regions, particularly in North America, Europe, and the Asia-Pacific region, are significantly contributing to market growth. Technological advancements, such as the integration of artificial intelligence (AI) and machine learning (ML) for improved target acquisition and autonomous navigation capabilities, are further stimulating demand. The rising prevalence of unmanned ground vehicles (UGVs) and the growing need for enhanced communication and data processing within armored vehicles are also key drivers. Segmentation within the market reveals strong growth across all vehicle types (Main Battle Tanks, Light Armored Vehicles, Amphibious Armored Vehicles, and others like APCs and UGVs), with subsystem components such as communication, navigation, and power systems all witnessing significant demand. Competition is fierce, with established players like Raytheon Technologies, Thales, General Dynamics, and Lockheed Martin leading the market, alongside other significant contributors.
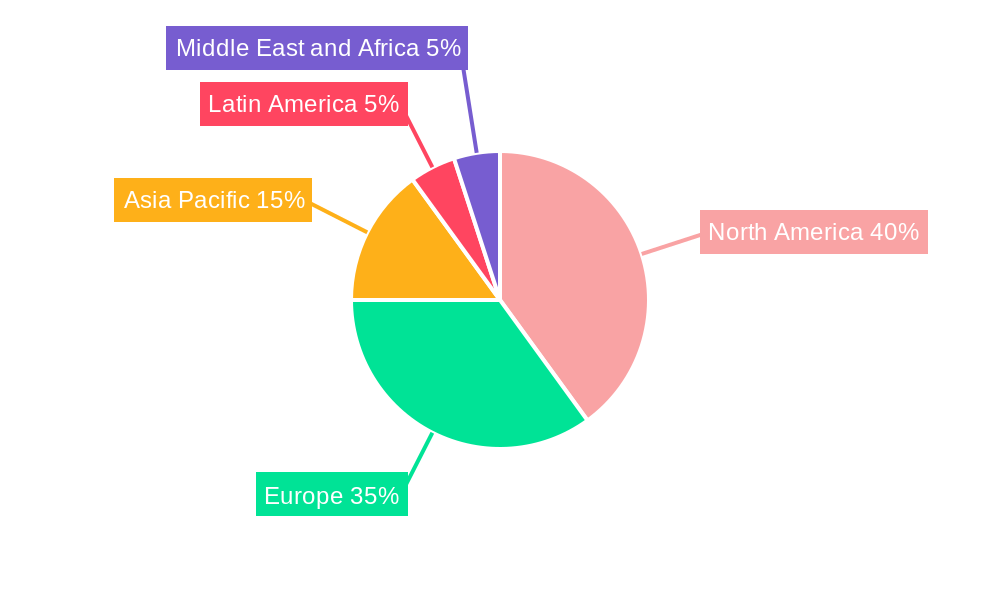
Market restraints include the high initial investment costs associated with implementing advanced vetronics systems, as well as the challenges associated with integrating complex systems and maintaining compatibility across different platforms. However, the strategic importance of enhanced battlefield situational awareness and the increasing sophistication of military operations are overriding these challenges. The market is expected to continue its upward trajectory, driven by ongoing technological innovation, geopolitical instability, and the continuous drive for superior military capabilities. Specifically, the integration of newer technologies like 5G and improved cybersecurity measures will provide further growth opportunities in the coming decade. The regional distribution of the market is expected to be heavily weighted towards North America and Europe initially, followed by a substantial rise in demand from the Asia-Pacific region due to increasing modernization efforts in countries like India and China.
Vetronics Industry Market Report: 2019-2033 Forecast
This comprehensive report provides an in-depth analysis of the Vetronics industry, offering invaluable insights for stakeholders, investors, and industry professionals. With a focus on market dynamics, leading players, and future trends, this report covers the period from 2019 to 2033, with a base year of 2025. The report projects a xx Million USD market size by 2033, highlighting significant growth opportunities within the sector. This report leverages data from the historical period (2019-2024) and incorporates forecasts spanning 2025-2033.
Vetronics Industry Market Dynamics & Concentration
The Vetronics industry exhibits a moderately concentrated market structure, with key players like Raytheon Technologies Corporation, Thales, and General Dynamics Corporation holding significant market share. The estimated combined market share of the top five players is approximately xx%. Innovation, driven by advancements in computing power, sensor technology, and artificial intelligence, is a key driver of growth. Stringent regulatory frameworks governing military technology development and deployment significantly impact market dynamics. While few direct substitutes exist, the industry faces indirect competition from alternative solutions enhancing vehicle performance. End-user preferences are shifting towards greater autonomy, enhanced situational awareness, and improved network capabilities. M&A activity within the sector is moderate, with approximately xx deals recorded during the study period (2019-2024), indicating a strategic focus on consolidation and technological integration.
- Market Concentration: Top 5 players hold xx% market share.
- Innovation Drivers: AI, advanced sensors, increased computing power.
- Regulatory Landscape: Stringent regulations impacting development and deployment.
- M&A Activity: Approximately xx deals during 2019-2024.
Vetronics Industry Industry Trends & Analysis
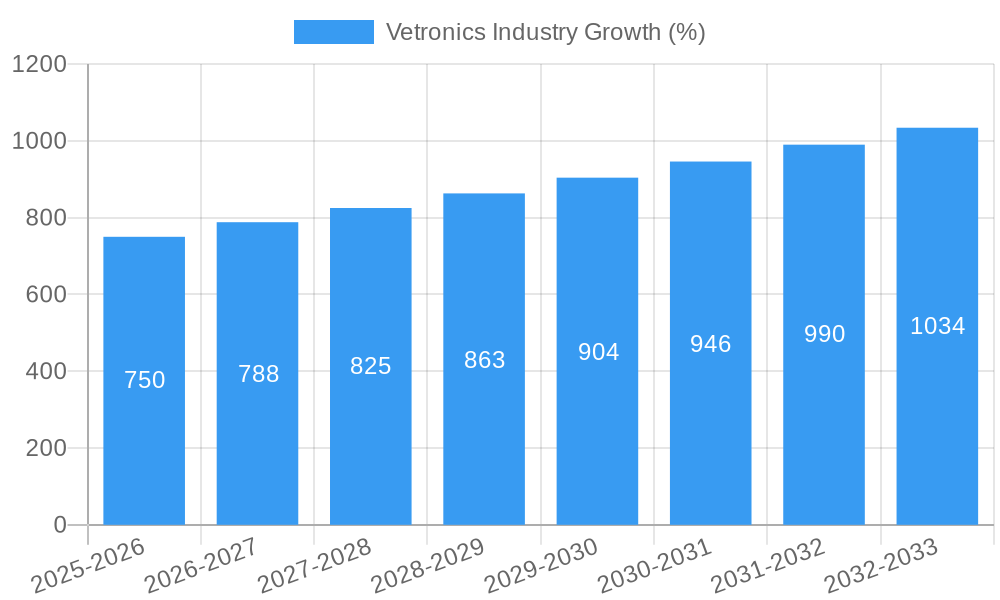
The Vetronics market is experiencing robust growth, driven by increasing defense budgets globally and a rising demand for advanced military vehicles. The market is projected to achieve a CAGR of xx% during the forecast period (2025-2033). Technological advancements, particularly in areas like AI-powered autonomy and improved communication systems, are transforming the industry landscape. Consumer preferences, primarily driven by military requirements, favor improved situational awareness, enhanced survivability, and better network integration. Competitive dynamics are characterized by intense rivalry among established players vying for government contracts and a growing presence of smaller, specialized companies focusing on niche technologies. Market penetration of advanced vetronics systems is steadily increasing, with xx% of main battle tanks currently equipped with advanced systems by 2025.
Leading Markets & Segments in Vetronics Industry
North America currently dominates the Vetronics market, driven by high defense spending and a robust technological base. Within vehicle types, Main Battle Tanks (MBTs) represent the largest segment, followed by Light Armored Vehicles (LAVs). The Power subsystem holds the largest market share amongst subsystems, owing to the crucial role of reliable power in the operational efficacy of military vehicles.
Key Drivers for North American Dominance:
- High defense budgets
- Strong technological expertise
- Established industry ecosystem
Dominant Segments:
- Vehicle Type: Main Battle Tanks (MBTs) – xx Million USD (2025). High demand due to their critical role in modern warfare.
- Subsystem: Power – xx Million USD (2025). Essential for vehicle functionality.
Vetronics Industry Product Developments
Recent product innovations focus on miniaturization, enhanced computing power, improved sensor integration, and increased network capabilities. These developments enable greater situational awareness, improved targeting accuracy, and better communication between vehicles and command centers. The key competitive advantages lie in the ability to provide robust, reliable, and easily integrated systems that meet specific military requirements. Technological trends favor AI-driven solutions and increased reliance on data analytics.
Key Drivers of Vetronics Industry Growth
Several factors propel the Vetronics industry's growth. Increasing defense budgets worldwide are a primary driver, with nations investing heavily in modernizing their military capabilities. Technological advancements in areas such as artificial intelligence (AI), machine learning, and advanced sensor technologies are significantly enhancing the capabilities of vetronics systems. Furthermore, the ongoing demand for improved situational awareness and network-centric warfare contributes substantially to the industry's expansion.
Challenges in the Vetronics Industry Market
The Vetronics industry faces challenges stemming from the complexities of military procurement processes and supply chain vulnerabilities. The stringent regulatory environment governing military technology development poses another significant challenge. Competition is fierce, with established players and emerging companies vying for limited government contracts, creating price pressures. These factors can hinder growth and profitability. For example, the increased complexity of supply chains may lead to a xx% increase in production costs.
Emerging Opportunities in Vetronics Industry
Significant opportunities exist for companies that can leverage technological advancements and meet the evolving demands of the military. The integration of AI and machine learning promises to significantly enhance situational awareness, autonomous navigation, and target identification capabilities. Strategic partnerships and collaborations between technology companies and defense contractors can drive innovation and market expansion.
Leading Players in the Vetronics Industry Sector
- Raytheon Technologies Corporation
- THALES
- General Dynamics Corporation
- Rheinmetall AG
- Lockheed Martin Corporation
- L3Harris Technologies Inc
- Leonardo S p A
- Curtiss-Wright Corporation
- BAE Systems plc
- Saab AB
Key Milestones in Vetronics Industry Industry
- February 2023: USD 481.6 Million contract awarded to General Dynamics for AN/MLQ-44 Prophet-Enhanced SIGINT vetronics systems. This signifies the continued demand for advanced SIGINT capabilities.
- July 2022: USD 280.1 Million contract awarded to General Dynamics for integrating active protection systems on M1A2 Abrams tanks. This highlights the increasing focus on vehicle survivability.
Strategic Outlook for Vetronics Industry Market
The Vetronics market is poised for sustained growth driven by the continuous evolution of military technology and the persistent need for enhanced battlefield capabilities. Opportunities exist in developing AI-driven autonomous systems, advanced sensor technologies, and improved network integration solutions. Strategic partnerships and collaborations within the industry will play a crucial role in shaping the future of this dynamic market.
Vetronics Industry Segmentation
-
1. Vehicle Type
- 1.1. Main Battle Tank
- 1.2. Light Armored Vehicle
- 1.3. Amphibious Armored Vehicle
- 1.4. Other Ve
-
2. Subsystem
- 2.1. C4
- 2.2. Navigation
- 2.3. Power
Vetronics Industry Segmentation By Geography
-
1. North America
- 1.1. United States
- 1.2. Canada
-
2. Europe
- 2.1. Germany
- 2.2. United Kingdom
- 2.3. France
- 2.4. Russia
- 2.5. Rest of Europe
-
3. Asia Pacific
- 3.1. China
- 3.2. India
- 3.3. Japan
- 3.4. South Korea
- 3.5. Australia
- 3.6. Rest of Asia Pacific
-
4. Latin America
- 4.1. Brazil
- 4.2. Rest of Latin America
-
5. Middle East and Africa
- 5.1. United Arab Emirates
- 5.2. Saudi Arabia
- 5.3. Israel
- 5.4. Rest of Middle East and Africa
Vetronics Industry REPORT HIGHLIGHTS
| Aspects | Details |
|---|---|
| Study Period | 2019-2033 |
| Base Year | 2024 |
| Estimated Year | 2025 |
| Forecast Period | 2025-2033 |
| Historical Period | 2019-2024 |
| Growth Rate | CAGR of 5.02% from 2019-2033 |
| Segmentation |
|
Table of Contents
- 1. Introduction
- 1.1. Research Scope
- 1.2. Market Segmentation
- 1.3. Research Methodology
- 1.4. Definitions and Assumptions
- 2. Executive Summary
- 2.1. Introduction
- 3. Market Dynamics
- 3.1. Introduction
- 3.2. Market Drivers
- 3.3. Market Restrains
- 3.4. Market Trends
- 3.4.1. Light Armored Vehicles Segment is Estimated to Show Remarkable Growth During the Forecast Period
- 4. Market Factor Analysis
- 4.1. Porters Five Forces
- 4.2. Supply/Value Chain
- 4.3. PESTEL analysis
- 4.4. Market Entropy
- 4.5. Patent/Trademark Analysis
- 5. Global Vetronics Industry Analysis, Insights and Forecast, 2019-2031
- 5.1. Market Analysis, Insights and Forecast - by Vehicle Type
- 5.1.1. Main Battle Tank
- 5.1.2. Light Armored Vehicle
- 5.1.3. Amphibious Armored Vehicle
- 5.1.4. Other Ve
- 5.2. Market Analysis, Insights and Forecast - by Subsystem
- 5.2.1. C4
- 5.2.2. Navigation
- 5.2.3. Power
- 5.3. Market Analysis, Insights and Forecast - by Region
- 5.3.1. North America
- 5.3.2. Europe
- 5.3.3. Asia Pacific
- 5.3.4. Latin America
- 5.3.5. Middle East and Africa
- 5.1. Market Analysis, Insights and Forecast - by Vehicle Type
- 6. North America Vetronics Industry Analysis, Insights and Forecast, 2019-2031
- 6.1. Market Analysis, Insights and Forecast - by Vehicle Type
- 6.1.1. Main Battle Tank
- 6.1.2. Light Armored Vehicle
- 6.1.3. Amphibious Armored Vehicle
- 6.1.4. Other Ve
- 6.2. Market Analysis, Insights and Forecast - by Subsystem
- 6.2.1. C4
- 6.2.2. Navigation
- 6.2.3. Power
- 6.1. Market Analysis, Insights and Forecast - by Vehicle Type
- 7. Europe Vetronics Industry Analysis, Insights and Forecast, 2019-2031
- 7.1. Market Analysis, Insights and Forecast - by Vehicle Type
- 7.1.1. Main Battle Tank
- 7.1.2. Light Armored Vehicle
- 7.1.3. Amphibious Armored Vehicle
- 7.1.4. Other Ve
- 7.2. Market Analysis, Insights and Forecast - by Subsystem
- 7.2.1. C4
- 7.2.2. Navigation
- 7.2.3. Power
- 7.1. Market Analysis, Insights and Forecast - by Vehicle Type
- 8. Asia Pacific Vetronics Industry Analysis, Insights and Forecast, 2019-2031
- 8.1. Market Analysis, Insights and Forecast - by Vehicle Type
- 8.1.1. Main Battle Tank
- 8.1.2. Light Armored Vehicle
- 8.1.3. Amphibious Armored Vehicle
- 8.1.4. Other Ve
- 8.2. Market Analysis, Insights and Forecast - by Subsystem
- 8.2.1. C4
- 8.2.2. Navigation
- 8.2.3. Power
- 8.1. Market Analysis, Insights and Forecast - by Vehicle Type
- 9. Latin America Vetronics Industry Analysis, Insights and Forecast, 2019-2031
- 9.1. Market Analysis, Insights and Forecast - by Vehicle Type
- 9.1.1. Main Battle Tank
- 9.1.2. Light Armored Vehicle
- 9.1.3. Amphibious Armored Vehicle
- 9.1.4. Other Ve
- 9.2. Market Analysis, Insights and Forecast - by Subsystem
- 9.2.1. C4
- 9.2.2. Navigation
- 9.2.3. Power
- 9.1. Market Analysis, Insights and Forecast - by Vehicle Type
- 10. Middle East and Africa Vetronics Industry Analysis, Insights and Forecast, 2019-2031
- 10.1. Market Analysis, Insights and Forecast - by Vehicle Type
- 10.1.1. Main Battle Tank
- 10.1.2. Light Armored Vehicle
- 10.1.3. Amphibious Armored Vehicle
- 10.1.4. Other Ve
- 10.2. Market Analysis, Insights and Forecast - by Subsystem
- 10.2.1. C4
- 10.2.2. Navigation
- 10.2.3. Power
- 10.1. Market Analysis, Insights and Forecast - by Vehicle Type
- 11. North America Vetronics Industry Analysis, Insights and Forecast, 2019-2031
- 11.1. Market Analysis, Insights and Forecast - By Country/Sub-region
- 11.1.1 United States
- 11.1.2 Canada
- 12. Europe Vetronics Industry Analysis, Insights and Forecast, 2019-2031
- 12.1. Market Analysis, Insights and Forecast - By Country/Sub-region
- 12.1.1 Germany
- 12.1.2 United Kingdom
- 12.1.3 France
- 12.1.4 Russia
- 12.1.5 Rest of Europe
- 13. Asia Pacific Vetronics Industry Analysis, Insights and Forecast, 2019-2031
- 13.1. Market Analysis, Insights and Forecast - By Country/Sub-region
- 13.1.1 India
- 13.1.2 China
- 13.1.3 South Korea
- 13.1.4 Australia
- 13.1.5 Japan
- 13.1.6 Rest of Asia Pacific
- 14. Latin America Vetronics Industry Analysis, Insights and Forecast, 2019-2031
- 14.1. Market Analysis, Insights and Forecast - By Country/Sub-region
- 14.1.1 Brazil
- 14.1.2 Rest of Latin America
- 15. Middle East and Africa Vetronics Industry Analysis, Insights and Forecast, 2019-2031
- 15.1. Market Analysis, Insights and Forecast - By Country/Sub-region
- 15.1.1 United Arab Emirates
- 15.1.2 Saudi Arabia
- 15.1.3 Israel
- 15.1.4 Rest of Middle East and Africa
- 16. Competitive Analysis
- 16.1. Global Market Share Analysis 2024
- 16.2. Company Profiles
- 16.2.1 Raytheon Technologies Corporation
- 16.2.1.1. Overview
- 16.2.1.2. Products
- 16.2.1.3. SWOT Analysis
- 16.2.1.4. Recent Developments
- 16.2.1.5. Financials (Based on Availability)
- 16.2.2 THALES
- 16.2.2.1. Overview
- 16.2.2.2. Products
- 16.2.2.3. SWOT Analysis
- 16.2.2.4. Recent Developments
- 16.2.2.5. Financials (Based on Availability)
- 16.2.3 General Dynamics Corporation
- 16.2.3.1. Overview
- 16.2.3.2. Products
- 16.2.3.3. SWOT Analysis
- 16.2.3.4. Recent Developments
- 16.2.3.5. Financials (Based on Availability)
- 16.2.4 Rheinmetall AG
- 16.2.4.1. Overview
- 16.2.4.2. Products
- 16.2.4.3. SWOT Analysis
- 16.2.4.4. Recent Developments
- 16.2.4.5. Financials (Based on Availability)
- 16.2.5 Lockheed Martin Corporation
- 16.2.5.1. Overview
- 16.2.5.2. Products
- 16.2.5.3. SWOT Analysis
- 16.2.5.4. Recent Developments
- 16.2.5.5. Financials (Based on Availability)
- 16.2.6 L3Harris Technologies Inc
- 16.2.6.1. Overview
- 16.2.6.2. Products
- 16.2.6.3. SWOT Analysis
- 16.2.6.4. Recent Developments
- 16.2.6.5. Financials (Based on Availability)
- 16.2.7 Leonardo S p A
- 16.2.7.1. Overview
- 16.2.7.2. Products
- 16.2.7.3. SWOT Analysis
- 16.2.7.4. Recent Developments
- 16.2.7.5. Financials (Based on Availability)
- 16.2.8 Curtiss-Wright Corporation
- 16.2.8.1. Overview
- 16.2.8.2. Products
- 16.2.8.3. SWOT Analysis
- 16.2.8.4. Recent Developments
- 16.2.8.5. Financials (Based on Availability)
- 16.2.9 BAE Systems plc
- 16.2.9.1. Overview
- 16.2.9.2. Products
- 16.2.9.3. SWOT Analysis
- 16.2.9.4. Recent Developments
- 16.2.9.5. Financials (Based on Availability)
- 16.2.10 Saab AB
- 16.2.10.1. Overview
- 16.2.10.2. Products
- 16.2.10.3. SWOT Analysis
- 16.2.10.4. Recent Developments
- 16.2.10.5. Financials (Based on Availability)
- 16.2.1 Raytheon Technologies Corporation
List of Figures
- Figure 1: Global Vetronics Industry Revenue Breakdown (Million, %) by Region 2024 & 2032
- Figure 2: North America Vetronics Industry Revenue (Million), by Country 2024 & 2032
- Figure 3: North America Vetronics Industry Revenue Share (%), by Country 2024 & 2032
- Figure 4: Europe Vetronics Industry Revenue (Million), by Country 2024 & 2032
- Figure 5: Europe Vetronics Industry Revenue Share (%), by Country 2024 & 2032
- Figure 6: Asia Pacific Vetronics Industry Revenue (Million), by Country 2024 & 2032
- Figure 7: Asia Pacific Vetronics Industry Revenue Share (%), by Country 2024 & 2032
- Figure 8: Latin America Vetronics Industry Revenue (Million), by Country 2024 & 2032
- Figure 9: Latin America Vetronics Industry Revenue Share (%), by Country 2024 & 2032
- Figure 10: Middle East and Africa Vetronics Industry Revenue (Million), by Country 2024 & 2032
- Figure 11: Middle East and Africa Vetronics Industry Revenue Share (%), by Country 2024 & 2032
- Figure 12: North America Vetronics Industry Revenue (Million), by Vehicle Type 2024 & 2032
- Figure 13: North America Vetronics Industry Revenue Share (%), by Vehicle Type 2024 & 2032
- Figure 14: North America Vetronics Industry Revenue (Million), by Subsystem 2024 & 2032
- Figure 15: North America Vetronics Industry Revenue Share (%), by Subsystem 2024 & 2032
- Figure 16: North America Vetronics Industry Revenue (Million), by Country 2024 & 2032
- Figure 17: North America Vetronics Industry Revenue Share (%), by Country 2024 & 2032
- Figure 18: Europe Vetronics Industry Revenue (Million), by Vehicle Type 2024 & 2032
- Figure 19: Europe Vetronics Industry Revenue Share (%), by Vehicle Type 2024 & 2032
- Figure 20: Europe Vetronics Industry Revenue (Million), by Subsystem 2024 & 2032
- Figure 21: Europe Vetronics Industry Revenue Share (%), by Subsystem 2024 & 2032
- Figure 22: Europe Vetronics Industry Revenue (Million), by Country 2024 & 2032
- Figure 23: Europe Vetronics Industry Revenue Share (%), by Country 2024 & 2032
- Figure 24: Asia Pacific Vetronics Industry Revenue (Million), by Vehicle Type 2024 & 2032
- Figure 25: Asia Pacific Vetronics Industry Revenue Share (%), by Vehicle Type 2024 & 2032
- Figure 26: Asia Pacific Vetronics Industry Revenue (Million), by Subsystem 2024 & 2032
- Figure 27: Asia Pacific Vetronics Industry Revenue Share (%), by Subsystem 2024 & 2032
- Figure 28: Asia Pacific Vetronics Industry Revenue (Million), by Country 2024 & 2032
- Figure 29: Asia Pacific Vetronics Industry Revenue Share (%), by Country 2024 & 2032
- Figure 30: Latin America Vetronics Industry Revenue (Million), by Vehicle Type 2024 & 2032
- Figure 31: Latin America Vetronics Industry Revenue Share (%), by Vehicle Type 2024 & 2032
- Figure 32: Latin America Vetronics Industry Revenue (Million), by Subsystem 2024 & 2032
- Figure 33: Latin America Vetronics Industry Revenue Share (%), by Subsystem 2024 & 2032
- Figure 34: Latin America Vetronics Industry Revenue (Million), by Country 2024 & 2032
- Figure 35: Latin America Vetronics Industry Revenue Share (%), by Country 2024 & 2032
- Figure 36: Middle East and Africa Vetronics Industry Revenue (Million), by Vehicle Type 2024 & 2032
- Figure 37: Middle East and Africa Vetronics Industry Revenue Share (%), by Vehicle Type 2024 & 2032
- Figure 38: Middle East and Africa Vetronics Industry Revenue (Million), by Subsystem 2024 & 2032
- Figure 39: Middle East and Africa Vetronics Industry Revenue Share (%), by Subsystem 2024 & 2032
- Figure 40: Middle East and Africa Vetronics Industry Revenue (Million), by Country 2024 & 2032
- Figure 41: Middle East and Africa Vetronics Industry Revenue Share (%), by Country 2024 & 2032
List of Tables
- Table 1: Global Vetronics Industry Revenue Million Forecast, by Region 2019 & 2032
- Table 2: Global Vetronics Industry Revenue Million Forecast, by Vehicle Type 2019 & 2032
- Table 3: Global Vetronics Industry Revenue Million Forecast, by Subsystem 2019 & 2032
- Table 4: Global Vetronics Industry Revenue Million Forecast, by Region 2019 & 2032
- Table 5: Global Vetronics Industry Revenue Million Forecast, by Country 2019 & 2032
- Table 6: United States Vetronics Industry Revenue (Million) Forecast, by Application 2019 & 2032
- Table 7: Canada Vetronics Industry Revenue (Million) Forecast, by Application 2019 & 2032
- Table 8: Global Vetronics Industry Revenue Million Forecast, by Country 2019 & 2032
- Table 9: Germany Vetronics Industry Revenue (Million) Forecast, by Application 2019 & 2032
- Table 10: United Kingdom Vetronics Industry Revenue (Million) Forecast, by Application 2019 & 2032
- Table 11: France Vetronics Industry Revenue (Million) Forecast, by Application 2019 & 2032
- Table 12: Russia Vetronics Industry Revenue (Million) Forecast, by Application 2019 & 2032
- Table 13: Rest of Europe Vetronics Industry Revenue (Million) Forecast, by Application 2019 & 2032
- Table 14: Global Vetronics Industry Revenue Million Forecast, by Country 2019 & 2032
- Table 15: India Vetronics Industry Revenue (Million) Forecast, by Application 2019 & 2032
- Table 16: China Vetronics Industry Revenue (Million) Forecast, by Application 2019 & 2032
- Table 17: South Korea Vetronics Industry Revenue (Million) Forecast, by Application 2019 & 2032
- Table 18: Australia Vetronics Industry Revenue (Million) Forecast, by Application 2019 & 2032
- Table 19: Japan Vetronics Industry Revenue (Million) Forecast, by Application 2019 & 2032
- Table 20: Rest of Asia Pacific Vetronics Industry Revenue (Million) Forecast, by Application 2019 & 2032
- Table 21: Global Vetronics Industry Revenue Million Forecast, by Country 2019 & 2032
- Table 22: Brazil Vetronics Industry Revenue (Million) Forecast, by Application 2019 & 2032
- Table 23: Rest of Latin America Vetronics Industry Revenue (Million) Forecast, by Application 2019 & 2032
- Table 24: Global Vetronics Industry Revenue Million Forecast, by Country 2019 & 2032
- Table 25: United Arab Emirates Vetronics Industry Revenue (Million) Forecast, by Application 2019 & 2032
- Table 26: Saudi Arabia Vetronics Industry Revenue (Million) Forecast, by Application 2019 & 2032
- Table 27: Israel Vetronics Industry Revenue (Million) Forecast, by Application 2019 & 2032
- Table 28: Rest of Middle East and Africa Vetronics Industry Revenue (Million) Forecast, by Application 2019 & 2032
- Table 29: Global Vetronics Industry Revenue Million Forecast, by Vehicle Type 2019 & 2032
- Table 30: Global Vetronics Industry Revenue Million Forecast, by Subsystem 2019 & 2032
- Table 31: Global Vetronics Industry Revenue Million Forecast, by Country 2019 & 2032
- Table 32: United States Vetronics Industry Revenue (Million) Forecast, by Application 2019 & 2032
- Table 33: Canada Vetronics Industry Revenue (Million) Forecast, by Application 2019 & 2032
- Table 34: Global Vetronics Industry Revenue Million Forecast, by Vehicle Type 2019 & 2032
- Table 35: Global Vetronics Industry Revenue Million Forecast, by Subsystem 2019 & 2032
- Table 36: Global Vetronics Industry Revenue Million Forecast, by Country 2019 & 2032
- Table 37: Germany Vetronics Industry Revenue (Million) Forecast, by Application 2019 & 2032
- Table 38: United Kingdom Vetronics Industry Revenue (Million) Forecast, by Application 2019 & 2032
- Table 39: France Vetronics Industry Revenue (Million) Forecast, by Application 2019 & 2032
- Table 40: Russia Vetronics Industry Revenue (Million) Forecast, by Application 2019 & 2032
- Table 41: Rest of Europe Vetronics Industry Revenue (Million) Forecast, by Application 2019 & 2032
- Table 42: Global Vetronics Industry Revenue Million Forecast, by Vehicle Type 2019 & 2032
- Table 43: Global Vetronics Industry Revenue Million Forecast, by Subsystem 2019 & 2032
- Table 44: Global Vetronics Industry Revenue Million Forecast, by Country 2019 & 2032
- Table 45: China Vetronics Industry Revenue (Million) Forecast, by Application 2019 & 2032
- Table 46: India Vetronics Industry Revenue (Million) Forecast, by Application 2019 & 2032
- Table 47: Japan Vetronics Industry Revenue (Million) Forecast, by Application 2019 & 2032
- Table 48: South Korea Vetronics Industry Revenue (Million) Forecast, by Application 2019 & 2032
- Table 49: Australia Vetronics Industry Revenue (Million) Forecast, by Application 2019 & 2032
- Table 50: Rest of Asia Pacific Vetronics Industry Revenue (Million) Forecast, by Application 2019 & 2032
- Table 51: Global Vetronics Industry Revenue Million Forecast, by Vehicle Type 2019 & 2032
- Table 52: Global Vetronics Industry Revenue Million Forecast, by Subsystem 2019 & 2032
- Table 53: Global Vetronics Industry Revenue Million Forecast, by Country 2019 & 2032
- Table 54: Brazil Vetronics Industry Revenue (Million) Forecast, by Application 2019 & 2032
- Table 55: Rest of Latin America Vetronics Industry Revenue (Million) Forecast, by Application 2019 & 2032
- Table 56: Global Vetronics Industry Revenue Million Forecast, by Vehicle Type 2019 & 2032
- Table 57: Global Vetronics Industry Revenue Million Forecast, by Subsystem 2019 & 2032
- Table 58: Global Vetronics Industry Revenue Million Forecast, by Country 2019 & 2032
- Table 59: United Arab Emirates Vetronics Industry Revenue (Million) Forecast, by Application 2019 & 2032
- Table 60: Saudi Arabia Vetronics Industry Revenue (Million) Forecast, by Application 2019 & 2032
- Table 61: Israel Vetronics Industry Revenue (Million) Forecast, by Application 2019 & 2032
- Table 62: Rest of Middle East and Africa Vetronics Industry Revenue (Million) Forecast, by Application 2019 & 2032
Frequently Asked Questions
1. What is the projected Compound Annual Growth Rate (CAGR) of the Vetronics Industry?
The projected CAGR is approximately 5.02%.
2. Which companies are prominent players in the Vetronics Industry?
Key companies in the market include Raytheon Technologies Corporation, THALES, General Dynamics Corporation, Rheinmetall AG, Lockheed Martin Corporation, L3Harris Technologies Inc, Leonardo S p A, Curtiss-Wright Corporation, BAE Systems plc, Saab AB.
3. What are the main segments of the Vetronics Industry?
The market segments include Vehicle Type, Subsystem.
4. Can you provide details about the market size?
The market size is estimated to be USD XX Million as of 2022.
5. What are some drivers contributing to market growth?
N/A
6. What are the notable trends driving market growth?
Light Armored Vehicles Segment is Estimated to Show Remarkable Growth During the Forecast Period.
7. Are there any restraints impacting market growth?
N/A
8. Can you provide examples of recent developments in the market?
In February 2023, the US Army Contracting Command announced a USD 481.6 million contract to the General Dynamics Mission Systems segment to sustain the AN/MLQ-44 Prophet-Enhanced SIGINT vetronics systems.
9. What pricing options are available for accessing the report?
Pricing options include single-user, multi-user, and enterprise licenses priced at USD 4750, USD 5250, and USD 8750 respectively.
10. Is the market size provided in terms of value or volume?
The market size is provided in terms of value, measured in Million.
11. Are there any specific market keywords associated with the report?
Yes, the market keyword associated with the report is "Vetronics Industry," which aids in identifying and referencing the specific market segment covered.
12. How do I determine which pricing option suits my needs best?
The pricing options vary based on user requirements and access needs. Individual users may opt for single-user licenses, while businesses requiring broader access may choose multi-user or enterprise licenses for cost-effective access to the report.
13. Are there any additional resources or data provided in the Vetronics Industry report?
While the report offers comprehensive insights, it's advisable to review the specific contents or supplementary materials provided to ascertain if additional resources or data are available.
14. How can I stay updated on further developments or reports in the Vetronics Industry?
To stay informed about further developments, trends, and reports in the Vetronics Industry, consider subscribing to industry newsletters, following relevant companies and organizations, or regularly checking reputable industry news sources and publications.
Methodology
Step 1 - Identification of Relevant Samples Size from Population Database


Step 2 - Approaches for Defining Global Market Size (Value, Volume* & Price*)

Note*: In applicable scenarios
Step 3 - Data Sources
Primary Research
- Web Analytics
- Survey Reports
- Research Institute
- Latest Research Reports
- Opinion Leaders
Secondary Research
- Annual Reports
- White Paper
- Latest Press Release
- Industry Association
- Paid Database
- Investor Presentations

Step 4 - Data Triangulation
Involves using different sources of information in order to increase the validity of a study
These sources are likely to be stakeholders in a program - participants, other researchers, program staff, other community members, and so on.
Then we put all data in single framework & apply various statistical tools to find out the dynamic on the market.
During the analysis stage, feedback from the stakeholder groups would be compared to determine areas of agreement as well as areas of divergence
